The Gemini/HST Cluster Project: Structural and Photometric Properties of Galaxies in Three z Clusters
Abstract
We present the data processing and analysis techniques we are using to determine structural and photometric properties of galaxies in our Gemini/HST Galaxy Cluster Project sample. The goal of this study is to understand cluster galaxy evolution in terms of scaling relations and structural properties of cluster galaxies at redshifts z . To derive parameters such as total magnitude, half-light radius, effective surface brightness, and Sersic n, we fit r1/4 law and Sersic function 2-D surface brightness profiles to each of the galaxies in our sample. Using simulated galaxies, we test how the assumed profile affects the derived parameters and how the uncertainties affect our Fundamental Plane results. We find that while fitting galaxies which have Sersic index n with r1/4 law profiles systematically overestimates the galaxy radius and flux, the combination of profile parameters that enter the Fundamental Plane has uncertainties that are small. Average systematic offsets and associated random uncertainties in magnitude and for n galaxies fitted with r1/4 law profiles are and respectively. The combination of effective radius and surface brightness, , that enters the Fundamental Plane produces offsets smaller than . This systematic error is insignificant and independent of galaxy magnitude or size. A catalog of photometry and surface brightness profile parameters is presented for three of the clusters in our sample, RX J0142.0+2131, RX J0152.7-1357, and RX J1226.9+3332 at redshifts 0.28, 0.83, and 0.89 respectively.
1 Introduction
Theoretical hierarchical models of galaxy formation predict that numerous small halos, primordial dwarf galaxies, collapsed early on in the history of the universe. These merged to form ever larger halos with deeper potentials and greater baryonic mass accumulation. While these CDM models are successful at explaining structure formation on large scales, the agreement with observations is worse on the level of galaxies (Conselice et al., 2007). Understanding the formation of primordial galaxies and how galaxies came to have the stellar populations, masses, and structural properties observed in the local universe is fundamental to our understanding of cosmology.
Generally, the physical processes a galaxy undergoes during its evolution depend primarily on only two factors: mass and environment. While mass may affect galaxy structural and dynamical properties and star formation activity in predictable ways, the local environment of the galaxy is the source of complex evolutionary processes such as galaxy-galaxy merging, harassment, and stripping. Despite this, tight scaling relations of galaxy properties exist and must be reconciled with potentially different evolutionary paths. Such scaling relations include the Tully-Fisher relation between disk galaxy total magnitude and rotational velocity (Tully & Fisher, 1977), the three-parameter Fundamental Plane (FP) relationship between early type galaxy velocity dispersion, effective radius, and effective surface brightness (e.g. Dressler et al., 1987; Djorgovski & Davis, 1987), the red sequence for early type galaxies, and relationships between absorption line strengths and central velocity dispersion. How these tight relations evolve with redshift or vary with galaxy mass places strong constraints on galaxy formation and evolution models.
Observational studies of cluster galaxies have found that the most massive galaxies are composed mainly of old stellar populations suggesting that massive early type galaxies formed at redshifts (e.g. Bower et al., 1992; Jørgensen et al., 1999; Trager et al., 2000; Blakeslee et al., 2003; Mei et al., 2006). There is little evidence for recent star formation in these quiescent galaxies. They form a red sequence with little scatter in a color-magnitude diagram (e.g. Sandage & Visvanathan, 1978) and they obey tight scaling relations in their kinematic and structural properties (e.g. Dressler et al., 1987; Jørgensen et al., 1996). These all suggest an early epoch of star formation in a homogeneously old galaxy population. Although massive galaxies exhibit pure passive evolution since z evolving only in luminosity and color as stellar populations age, observations have also shown that clusters and lower mass cluster galaxies continue to evolve at intermediate redshifts. The fraction of blue, star forming galaxies increases with redshift (e.g. Butcher & Oemler, 1984; Ellingson et al., 2001) while larger fractions of spiral to S0 galaxies are observed in clusters at intermediate redshifts (e.g. Dressler et al., 1997).
Meanwhile hierarchical structure formation models predict that galaxies form from the collective mergers of smaller galaxies. These mergers are expected to continue with high frequency through intermediate redshifts (e.g. Baugh et al., 1996). Semi-analytical models predict a characteristic mass a factor of 3 lower than found at z = 1 (Poggianti, 2004) with simulations underpredicting the numbers and mass densities of the most massive galaxies by a factor of over 100 (Conselice et al., 2007), all implying that massive galaxies undergo a faster build-up than predicted. Dynamical models also often show a greater range in early type galaxy structure and kinematics than observed (de Zeeuw & Franx, 1991).
In order to reconcile apparently contradictory observations with formation and evolution models, we must study galaxy populations over a wide range of redshifts and for a wide range in galaxy mass. Previous studies have tended to investigate large samples of galaxies within a single cluster or epoch (e.g. Fritz et al., 2005; Smith et al., 2004), or fewer galaxies over a range of redshifts (e.g. Treu et al., 2002), and often only the brightest, most massive galaxies. Through the Gemini/HST Galaxy Cluster Project, we seek to better understand the processes driving cluster galaxy evolution by studying scaling relations as a function of mass and environment since z , at a time when the universe was only half its current age. We have therefore obtained data for a large sample of galaxies, which includes a sufficient number of galaxies at each redshift to accurately measure scaling relations and a sufficient number of redshifts to measure trends in the scaling relations as a function of redshift (Jørgensen et al., 2006, 2007). At each redshift our sample spans a wide range in galaxy luminosity in order to investigate the role of galaxy mass. To discriminate between evolutionary effects due to environment and due to galaxy mass we have obtained consistent radial coverage for each cluster.
In a previous paper we have described the project and sample (Jørgensen et al., 2005). Our sample of galaxy clusters consists of 15 X-ray selected massive clusters with redshifts ranging from . For each of the clusters in our sample, we have obtained Gemini/GMOS spectra for cluster members with a wide range of luminosities. The targetted objects are chosen independently of morphology since there is evidence that morphologies may continue to evolve even to the present epoch and we wish to avoid “progenitor bias” (van Dokkum & Franx, 2001). From the spectra, we obtain redshifts, velocity dispersions, and line index measurements. Using HST imaging data, we measure structural parameters and surface brightness profiles. With this large sample, we are studying scaling relations such as line index strengths and the FP as a function of redshift. Line index measurements probe chemical enrichment providing insight into the star formation histories of the galaxies. The FP is examined in terms of mass and mass-to-light (M/L) ratios in order to probe both assembly histories and luminosity evolution. We are using structural parameters for quantitative measurements of morphology to study morphological evolution. We have published the results on line index relations for RX J0152.7-1357 (Jørgensen et al., 2005) and RX J0142.0+2131 (Barr et al., 2005), and the FP for RX J0142.0+2131 (Barr et al., 2006) and RX J0152.7-1357 and RX J1226.9+3332 (Jørgensen et al., 2006, 2007).
The FP relates surface brightness, effective radius, and velocity dispersion in a tight and well established relation (Dressler et al., 1987; Djorgovski & Davis, 1987; Jørgensen et al., 1996)
| (1) |
It can also be described as a relation between M/L and or as
| (2) |
which makes the FP a powerful tool to study the star formation and assembly history in early type galaxies. A comparison of the FP for our high redshift sample to that of low redshift Coma cluster galaxies has revealed a number of interesting results. The two z clusters exhibit a steeper slope than the low redshift FP. We find this to be evidence for downsizing in which the lower mass galaxies have undergone more recent star formation and are overluminous compared to their low-z counterparts (Jørgensen et al., 2006, 2007). The FP for RX J0142.0+2131 at z=0.28, while having the same slope as the low z sample, displays a greater scatter, possible evidence for the galaxies having undergone rapid bursts of star formation during a cluster merger at z (Barr et al., 2006).
Future papers will address the FP, line index scaling relations, and galaxy quantitative morphologies for all clusters in our sample in order to compare the star formation and assembly histories over a range of redshifts. Here we present the data reduction and analysis techniques we have used to measure structural and photometric parameters for three clusters in our sample, RX J0152.7-1357, RX J1226.9+3332, and RX J0142.0+2131.
RX J0152.7-1357 is a massive cluster at z=0.83 originally discovered from ROSAT data. XMM-Newton and Chandra observations later showed the cluster to consist of two subclumps in the early stages of merging (Jones et al., 2004; Maughan et al., 2003; Girardi et al., 2005). Much research has been done on this cluster, including recent studies of star formation rates (Homeier et al., 2005), morphology, and the color-magnitude diagram (Blakeslee et al., 2006). RX J1226.9+3332 is a massive cluster at z=0.89 and also the most X-ray luminous cluster known at such high redshift. It was discovered in the Wide Angle ROSAT Pointed Survey (Ebeling et al., 2001) and exhibits a relaxed morphology. However, in a deep XXM-Newton and Chandra study of the X-ray mass analysis of this cluster, Maughan et al. (2007) find evidence for a recent or ongoing merger event. RX J0142.0+2131, at z=0.28, was first identified as a massive cluster in both the Northern ROSAT All-Sky Galaxy Cluster Survey (Böhringer et al., 2000) and the ROSAT extended Brightest Cluster Sample (Ebeling et al., 2000). Although it is a relatively poor cluster, it displays a large cluster velocity dispersion, yet shows no signs of substructure (Barr et al., 2005).
In this paper we describe our measurements of the physical properties of the galaxies in our sample and analyze how uncertainties affect the derivation of the scaling relations and overall results of our study. In Sections 2 and 3 we describe our observations and our imaging data reduction process. Catalogs of photometric and structural parameters for RX J0152.7-1357, RX J1226.9+3332, and RX J0142.0+2131 are presented in Section 4. We discuss internal and external consistency of our results and implications on the measurements of the FP in Section 5. A summary is presented in Section 6. We assume km s-1 Mpc-1, , and .
2 Observations
We have acquired ground-based imaging for the clusters in our sample using GMOS on the Gemini-North 8m telescope. GMOS spectroscopy was obtained for galaxies in each cluster field, of which turned out to be cluster members. GMOS is described in Hook et al. (2004). Details of how the spectroscopic sample was chosen and the observations and reduction of these data are described elsewhere (Jørgensen et al. in prep; Jørgensen et al., 2005; Barr et al., 2005). For each of our clusters we have obtained new ACS imaging or use archival HST data to study the galaxy structural parameters with high resolution data having FWHM . Data for the three clusters described in this paper were obtained using the ACS Wide Field Channel. The ACS/WFC detector consists of two 2048x4096 chips separated by a gap of 2.5 arcsec with a mean pixel scale and a field of view (Sirianni et al., 2005).
For RX J0152.7-1357 (z=0.83), we used archive data from Program ID 9290 which includes 4 mosaicked ACS fields observed in 3 filters each, F850LP, F775W, and F625W, corresponding to the , and bands in our GMOS data. Total exposure times for each field were 4800s in the band and 4750s in the and bands. These data contain all 29 of our spectroscopic sample cluster member galaxies.
For RX J1226.9+3332 (z=0.89), ACS archival data from Program ID 9033 included four fields in two bands each, F606W and F814W, the latter equivalent to the Cousins band. Exposure times were s. These fields contain our original 25 sample galaxies used in Jørgensen et al. (2006, 2007) along with an additional 87 galaxies from an extended sample.
We obtained data for RX J0142.0+2131 (z=0.28) from Cycle 12 Program ID 9770 observed on UT 2003 November 01 and 2004 July 03. Two fields were imaged in a single band, F775W. The total exposure time for each position was 4420s. 28 of 30 spectroscopic sample cluster member galaxies were covered by these fields. See Table 1 for a summary of all the ACS data used in this paper.
3 Data Processing
3.1 HST/ACS Initial Processing and photometry
The three clusters discussed in this paper were used to establish the data reduction pipeline. Although the data are distributed already processed from STScI we chose to redo the reduction starting with the stacking of flattened images in order to achieve better cosmic ray removal. In some cases we also wished to mask out large reflections or saturated stars before stacking the images. We used MULTIDRIZZLE v. 2.3, an STScI distributed PyRAF task111STSDAS and PyRAF are products of the Space Telescope Science Institute, which is operated by AURA for NASA (Koekemoer et al., 2002), which drizzles, distortion corrects, and stacks images all in one.
To obtain better relative shifts between separate exposures at each pointing, we initially ran MULTIDRIZZLE to generate a median combined image for each pointing along with individually drizzled images shifted to the reference frame of the first image in each set. The images at this point were aligned simply by using the header WCS. We then ran a subset of the Gemini IRAF package222IRAF is distributed by National Optical Astronomy Observatory, which is operated by the Association of Universities for Research in Astronomy (AURA), Inc., under cooperative agreement with the National Science Foundation. The Gemini IRAF package is distributed by Gemini Observatory, which is operated by AURA. task IMCOADD which first detects stars on the cosmic ray-free median image using DAOPHOT. It then locates these stars on the individual drizzled images and measures any additional relative shifts. This step created a shift file suitable as input for MULTIDRIZZLE which was subsequently run a second time to create the final stacked, distortion corrected, cosmic ray cleaned image. A wrapper script was used to perform the necessary steps which included an option to allow manual sky subtraction, for use when bright stars or reflections effected the image. We chose not to perform any resampling during the drizzle and we used the default square drizzle kernel as no improvement was observed with other kernels.
MULTIDRIZZLE output includes weight and context images. Each pixel within the context image is encoded with information about which specific individual images were used during the combining operation for that pixel (ie. were free from chip defects and CRs). We use the context image to generate a map which more generally contains information about the number of pixels that were combined to create each stacked pixel value. This is used to calculate more rigorously the sigma noise map for each ACS image taking into account the correlated noise produced by the drizzling (Casertano et al., 2000). The noise at each pixel is calculated as where RN is the readnoise, Ncomb is the number of pixels used in the drizzling, gaineff is the effective gain at each pixel incorporating Ncomb, and N denotes the counts in that pixel. FA corrects for the correlated noise and comes from appendix 6 in Casertano et al. (2000). It depends on the output pixel scale (in this case the fractional size compared to the original) and the drop size for the drizzling. In our case, scale and pixfrac are both 1.0 since we do not drizzle to smaller scales. FA is also dependent on the size of the area considered since correlated noise scales from single pixel noise differently than uncorrelated noise. We did not take this area correction into account here. Thus, our noise map may incorrectly estimate the true photometric errors. Although this would have an effect on the GALFIT error estimates on the individual parameters, we do not expect this to affect our results since we determine parameter measurement uncertainties independently through galaxy simulations (Section 5).
The weight image uses weighting based on exposure times. To improve extraction of galaxies in later processing using SExtractor, we adjust this weight image using our n-pixel map described above to set a very low weight near image borders and in gap regions where few overlapping images produce greater noise.
The zeropoint calibration in the AB system is provided by STScI for the ACS camera in each filter used (Sirianni et al., 2005). We correct the WCS in the header of the stacked images, which were in most cases off by a shift of about in RA and in DEC, by using the IRAF tasks CCMAP and CCFIND along with coordinates for these galaxies previously obtained from our GMOS images relative to the USNO catalog (Monet et al., 1998). Final coordinates are generally good to about in both RA and DEC.
3.2 SExtractor Object Detection and Photometry
We used SExtractor (Bertin & Arnouts, 1996) v.2.3.2 to detect all objects in the images having at least 9 contiguous pixels greater than above the sky noise. The weight image described above was used to minimize the number of spurious noise detections predominently found near image borders and, in some cases, chip gap regions of the combined dithered images.
SExtractor was run in association matching mode to specifically recover our spectroscopic sample galaxies. It was then run a second time to detect all other galaxies in the field, using dual image mode in cases where fields had been observed in multiple bands. In this mode, we use the band closest to the band for the initial detection of the objects. After using the IRAF task imshift to precisely align images in other bands to the band image, we run SExtractor to perform photometry in these other bands using the band determined apertures. This produces matched catalogs of objects in all bands.
After detecting all objects in a first pass through the data, SExtractor makes a second pass to deblend merged objects. We ran a number of tests to determine the best set of SExtractor deblending parameters, DEBLEND_NTHRESH (sets the number of deblending levels) and DEBLEND_MINCONT (minimum fraction of pixels a branch must have to be considered a separate object), which would correctly split and detect objects in our fields. Aperture check-images were used to determine whether objects had been detected correctly. For our spectroscopic sample galaxies, the best set was found to be DEBLEND_NTHRESH = 32 and DEBLEND_MINCONT = 0.01 as these parameters best recovered galaxies in their entirety without excess splitting while still correctly separating neighboring objects. While this worked for most program galaxies in all clusters, there were cases of galaxies with a lot of structure that were split too much, or galaxies with foreground stars which required greater deblending. For these galaxies we adjusted the DEBLEND_MINCONT slightly lower or higher as necessary until that individual galaxy was verified by eye to have been detected correctly. For the non-sample galaxies in the images, many consisting of late type, irregular galaxies, we used a compromise set of parameters of DEBLEND_NTHRESH = 16 and DEBLEND_MINCONT = 0.01. This minimized oversplitting while still separating most neighboring objects.
The SExtractor output, which we use primarily as input for more rigorous galaxy profile fitting, included various magnitude (and flux) determinations, fractional pixel centroids, object class, ellipticity, position angle, and various moment and size measurements. We take the parameter , a combination of adapted aperture and corrected isophotal magnitudes, as the estimate for total magnitude. Measured parameters for objects detected multiple times in overlapping image frames were averaged together.
3.3 GALFIT Surface Photometry
To perform surface brightness profile fitting, we used GALFIT, a two-dimensional profile fitting program written by Peng et al. (2002). GALFIT has the advantage over other similar profile fitting codes because it simultaneously fits neighboring galaxies. This improves the fit for r1/4 law galaxies which contain a significant amount of light in the outer wings of the profile (Häussler et al., 2007). GALFIT provides the user with a choice of analytic surface brightness profile functions with which to fit the galaxies including Sersic (Sersic, 1968), de Vaucouleurs (r1/4 law), exponential disk, bulge/disk deconvolution, and psf.
The user must provide initial guesses for the profile parameters and a PSF template used to deconvolve the image PSF during fitting. We use the SExtractor output mbest for total magnitude, x, y, ellipticity, theta (corrected to GALFIT orientation), and flux radius (set within SExtractor to be an estimate of the half-light radius and converted to aeff for GALFIT) as input for GALFIT. Tests were made using simulated galaxies to determine the most appropriate PSF model and size. See Section 5.1 for more details of this testing process. The chosen PSFs were created by first running Tiny Tim (Krist, 1995) to generate raw distorted ACS model PSFs for a grid of locations spread uniformly over the two ACS chips. These were then added to a set of blank ACS images with the appropriate shifts and multidrizzled to produce PSFs combined in the same manner as the real data. These PSFs were re-extracted from the rectified frame as individual PSF templates for use with GALFIT. We use a 1-time sampled PSF for the GALFIT fitting procedure.
We fit all galaxies with both r1/4 law and Sersic (Sersic, 1968) profiles. The Sersic profile has the form
| (3) |
where re is the half-light radius, is the surface brightness, and n is the Sersic index. is coupled to n to ensure that half of the total flux lies within re. The total flux can be calculated by integrating out to r :
| (4) |
| (5) |
(Peng, 2001) where q is the axial ratio, b/a, c is the diskiness-boxiness parameter, and is the Beta function. The advantage of fitting with a Sersic profile is that the exact form of the profile need not be known a priori since the index, n, can vary to fit the full range of possible galaxy profiles from n exponential disks to n ellipticals/spheroidal components.
Since ACS images are large, we used a wrapper script which first extracted a smaller panel for each galaxy from the image, with a panel size determined to be re of the galaxy to be fitted, having a minimum size of 250 pixels and maximum of 1000 pixels on a side. Because light from the extended profiles of neighboring objects will influence the profile fitting of the primary galaxy, all galaxies within the panel were either fitted or masked. Masking was necessary to limit the number of galaxies fit and speed up the execution of the fitting. We therefore simply masked out all objects detected by SExtractor more than four magnitudes below the mean sample galaxy brightness. All other objects in the panel were fitted with Sersic profiles. These image sections were also checked by eye to ensure that no objects had been missed by SExtractor.
The wrapper script fit all cluster sample galaxies with both a Sersic and a de Vaucouleurs (r1/4 law) profile. For each profile we have a minimum of 6 free parameters, fitting for total magnitude, effective radius, ellipticity, position angle, and x,y position. In the case of the Sersic profile, the Sersic n was set initially at 1.5 and allowed to vary. After fits with both Sersic and r1/4 law profiles were performed, any object best fit with n , was refit with a Sersic profile using n=4.0 along with the output from the r1/4 fitting as initial guesses. All parameters were allowed to vary. We included this iteration because the initial guesses tended to influence the fit and SExtractor did not always produce the most accurate estimates for input. Neighbors were fit simultaneously with Sersic profiles while the sky value was held constant at the value provided by SExtractor. Best fits are determined by minimizing the residual, adjusting all free parameters simultaneously.
Final parameters produced by GALFIT include total magnitude, effective radius, axial ratio, position angle, x and y centroids, Sersic n, and a value of the fit, along with associated uncertainties for all the derived parameters. Output also consisted of a multiple extension image including the original panel, a model image, and the residuals from the fit. We display several examples of r1/4 law fits in Figures 1 - 3. Larger residuals are evident in galaxies with best fit Sersic index n closer to 1 and in those exhibiting features beyond a smooth profile. Final values typically indicated good fits. Median values of for fits with both profiles in all three clusters were with maximum values for a few galaxies between . These were cases of galaxies with structures that were not well modeled with single profiles or of galaxies with problematic neighbors.
GALFIT quoted uncertainties generally underestimate the true uncertainties of the parameter measurements since these assume the model is a perfect representation of the real galaxy. We list the GALFIT median measurement uncertainties in Table 2. Uncertainties for the low redshift cluster were slightly lower than for the two high redshift clusters. For all three clusters, uncertainties for r1/4 law parameters were slightly lower than for the Sersic fits. However, this does not imply that these fits were necessarily better and could indicate that these models were a poorer representation of the real data. In cases where a model is a poor match to the data, statistical uncertainties can be smaller because a small change in the parameters will produce a large change in (Peng, 2001). The Sersic function with its extra free parameter is better able to fit a galaxy profile that deviates slightly from the traditional r1/4 law. While the uncertainties determined from profile fitting may be statistically accurate, they do not provide realistic uncertainties for the various derived parameter values. We describe in the Section 5.1 our use of simulated galaxies to derive more realistic measurement uncertainties.
4 Results
Our high redshift cluster galaxies have half-light radii for our assumed cosmology ranging in size from to 35 kpc with magnitudes between . The full RX J0152.7-1357 spectroscopic sample includes 41 galaxies, 36 of which are contained within the ACS images. Structural parameters have been obtained for all 29 spectroscopically confirmed members. The RX J1226.9+3332 sample of 112 galaxies with measured parameters includes the original spectroscopic sample along with 63 galaxies having archival spectroscopy. 54 galaxies in this full sample are members. The 28 galaxies in the RX J0142.0+2131 sample have magnitudes ranging from and sizes kpc. In Tables 3 - 5, also available electronically, we provide the measured and derived photometric and structural parameters for these galaxies. Galaxies are sorted by RA and columns are as follows:
Column (1) Galaxy ID. This number comes from our original SExtractor detection in GMOS images. We use this number to identify the galaxies in all our publications.
Column (2) RA (J2000.0)
Column (3) DEC (J2000.0)
Column (4) Number of measurements made from different images for each galaxy. Table entries are average values from all measurements.
Column (5) Total apparent magnitude derived from r1/4 law profile fits. This is measured in the band for RX J0152.7-1357 and RX J0142.0+2131, and band for RX J1226.9+3332. Magnitudes are uncorrected for reddening.
Column (6) (re) from our r1/4 law fits, with re in arcsec. We take the radius as the geometric mean of the semi-major and minor axes, r .
Column (7) Mean surface brightness within the effective radius derived from total magnitude and re from our r1/4 law fits, in mag arcsec-2, using .
Column (8) Total magnitude from Sersic function fits, bands as in Column (5).
Column (9) (re) from Sersic function fits, with re in arcsec.
Column (10) derived from total magnitude and re from our Sersic function fits, in mag arcsec-2.
Column (11) Best fitting Sersic function parameter, n.
Column (12) Position angle, North through East.
Column (13) Ellipticity, derived from the fitted axial ratio.
Column (14) Cluster members are denoted by a ’1’, non-members by ’0’. Not every galaxy in our sample proved to be a cluster member, but all sample galaxies for which we were able to measure structural parameters are included in these tables. A blank entry indicates no redshift is available. These include galaxy ID 910, required fitting as a neighbor of galaxy ID 899, galaxy IDs 1009 and 1253 which had archive spectroscopy but with too low S/N to derive a redshift, and galaxy ID 1254 for which we were unable to extract a redshift due to confusion with a second object in the slit.
5 Discussion
5.1 Internal consistency
Simulated galaxies are used to investigate sources of error in our pipeline and test the accuracy of the software used. GALFIT, for example, produces uncertainties for the output parameters which tend to be too low since these are strictly random uncertainties and do not take into account the fact that the profile we fit each galaxy with may not be an exact match to the true galaxy profile (Peng, 2001). We therefore use the simulated galaxies to determine more realistic measurement uncertainties and to test how these uncertainties affect our FP measurements. The simulated galaxies are also used to test the effect of different PSF models and sizes for convolution in the galaxy profile fitting. In this section, we describe the methods used to simulate the galaxies, describe tests to determine the best PSF to use for the 2-D surface brightness profile fitting, and determine expected uncertainties in our galaxy parameter measurements.
5.1.1 Galaxy simulations
To generate realistic galaxies, we used the structural parameters of 148 galaxies in our low redshift Coma cluster comparison sample (Jørgensen & Franx, 1994). We transformed the values of MB to the filter and redshift of each cluster using stellar population models of Bruzual & Charlot (2003). For simulating galaxies at z , we transform the MB magnitudes of Coma cluster galaxies to the observed band using
| (6) |
| (7) |
(Jørgensen et al., 2005, 2007) and a mean empirical color, , for our early type galaxies at this redshift. For z , we use
| (8) |
(Barr et al., 2005) with a mean empirical color . We do not include a separate simulation for z as those made for z are considered representative. We scale reff to the appropriate redshift within our assumed cosmology. To create a large sample of simulated galaxies we added a small amount of random scatter to the magnitudes, reff, and Coma galaxy axial ratios while randomly generating positions and position angles. The Sersic parameter, n, was allowed to vary randomly between 0.5 - 5.5, except for a few sets of simulations where values ranged between 3.5 - 4.5 in order to increase the total number of early type galaxy simulations. The diskiness/boxiness of each galaxy was also allowed to vary randomly. Galaxies were added as perfect Sersic profiles, albeit with Poisson noise added to the galaxy images.
In order to simulate galaxies with multiple components, we also generated a set of bulge + disk galaxies. In these cases, bulges were created by modeling from the Coma galaxy structural properties. Disks were then added to the same position assuming disk-to-total light ratios ranging randomly from 0.25 - 0.65 with disk sizes ranging from (1 - 1.4) re(bulge). The inclination was varied from 0 to 90 degrees, uniformly in . As in Jørgensen & Franx (1994), we assign each component an intrinsic axial ratio: b/a(bulge) = 0.7 and b/a(disk) = 0.15. These values are chosen such that when transformed into observed values according to the inclination by
| (9) |
(Sandage et al., 1970), they will display the same range of axial ratios found in real galaxies.
Simulated galaxies were added to real images using two different means. Galaxies were generated with ARTDATA by defining a Sersic profile and using the Coma based parameters. They were also created using GALFIT itself by turning off the fitting for all parameters thereby forcing GALFIT to output models of the input parameters. No differences were observed in the galaxies generated or in the results obtained from the two methods, but both were used to ensure that no bias was produced from the simulation method.
Before being added to images, simulated galaxies were first convolved with a PSF and noise was added to the galaxies with the IRAF task MKNOISE. PSFs were created using 4-6 unsaturated real stars having high S/N using the routines in the IRAF package DAOPHOT. These were created for each ACS image that simulated galaxies were added to.
In order to measure realistic GALFIT parameter uncertainties we generated a total of over z and z simulated galaxies. So as to not increase the surface density of objects in the images and thereby affect recovery of the surface brightness profile parameters, no more than 50 were added at a time to the real cluster images. It is important to note that all galaxies are generated as perfect Sersic profiles and recovered as Sersic and r1/4 law profiles. We do not simulate structure, such as arms, bars, double nuclei, shells, or twisted isophotes, all of which would effect the fitting. For the measurement of the cluster FPs, we have included only non-emission line, non-star forming galaxies which we take to be the early types. However, at higher redshift, one might expect to find more late-type features in these non-star forming galaxies. As a simple test of how added structure will affect single profile model fits, we use the set of simulated galaxies having both bulge + disk components.
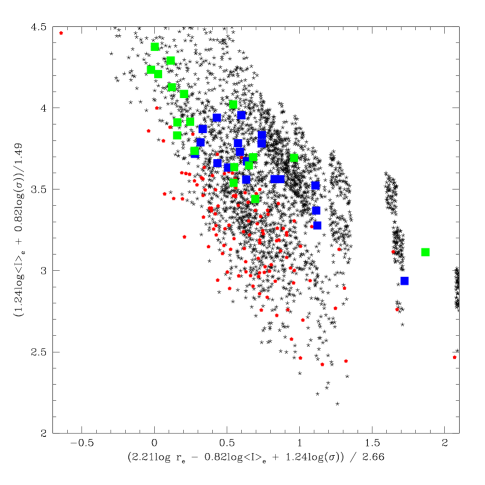
In Figure 4, we display a face-on view of the FP with our Coma cluster and high redshift galaxies plotted. We overlay our high redshift simulated galaxy sample. Expected velocity dispersions given the input re and for each simulated galaxy were calculated using the FP equation for Coma, (Jørgensen et al., 2006). It can be seen that our simulated galaxies span the same region of the FP as the real galaxies.
5.1.2 Choosing the best PSF for profile fitting
In order to determine the most appropriate PSF to use for deconvolution during the surface brightness profile fitting, we use a subset of 700 simulated galaxies to test the recovery of parameters with GALFIT using several different PSF models and sizes. Images were run through our reduction pipeline starting with SExtractor object detection in order to provide initial guesses for the GALFIT profile fitting. We tested the GALFIT recovery using four different PSFs: the PSF based on real stars, a raw Tiny Tim PSF generated for the appropriate location on the ACS chip, and and drizzled PSFs (see Section 3.3 for details). Galaxies were fitted with both Sersic and r1/4 law profiles. The r1/4 law fits show greater discrepancy from input values than Sersic function fits because galaxies were added with a Sersic parameter n which varied randomly between 1 and 4.5 for these tests.
In Table 6 we list the average differences and standard deviation between input and recovered magnitude, effective radius (in arcsec), and the combination of parameters that enter into the FP, , hereafter referred to as the Fundamental Plane parameter (FPP), where is the surface brightness within in units of pc-2 and (Jørgensen et al., 2006). The average difference between input and recovered values is nearly identical regardless of the PSF used. However, we do find that using the raw Tiny Tim PSF consistently provides the worst results. Using drizzled PSFs showed very slight improvement over drizzled PSFs and very similar results to the real PSFs. A test using a subsampled PSF showed no improvement in the output results. Due to the difficulties producing a real PSF from the few stars in our images, we therefore chose to use the model drizzled PSF. In the event that the Tiny Tim modeled drizzled PSF is not the best representation of the true PSF, we note that the differences in the FPP due to the PSF used are insignificantly small.
5.1.3 Structural parameter measurement uncertainties
The full set of simulated galaxies were used to investigate realistic uncertainties in structural parameter measurements. Average offsets (recovered - input values) and the associated rms scatter in these differences are provided in Tables 7 and 8. As with the PSF tests, simulated galaxies were recovered using the same methods as real galaxies. The drizzled PSF described in the previous section is used for the surface brightness profile fitting of both real and simulated galaxies.
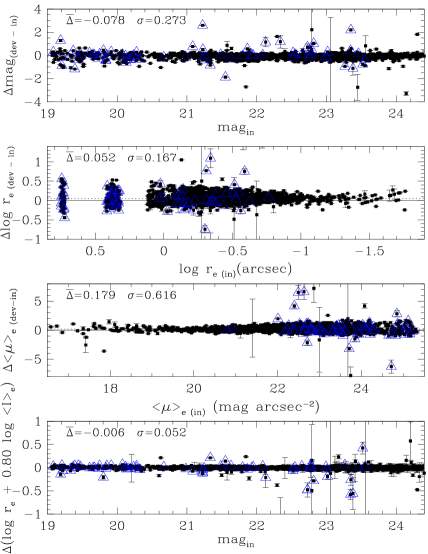
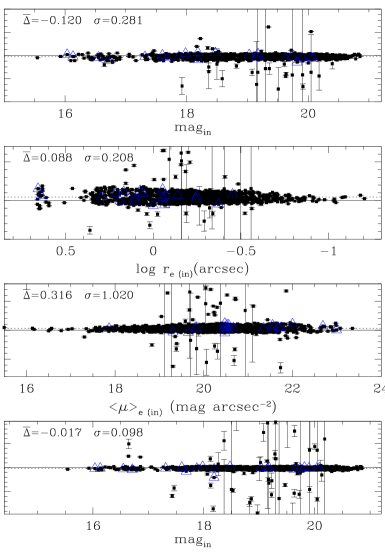
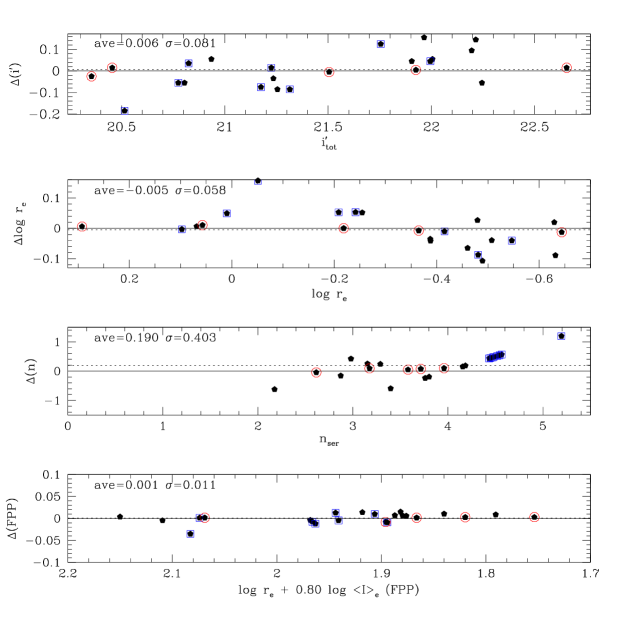
We compare the r1/4 law recovered parameters from GALFIT with the input values for all simulated galaxies in Figure 5. We find small average systematic offsets and associated rms scatter from the true magnitude and re (arcsec) of and for the high z sample. For the lower redshift set, we find offsets of and respectively. Average measurement offsets and rms scatter for the FPP are only and for the two samples.
This is for the full set of simulated galaxies including those that were created with exponential profiles (n ) but which were recovered with n = 4, r1/4 law profiles. To obtain realistic uncertainties in our FP parameters, we must compare only the range of parameters from galaxies that went into constructing our FPs. We plot a histogram of the Sersic n values measured by GALFIT for our real galaxy samples in Figure 6. The shaded histogram displays only those galaxies used in our FP. Galaxies which were not included in our FP either had emission line spectra, Mass , or n (Jørgensen et al., 2006). We therefore repeat the comparison between input and recovered parameters in Figure 7 for galaxies created with n profiles. It can be seen from Table 7 that while magnitude and size errors have decreased, the systematic error and random uncertainty in the FPP of and for the two samples exhibit little change. The larger rms scatter for the lower redshift sample is due primarily to a few outliers with failed fits. In our real galaxy sample all failed fits are flagged and refitted or left out of the FP measurement. We therefore consider this measurement uncertainty to be an upper limit.
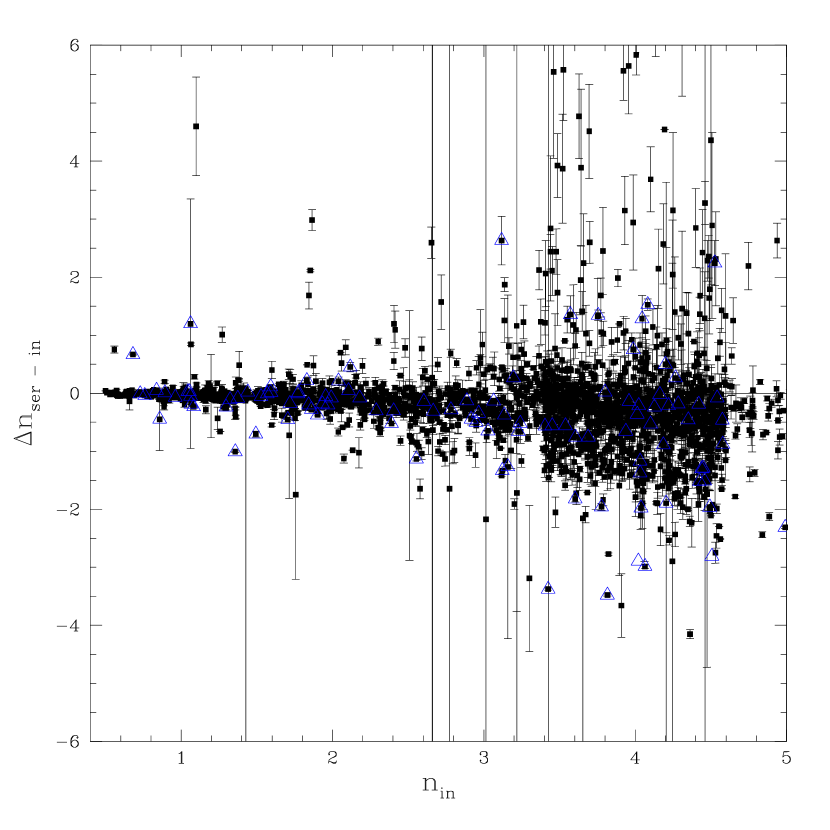
Measurement errors are similar when fitting with a Sersic function, allowing n to vary. Systematic offsets are slightly lower for the magnitude and re measurements, but there is no significant improvement in the FPP over fits made with r1/4 law profiles. In Figure 8, we display the error in recovered n as a function of input n. It is apparent that random error increases with increasing n. This is likely because fitting of n=1 type galaxies tends to be more robust than n=4 galaxies where there is greater weight in the wings of the galaxy and fits are more easily affected by the sky values and near neighbors.
Because we expect the intrinsic value of n to affect the results for r1/4 law fits, we plot the error in r1/4 law recovered parameters as a function of input Sersic n in Figure 9. Fluxes and sizes are overestimated for intrinsically low n galaxies because the r1/4 law profile imposes broader wings than the galaxy has. Magnitude and half-light radius are conversely underestimated at high n (). Because flux and size are highly correlated, the errors in the FPP are reduced, but can be as large as 0.05 for n = 1 exponential disk galaxies fitted incorrectly with a r1/4 law profile. A linear fit to the offset from the true input values finds FPP = 0.017 n - 0.067.
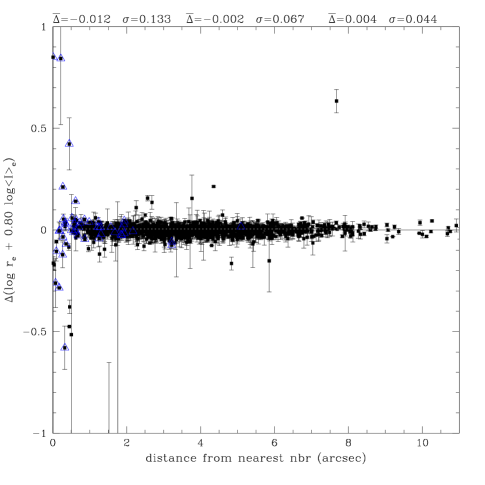
We investigate other factors such as near neighbors which might affect the fits. Simulated galaxies with close neighbors within 1 re or within 1 arcsec display a greater deviation in the recovered vs. input values for the FPP than those galaxies with a nearest neighbor at a distance greater than 2 arcsec. In Figure 10, we display the errors as a function of nearest neighbor distance. Points enclosed by triangles have neighbors within 1 re. From the plot it is apparent that these points have a larger dispersion than those with more distant neighbors. The dispersion is 3 times as large for objects having neighbors within 2 arcsec as compared to those with nearest neighbors arcsec. We also test whether errors change as a function of re, magnitude, or surface brightness (Table 8). We do find that random errors in the FPP may increase slightly at fainter magnitudes and smaller sizes. We find no trend as a function of the input c parameter, a measure of the galaxy core’s intrinsic diskiness/boxiness.
Finally, we investigate how single profile fits are affected by multiple component, bulge + disk, galaxies. Forcing a single r1/4 law fit to a bulge embedded in a disk recovers a magnitude comparable to the sum of the two components and a half-light radius that is larger than for the bulge alone. When combined to form the FPP parameter, the average systematic offset from the FPP for the bulge component alone is with (Table 7). This offset is larger than for the case of single profile galaxies although similar to the random error in single profile cases. Obviously the extended exponential disk will affect the fit, but the resultant FPP is similar to that of the bulge FPP alone within the expected uncertainties. Thus, we expect a r1/4 law fit to a distant galaxy with large bulge and low surface brightness disk will recover primarily the bulge component with only a slight offset in the FPP. Likewise, we would expect the spectroscopic measurement of the velocity dispersion to come largely from light within the bulge. For cases where faint disks are not obvious, we expect FP measurements to primarily represent the bulge components. We conclude from our simulated galaxy analysis that while r1/4 law fits may lead to systematic errors in individual parameters for real galaxies, we do not expect this to be a problem for our FP analysis. We explore this further in Section 5.2.
5.1.4 Comparing real galaxy measurements
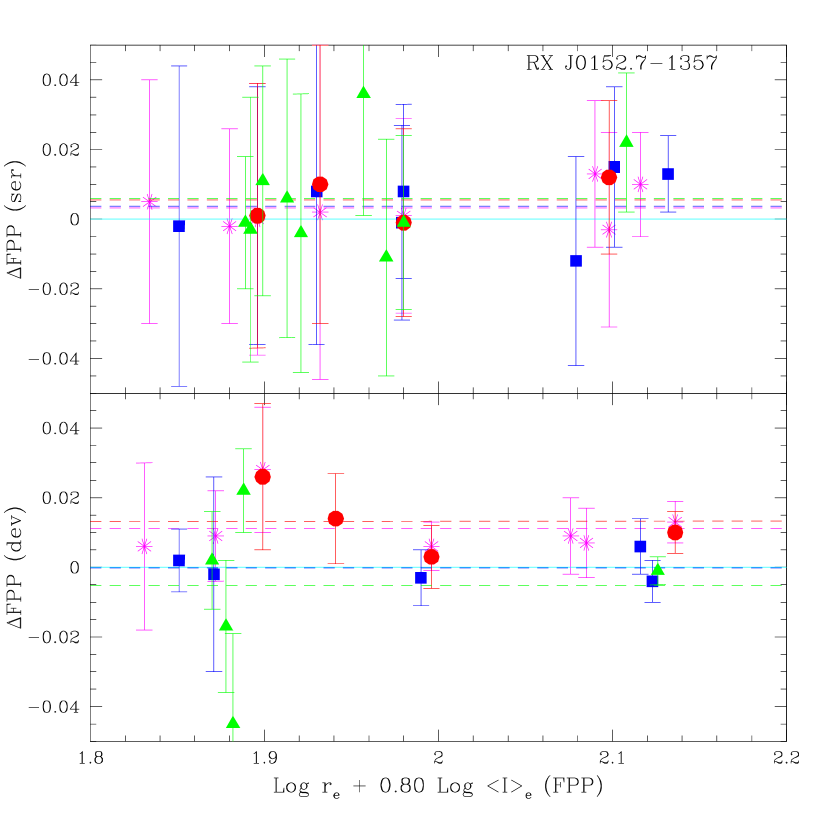
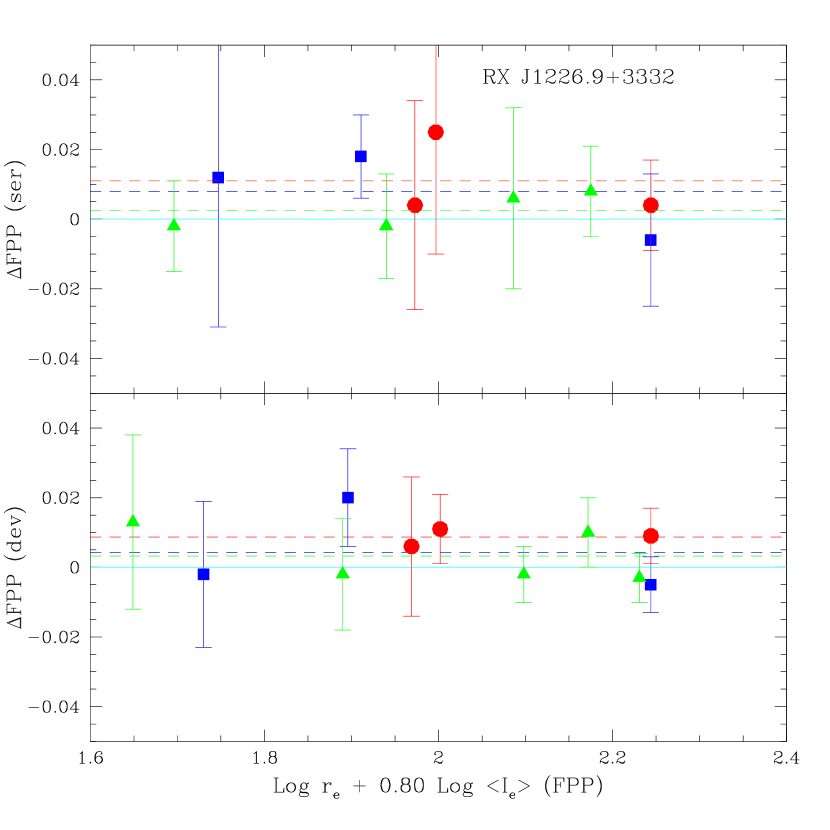
For both RX J0152.7-1367 and RX J1226.9+3332, a number of galaxies were observed multiple times in overlap regions from different telescope pointings. As one final test of our internal consistency we compare the derived structural and photometric properties from these multiple measurements. In Figure 11, we compare the difference in derived FPP for both Sersic and r1/4 law profile fits in pairs of images. Different symbols denote different image pairs and the corresponding dashed lines show the average difference for each pair. Average differences for pairs range from (absolute value) 0.0007 to 0.015 with standard deviations of 0.002 to 0.015. These differences are generally smaller than GALFIT measurement uncertainties, and the scatter in these real measurement differences is smaller than the random uncertainties determined from simulated galaxies. We do not find any worrisome systematic trends between images; all differences between images are within expected measurement uncertainties.
5.2 External consistency
Blakeslee et al. (2006) have used the same ACS dataset as used in this paper to study the structural parameters and colors of 149 galaxies in RX J0152.7-1357. They also perform surface brightness profile fitting using GALFIT with a procedure very similar to ours. Images are processed in a similar manner, and like us, they fit all neighbors with while masking objects fainter than this. Differences in methodology are few but three significant differences exist. While we use a Tiny Tim model PSF drizzled in the same manner as our data, they choose to use empirical PSFs from archival HST images. They also impose an upper limit for the fitted Sersic parameter, n, constraining the value to n , whereas we applied no constraints. Because of the strong coupling between Sersic function parameters, this will cause differences in the measured values of both re and total magnitude for galaxies we find with n . Finally, while we hold the sky value constant during the fitting at the SExtractor measured local value, they simultaneously fit for the sky value with GALFIT, except in cases where this led to poor fits.
We find a total of 26 objects in common, 3 of which have large discrepancies in magnitude. These were galaxies that were not well fit with single Sersic functions and which had late type features evident in the residual images. Excluding these, we compare the measured Sersic surface brightness profile parameters of the remaining 23 galaxies to the values listed in the Blakeslee et al. catalog. We plot the differences in our measurements in a vs. plane (Figure 12). From a linear fit to these data points we measure a magnitude zeropoint shift of between the two works from the offset in the intercept from zero. This is in the sense that we find objects to be on average 0.025 mag brighter. We find that large differences in measured surface brightness or size are correlated with large discrepancies in the recovered Sersic n parameter (see also Figure 9). Galaxies with measured n differing by less than 0.1 for the two groups are circled. Correcting for the zeropoint shift we compare the difference in magnitudes, re, n, and the FPP. Results are listed in Table 9 and displayed in Figure 13.
The increasing difference in measured n at n is easily explained by the constraints Blakeslee et al. impose on the Sersic n. Blakeslee et al. chose not to use Tiny Tim models finding that analytical representations for the PSF overestimated fitted re values. However, with our model PSF we find re values 2% smaller on average than their measurements. Average differences in total measured magnitude and effective radius are insignificantly small compared to the rms scatter. However, there appears to be a trend as a function of size and magnitude. We find brighter galaxies to be brighter than found by Blakeslee et al. and fainter galaxies to be fainter. Likewise, we measure larger sizes for larger galaxies and smaller sizes for smaller galaxies in comparison to Blakeslee et al. This can be attributed in part to different values recovered for the Sersic n parameter. In five cases where we find similar values within 0.1 for measured n, magnitude and size discrepancies are negligible regardless of size or magnitude. For 10 objects measured by Blakeslee et al. to have due to their constraint on the Sersic index, and for which we find best Sersic function fits with , we compare the Blakeslee et al. results to our r1/4 law () fits. We find the average offsets in magnitude and size are similar but the random scatter is nearly half that of the differences in Sersic measurements for these same galaxies. For large galaxies, in cases where we find , the covariance of Sersic function parameters generates fits with larger than found by Blakeslee et al. For small galaxies which are more strongly affected by the choice of PSF, we speculate that our broad PSF may be the cause of the smaller size measurements as compared to Blakeslee et al. Due to the coupling of Sersic function parameters, a smaller recovered size results in a fainter recovered magnitude. In Figure 12 we also show the parameter measurement errors in the plane for our z simulations fitted with an r1/4 law profile. We find the same coupling of errors and an offset in magnitude of 0.018, similar to that found for the Blakeslee et al. comparison. Since we used PSFs generated from real stars to create the simulated galaxies and the model PSF to fit the galaxies, this further suggests that the broad PSF may be cause of the slight magnitude differences.
Because of the correlation between Sersic profile parameters, the FPP is insensitive to these small variations in size measurement. When taking into account the small magnitude zero point differences, we find the differences between the Blakeslee et al. and our FPP measurement to be completely negligible and smaller than the systematic error of 0.006 determined from galaxy simulations. The rms scatter in the differences between our measurements is a factor of 5 smaller than the uncertainty expected from the simulations. The systematic difference in the FPP measurement of 0.009 is larger when not including the zero point shift, but is still much smaller than our expected random uncertainty of 0.05 determined from simulations.
5.3 Implications for FP measurements
Although we have fit each galaxy with both Sersic and r1/4 law functions, we use measurements of re and surface brightness from the r1/4 law fits to derive the FP since the galaxies in our low redshift comparison sample were originally fitted only with r1/4 law profiles. Not all of our sample consists of pure r1/4 law galaxies, and the Sersic function fits find a wide range of values for the Sersic parameter. However, only galaxies with n are used in our FP analysis (Jørgensen et al., 2006, 2007; Barr et al., 2006). In this section we explore how galaxy parameter measurement uncertainties translate to FP measurement uncertainties and whether any systematic biases exist in our methodology that would affect the derivation of the FP.
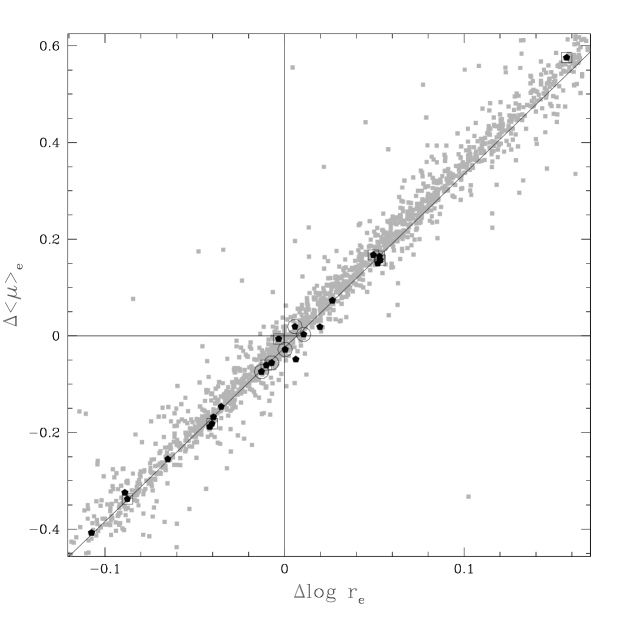
A plot of magnitude and FPP differences between GALFIT Sersic and r1/4 law fits of real galaxies vs Sersic index, n, shows very good agreement for n galaxies as expected (Figure 14). Many galaxies were best fit with n and, for these, the r1/4 law measured magnitude was as much as 1 mag brighter than that derived from the Sersic fits. Although output parameters from Sersic and r1/4 law fits often differed, a plot of the difference in magnitude and in surface brightness vs. difference in log re for the two fits shows the parameters to be strongly correlated and explains why differences in the FPP, although also correlated with Sersic n, are smaller. Galaxies with best Sersic fit are displayed as larger points, but note that even galaxies with low Sersic index follow the same linear relation. Indeed, the FPP is reasonably robust against the form of the profile used to fit the galaxies. This effect has been noted by Kelson et al. (2000), Trujillo et al. (2001), and Lucey (1997). While the uncertainties in measured structural and photometric parameters may seem large in cases where according to best Sersic function fits, the FPP has a much lower systematic error with random uncertainty. We find that even when we fit a pure exponential disk () with an r1/4 law profile, the errors in the magnitude and re are large but the average error in the FPP is only 0.05.
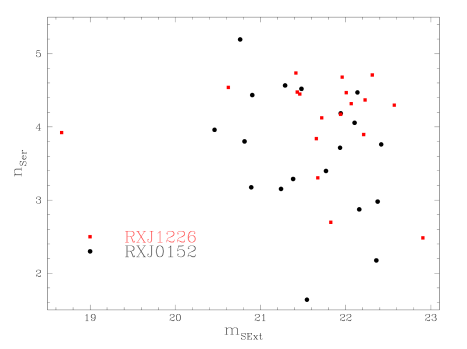
In our study of the FP we investigate whether the slope changes as a function of redshift. A change in slope would imply a change in M/L ratio as a function of galaxy mass. It is therefore critical to ensure our measurements are not biased as a function of magnitude or size. From our galaxy simulations we find some evidence for a slight increase of up to a factor of 3 in the scatter of the FPP at smaller sizes ( arcsec) and at fainter magnitudes (). However, this effect is small. More significantly, we find a strong correlation between the uncertainty in the FPP and the difference in measured vs. intrinsic Sersic index n. Exponential disk galaxies with fitted with r1/4 law profiles have systematic offsets as large as the random uncertainty. If there is a trend in real galaxy magnitudes with index n, this could affect the FP slope measurement. In Figure 15, we display the measured Sersic index n versus SExtractor total magnitude for the galaxies in our RX J0152.7-1367 and RX J1226.9+3332 FP samples. For the most part, the points exhibit random scatter. There is a hint of a trend in that the faintest galaxies have a slightly lower average Sersic index n. The correlation coefficients for these two samples are small, only -0.31 and -0.14 for RX J0152.7-1367 and RX J1226.9+3332 respectively. Although this slight correlation coupled with the trend of increasing FPP measurement offset with decreasing n may affect the FP slope, this effect is much smaller than the random uncertainties in the FPP.
It is also important to ensure our measurement uncertainties are insensitive to redshift. A redshift bias could be caused by, for example, GALFIT parameter measurement uncertainties being systematically different for objects with larger sizes or brighter magnitudes at low redshift as compared with smaller, fainter objects at high redshift. We do not find any evidence for this in our recovery of simulated galaxy parameters in simulations of the high (z = 0.83) and low (z = 0.28) redshift clusters. The average magnitude and effective radius measurement uncertainties are slightly larger for the low redshift sample but scatter in the recovered values is about the same for both clusters. The FPP has an average offset of recovered values from input which is insignificant for both populations, and a random uncertainty which is larger for the lower redshift cluster due to a small number of outliers with particularly poor fits. In our real galaxy sample all failed fits are flagged and refitted or left out of the FP measurement.
Through this simulated galaxy analysis we have found a number of other factors which affect the galaxy structural parameter measurements. Near neighbors affect profile fits and based on simulations, we find that the highest surface brightness, most compact galaxies are affected the least. However, the only effect this has on lower surface brightness galaxies is to increase the random uncertainty by up to factor of 4 for only those few galaxies which have a neighbor within 1 arcsec or 1 re. No systematic variation as a function of surface brightness is expected.
Although we cannot simulate galaxies with a full range of substructures, nor do we know the true distribution of such features in our real data, we estimate uncertainties for galaxies with more complex structures with bulge + disk simulations. We find a systematic offset of , much larger than the 0.01 for simulated galaxies generated with a single profile, with a slightly larger rms scatter of 0.10. With a large sample of galaxies exhibiting complex morphologies, we would expect measurements of the FP to be affected by the larger uncertainties. However, we check the goodness of all fits from residual images. Any features not modeled by the simple Sersic/r1/4 law profile fits will show up in these images as imperfect subtraction from the galaxy model. For most of our galaxies, subtraction is good without any obvious sign of extra arms, twisted isophotes, low surface brightness disks, or any other structures. Galaxies with such features tend to be best fit with Sersic , and these objects are not included in our FP measurements.
In conclusion, we take final uncertainties in the FPP to be based on our simulations, dominated by random uncertainties. We find no systematic offsets between recovered and input values for the FPP as a function of magnitude or half-light radius from our galaxy simulations. While we do find uncertainties are affected by near neighbors or Sersic index n, we do not expect the shape or tilt of the FP to be affected by these uncertainties, unless for example all lower mass galaxies have exponential profiles, which we see no evidence for. We find that our measurement uncertainties should not vary with redshift unless, for example, higher redshift galaxies contain more late-type morphological features. Although this is a possibility, we would expect to spot this in our residual fitting images. We therefore do not find any evidence for measurement uncertainties or systematic biases introduced by our data reduction methods to affect our derived FP as a function of redshift, galaxy size, or magnitude. We expect the measured tilts to be intrinsic values for each cluster.
6 Summary
Using new and archival HST/ACS high resolution images observed in the or bands, we have measured structural and photometric properties for galaxies in the clusters RX J0142.0+2131, RX J0152.7-1367, and RX J1226.9+3332. These data are being used to investigate the Fundamental Plane as a function of redshift, mass, and environment as part of our Gemini/HST Galaxy Cluster Project aimed at understanding cluster galaxy evolution. In this work we have described our data processing and analysis methods, presented catalogs of parameters measured from 2-D surface brightness profile fitting, and discussed expected uncertainties in our measurements and in the quantities which go into the measurement of the FP.
We determine average uncertainties in measured parameters for n galaxies from galaxy simulation tests. We define systematic errors and random uncertainties as the mean and rms scatter in the difference between recovered and input simulation values. For measured total magnitudes, these are for r1/4 law profiles. The average error in size, re, is . Random uncertainties are larger than any systematic offsets from intrinsic values. Sersic profile fits do slightly better than r1/4 law profiles in recovering the input values of the simulated galaxies with magnitude errors of and errors in re of . However, the rms scatter is similar for fits with either profile.
Due to the combination of parameters that enter the FP, re + , we find structural and photometric uncertainties to have little effect on the FP measurement. We take final uncertainties in this FP parameter to be , dominated by random error. We find no systematic offsets between recovered and input values for the FPP in our galaxy simulations as a function of magnitude or effective radius. While we do find uncertainties are affected by near neighbors or Sersic index n, we do not expect the shape or tilt of the FP to be affected by these uncertainties, unless for example all lower mass galaxies have exponential profiles, something not seen in our samples. We find that our measurement uncertainties should be invariant with redshift unless, for example, higher redshift galaxies contain more late-type morphological features. While this is a possibility, we would expect to spot this in our residual fitting images, so do not expect this to significantly affect our results. We conclude that the methods used to derive the effective parameters re and do not introduce any significant bias in our FP measurements, or in the results presented for these three clusters in Jørgensen et al. (2006, 2007); Barr et al. (2006).
References
- Barr et al. (2005) Barr, J., Davies, R., Jørgensen, I., Bergmann, M., & Crampton, D. 2005, AJ, 130, 445
- Barr et al. (2006) Barr, J., Jørgensen, I., Chiboucas, K., Davies, R., & Bergmann, M. 2006, ApJ, 649, L1
- Baugh et al. (1996) Baugh, C. M., Cole, S., & Frenk, C. S. 1996, MNRAS, 283, 1361
- Bertin & Arnouts (1996) Bertin, E. & Arnouts, S. 1996, A&AS, 117, 393
- Blakeslee et al. (2003) Blakeslee, J. P., Franx, M., Postman, M., Rosati, P., Holden, B. P., Illingworth, G. D., Ford, H. C., Cross, N. J. G., Gronwall, C., Benítez, N., Bouwens, R. J., Broadhurst, T. J., Clampin, M., Demarco, R., Golimowski, D. A., Hartig, G. F., Infante, L., Martel, A. R., Miley, G. K., Menanteau, F., Meurer, G. R., Sirianni, M., & White, R. L. 2003, ApJ, 596, L143
- Blakeslee et al. (2006) Blakeslee, J. P., Holden, B. P., Franx, M., Rosati, P., Bouwens, R. J., Demarco, R., Ford, H. C., Homeier, N. L., Illingworth, G. D., Jee, M. J., Mei, S., Menanteau, F., Meurer, G. R., Postman, M., & Tran, K.-V. H. 2006, ApJ, 644, 30
- Böhringer et al. (2000) Böhringer, H., Voges, W., Huchra, J. P., McLean, B., Giacconi, R., Rosati, P., Burg, R., Mader, J., Schuecker, P., Simiç, D., Komossa, S., Reiprich, T. H., Retzlaff, J., & Trümper, J. 2000, ApJS, 129, 435
- Bower et al. (1992) Bower, R. G., Lucey, J. R., & Ellis, R. S. 1992, MNRAS, 254, 601
- Bruzual & Charlot (2003) Bruzual, G. & Charlot, S. 2003, MNRAS, 344, 1000
- Butcher & Oemler (1984) Butcher, H. & Oemler, Jr., A. 1984, ApJ, 285, 426
- Casertano et al. (2000) Casertano, S., de Mello, D., Dickinson, M., Ferguson, H. C., Fruchter, A. S., Gonzalez-Lopezlira, R. A., Heyer, I., Hook, R. N., Levay, Z., Lucas, R. A., Mack, J., Makidon, R. B., Mutchler, M., Smith, T. E., Stiavelli, M., Wiggs, M. S., & Williams, R. E. 2000, AJ, 120, 2747
- Conselice et al. (2007) Conselice, C. J., Bundy, K., Trujillo, I., Coil, A., Eisenhardt, P., Ellis, R. S., Georgakakis, A., Huang, J., Lotz, J., Nandra, K., Newman, J., Papovich, C., Weiner, B., & Willmer, C. 2007, MNRAS, 381, 962
- de Zeeuw & Franx (1991) de Zeeuw, T. & Franx, M. 1991, ARA&A, 29, 239
- Djorgovski & Davis (1987) Djorgovski, S. & Davis, M. 1987, ApJ, 313, 59
- Dressler et al. (1987) Dressler, A., Lynden-Bell, D., Burstein, D., Davies, R. L., Faber, S. M., Terlevich, R., & Wegner, G. 1987, ApJ, 313, 42
- Dressler et al. (1997) Dressler, A., Oemler, A. J., Couch, W. J., Smail, I., Ellis, R. S., Barger, A., Butcher, H., Poggianti, B. M., & Sharples, R. M. 1997, ApJ, 490, 577
- Ebeling et al. (2000) Ebeling, H., Edge, A. C., Allen, S. W., Crawford, C. S., Fabian, A. C., & Huchra, J. P. 2000, MNRAS, 318, 333
- Ebeling et al. (2001) Ebeling, H., Jones, L. R., Fairley, B. W., Perlman, E., Scharf, C., & Horner, D. 2001, ApJ, 548, L23
- Ellingson et al. (2001) Ellingson, E., Lin, H., Yee, H. K. C., & Carlberg, R. G. 2001, ApJ, 547, 609
- Fritz et al. (2005) Fritz, A., Ziegler, B. L., Bower, R. G., Smail, I., & Davies, R. L. 2005, MNRAS, 358, 233
- Girardi et al. (2005) Girardi, M., Demarco, R., Rosati, P., & Borgani, S. 2005, A&A, 442, 29
- Häussler et al. (2007) Häussler, B., McIntosh, D. H., Barden, M., Bell, E. F., Rix, H.-W., Borch, A., Beckwith, S. V. W., Caldwell, J. A. R., Heymans, C., Jahnke, K., Jogee, S., Koposov, S. E., Meisenheimer, K., Sánchez, S. F., Somerville, R. S., Wisotzki, L., & Wolf, C. 2007, ApJS, 172, 615
- Homeier et al. (2005) Homeier, N. L., Demarco, R., Rosati, P., Postman, M., Blakeslee, J. P., Bouwens, R. J., Bradley, L. D., Ford, H. C., Goto, T., Gronwall, C., Holden, B., Jee, M. J., Martel, A. R., Mei, S., Menanteau, F., Zirm, A., Clampin, M., Hartig, G. F., Illingworth, G. D., Ardila, D. R., Bartko, F., Benítez, N., Broadhurst, T. J., Brown, R. A., Burrows, C. J., Cheng, E. S., Cross, N. J. G., Feldman, P. D., Franx, M., Golimowski, D. A., Infante, L., Kimble, R. A., Krist, J. E., Lesser, M. P., Meurer, G. R., Miley, G. K., Motta, V., Sirianni, M., Sparks, W. B., Tran, H. D., Tsvetanov, Z. I., White, R. L., & Zheng, W. 2005, ApJ, 621, 651
- Hook et al. (2004) Hook, I. M., Jørgensen, I., Allington-Smith, J. R., Davies, R. L., Metcalfe, N., Murowinski, R. G., & Crampton, D. 2004, PASP, 116, 425
- Jones et al. (2004) Jones, L. R., Maughan, B. J., Ebeling, H., Scharf, C., Perlman, E., Lumb, D., Gondoin, P., Mason, K. O., Cordova, F., & Priedhorsky, W. C. 2004, in Clusters of Galaxies: Probes of Cosmological Structure and Galaxy Evolution, ed. J. S. Mulchaey, A. Dressler, & A. Oemler
- Jørgensen et al. (2005) Jørgensen, I., Bergmann, M., Davies, R., Barr, J., Takamiya, M., & Crampton, D. 2005, AJ, 129, 1249
- Jørgensen et al. (2006) Jørgensen, I., Chiboucas, K., Flint, K., Bergmann, M., Barr, J., & Davies, R. 2006, ApJ, 639, L9
- Jørgensen et al. (2007) —. 2007, ApJ, 654, L179
- Jørgensen & Franx (1994) Jørgensen, I. & Franx, M. 1994, ApJ, 433, 553
- Jørgensen et al. (1999) Jørgensen, I., Franx, M., Hjorth, J., & van Dokkum, P. G. 1999, MNRAS, 308, 833
- Jørgensen et al. (1996) Jørgensen, I., Franx, M., & Kjaergaard, P. 1996, MNRAS, 280, 167
- Kelson et al. (2000) Kelson, D. D., Illingworth, G. D., van Dokkum, P. G., & Franx, M. 2000, ApJ, 531, 137
- Koekemoer et al. (2002) Koekemoer, A. M., Fruchter, A. S., Hook, R. N., & Hack, W. 2002, in The 2002 HST Calibration Workshop : Hubble after the Installation of the ACS and the NICMOS Cooling System, Proceedings of a Workshop held at the Space Telescope Science Institute, Baltimore, Maryland, October 17 and 18, 2002. Edited by Santiago Arribas, Anton Koekemoer, and Brad Whitmore. Baltimore, MD: Space Telescope Science Institute, 2002., p.339, 339–+
- Krist (1995) Krist, J. 1995, in ASP Conf. Ser. 77: Astronomical Data Analysis Software and Systems IV, ed. R. A. Shaw, H. E. Payne, & J. J. E. Hayes, 349–+
- Lucey (1997) Lucey, J. R. 1997, MNRAS, 289, 415
- Maughan et al. (2007) Maughan, B. J., Jones, C., Jones, L. R., & Van Speybroeck, L. 2007, ApJ, 659, 1125
- Maughan et al. (2003) Maughan, B. J., Jones, L. R., Ebeling, H., Perlman, E., Rosati, P., Frye, C., & Mullis, C. R. 2003, ApJ, 587, 589
- Mei et al. (2006) Mei, S., Holden, B. P., Blakeslee, J. P., Rosati, P., Postman, M., Jee, M. J., Rettura, A., Sirianni, M., Demarco, R., Ford, H. C., Franx, M., Homeier, N., & Illingworth, G. D. 2006, ApJ, 644, 759
- Monet et al. (1998) Monet, D. B. A., Canzian, B., Dahn, C., Guetter, H., Harris, H., Henden, A., Levine, S., Luginbuhl, C., Monet, A. K. B., Rhodes, A., Riepe, B., Sell, S., Stone, R., Vrba, F., & Walker, R. 1998, VizieR Online Data Catalog, 1252, 0+
- Peng (2001) Peng, C. Y. 2001, GALFIT Quick Start Guide
- Peng et al. (2002) Peng, C. Y., Ho, L. C., Impey, C. D., & Rix, H.-W. 2002, AJ, 124, 266
- Poggianti (2004) Poggianti, B. 2004, in Baryons in Dark Matter Halos, ed. R. Dettmar, U. Klein, & P. Salucci
- Sandage et al. (1970) Sandage, A., Freeman, K. C., & Stokes, N. R. 1970, ApJ, 160, 831
- Sandage & Visvanathan (1978) Sandage, A. & Visvanathan, N. 1978, ApJ, 225, 742
- Sersic (1968) Sersic, J. L. 1968, Atlas de galaxias australes (Cordoba, Argentina: Observatorio Astronomico, 1968)
- Sirianni et al. (2005) Sirianni, M., Jee, M. J., Benítez, N., Blakeslee, J. P., Martel, A. R., Meurer, G., Clampin, M., De Marchi, G., Ford, H. C., Gilliland, R., Hartig, G. F., Illingworth, G. D., Mack, J., & McCann, W. J. 2005, PASP, 117, 1049
- Smith et al. (2004) Smith, R. J., Hudson, M. J., Nelan, J. E., Moore, S. A. W., Quinney, S. J., Wegner, G. A., Lucey, J. R., Davies, R. L., Malecki, J. J., Schade, D., & Suntzeff, N. B. 2004, AJ, 128, 1558
- Trager et al. (2000) Trager, S. C., Faber, S. M., Worthey, G., & González, J. J. 2000, AJ, 120, 165
- Treu et al. (2002) Treu, T., Stiavelli, M., Casertano, S., Møller, P., & Bertin, G. 2002, ApJ, 564, L13
- Trujillo et al. (2001) Trujillo, I., Graham, A. W., & Caon, N. 2001, MNRAS, 326, 869
- Tully & Fisher (1977) Tully, R. B. & Fisher, J. R. 1977, A&A, 54, 661
- van Dokkum & Franx (2001) van Dokkum, P. G. & Franx, M. 2001, ApJ, 553, 90
| Cluster | # fields | filter | total texp(s) | Program ID |
|---|---|---|---|---|
| RXJ0142.0+2131 | 2 | F775W () | 4420 | 9770 |
| RXJ0152.7+1357 | 4 | F625W () | 4750 | 9290 |
| 4 | F775W () | 4800 | ||
| 4 | F850LP () | 4750 | ||
| RXJ1226.9+3332 | 4 | F606W () | 4000 | 9033 |
| 4 | F814W () | 4000 |
| z | z | |||
|---|---|---|---|---|
| Sersic fit | r1/4 | Sersic | r1/4 | |
| Magnitude | 0.010 | 0.006 | 0.003 | 0.001 |
| re | 0.009 | 0.009 | 0.009 | 0.008 |
| 0.040 | 0.025 | 0.013 | 0.008 |
Note. — Uncertainties are similar for the two high redshift clusters and are therefore combined in this table.
| ID | RA | Dec | Nmeas | mtot,dev | mtot,ser | nser | PAave | Memberaa1: galaxy is considered a member of RX J0152.7-1357; 0: galaxy is not a member | |||||
|---|---|---|---|---|---|---|---|---|---|---|---|---|---|
| (2000) | (F775W) | (arcsec) | mag arcsec-2 | (F775W) | (arcsec) | mag arcsec-2 | |||||||
| 193††Galaxy exhibits late-type structure and is not well fit with an r1/4 law profile. | 1:52:50.80 | -13:55:28.9 | 2 | 20.25 | 0.115 | 22.82 | 20.64 | -0.161 | 21.83 | 2.13 | 34.3 | 0.07 | 0 |
| 264 | 1:52:44.66 | -13:55:37.3 | 1 | 21.17 | -0.181 | 22.26 | 21.17 | -0.167 | 22.89 | 4.33 | -29.2 | 0.47 | 0 |
| 338 | 1:52:43.33 | -13:55:44.4 | 1 | 21.93 | -0.447 | 21.69 | 22.19 | -0.632 | 21.02 | 2.18 | -17.4 | 0.33 | 1 |
| 346 | 1:52:37.42 | -13:55:50.1 | 2 | 21.11 | -0.408 | 21.06 | 21.21 | -0.480 | 20.80 | 3.29 | 133.8 | 0.25 | 1 |
| 422 | 1:52:34.59 | -13:55:58.8 | 1 | 21.80 | -0.494 | 21.32 | 21.79 | -0.487 | 21.34 | 4.06 | 73.7 | 0.09 | 1 |
| 460 | 1:52:36.11 | -13:56:08.5 | 1 | 20.87 | -0.365 | 21.04 | 20.91 | -0.387 | 20.96 | 4.16 | 101.9 | 0.25 | 0 |
| 523 | 1:52:42.38 | -13:56:18.7 | 2 | 21.10 | -0.360 | 21.30 | 21.20 | -0.415 | 21.12 | 4.48 | -10.2 | 0.14 | 1 |
| 566 | 1:52:38.03 | -13:56:28.1 | 2 | 20.90 | -0.097 | 22.41 | 20.75 | 0.010 | 22.79 | 4.54 | 1.5 | 0.53 | 1 |
| 627 | 1:52:38.48 | -13:56:33.6 | 2 | 21.81 | -0.350 | 22.05 | 21.88 | -0.388 | 21.93 | 4.18 | -2.3 | 0.25 | 1 |
| 643 | 1:52:45.60 | -13:56:40.0 | 2 | 21.41 | -0.168 | 22.58 | 21.48 | -0.218 | 22.38 | 3.58 | 132.5 | 0.46 | 1 |
| 737 | 1:52:45.77 | -13:56:46.1 | 2 | 21.85 | -0.329 | 22.20 | 21.90 | -0.365 | 22.06 | 3.71 | 54.2 | 0.08 | 1 |
| 766 | 1:52:45.83 | -13:56:59.2 | 2 | 20.33 | 0.063 | 22.63 | 20.33 | 0.057 | 22.61 | 3.96 | 32.6 | 0.22 | 1 |
| 776 | 1:52:38.48 | -13:56:52.5 | 1 | 21.44 | -0.816 | 19.35 | 21.45 | -0.823 | 19.33 | 3.86 | 54.8 | 0.61 | 1 |
| 813 | 1:52:44.97 | -13:57:04.2 | 4 | 20.68 | -0.209 | 21.63 | 20.49 | -0.051 | 22.22 | 5.20 | 0.5 | 0.64 | 1 |
| 896††Galaxy exhibits late-type structure and is not well fit with an r1/4 law profile. | 1:52:36.99 | -13:57:10.1 | 1 | 22.29 | -0.179 | 23.39 | 21.87 | -0.234 | 22.68 | 0.31 | -13.3 | 0.32 | 1 |
| 908 | 1:52:43.74 | -13:57:19.4 | 4 | 20.80 | 0.074 | 23.16 | 20.78 | 0.067 | 23.11 | 3.80 | 50.9 | 0.21 | 1 |
| 1027 | 1:52:43.32 | -13:57:26.7 | 4 | 21.83 | -0.413 | 21.76 | 21.94 | -0.489 | 21.49 | 3.40 | 13.3 | 0.24 | 1 |
| 1085 | 1:52:42.94 | -13:57:35.0 | 4 | 21.23 | -0.273 | 21.86 | 21.15 | -0.208 | 22.10 | 4.52 | 72.2 | 0.27 | 1 |
| 1110 | 1:52:39.93 | -13:57:42.6 | 2 | 21.09 | -0.143 | 22.37 | 21.23 | -0.254 | 21.95 | 3.15 | -26.2 | 0.26 | 1 |
| 1159††Galaxy exhibits late-type structure and is not well fit with an r1/4 law profile. | 1:52:36.18 | -13:57:48.8 | 1 | 21.61 | -0.411 | 21.55 | 21.73 | -0.481 | 21.32 | 4.45 | -7.9 | 0.47 | 1 |
| 1210 | 1:52:42.83 | -13:57:55.3 | 2 | 21.81 | -0.390 | 21.86 | 21.98 | -0.508 | 21.43 | 2.87 | 122.5 | 0.29 | 1 |
| 1245 | 1:52:43.57 | -13:58:00.0 | 1 | 21.18 | 0.064 | 23.50 | 21.93 | -0.416 | 21.84 | 0.88 | 21.6 | 0.27 | 0 |
| 1299††Galaxy exhibits late-type structure and is not well fit with an r1/4 law profile. | 1:52:47.34 | -13:59:26.1 | 1 | 21.28 | -0.071 | 22.92 | 21.28 | -0.134 | 22.60 | 2.49 | -22.3 | 0.48 | 1 |
| 1385††Galaxy exhibits late-type structure and is not well fit with an r1/4 law profile. | 1:52:39.36 | -13:59:04.5 | 1 | 22.10 | 0.021 | 24.20 | 21.69 | -0.209 | 22.64 | 1.11 | 79.4 | 0.34 | 1 |
| 1458 | 1:52:39.64 | -13:58:56.6 | 2 | 21.94 | -0.541 | 21.22 | 21.97 | -0.547 | 21.23 | 4.47 | 21.2 | 0.29 | 1 |
| 1494 | 1:52:39.08 | -13:58:48.8 | 2 | 18.44 | -0.252 | 19.17 | 18.41 | -0.223 | 19.28 | 4.44 | 108.0 | 0.51 | 0 |
| 1507 | 1:52:34.48 | -13:58:42.2 | 1 | 22.14 | -0.436 | 21.94 | 22.17 | -0.460 | 21.85 | 3.76 | 61.6 | 0.56 | 1 |
| 1567 | 1:52:39.62 | -13:58:26.7 | 2 | 20.17 | 0.472 | 24.51 | 20.43 | 0.292 | 23.88 | 3.17 | 50.4 | 0.20 | 1 |
| 1590 | 1:52:38.87 | -13:58:32.0 | 2 | 22.09 | -0.531 | 21.42 | 22.22 | -0.629 | 21.06 | 2.98 | 85.7 | 0.34 | 1 |
| 1614 | 1:52:51.96 | -13:58:17.1 | 1 | 20.88 | 0.036 | 23.05 | 20.80 | 0.098 | 23.28 | 4.43 | 62.1 | 0.15 | 1 |
| 1682 | 1:52:51.96 | -13:58:15.6 | 1 | 21.16 | -0.163 | 22.34 | 21.54 | -0.446 | 21.30 | 1.64 | 127.7 | 0.49 | 1 |
| 1811 | 1:52:38.63 | -13:59:20.8 | 1 | 22.43 | -0.495 | 21.94 | 22.63 | -0.644 | 21.40 | 2.62 | 3.3 | 0.37 | 1 |
| 1920††Galaxy exhibits late-type structure and is not well fit with an r1/4 law profile. | 1:52:39.70 | -13:59:14.3 | 1 | 21.94 | -0.013 | 23.87 | 21.84 | -0.160 | 23.03 | 0.85 | -33.4 | 0.92 | 1 |
| 1935 | 1:52:41.88 | -13:59:53.6 | 1 | 21.36 | -0.295 | 21.87 | 21.29 | -0.242 | 22.07 | 4.57 | 10.4 | 0.18 | 1 |
| 1970††Galaxy exhibits late-type structure and is not well fit with an r1/4 law profile. | 1:52:48.03 | -13:59:58.6 | 1 | 19.78 | 0.389 | 23.72 | 20.58 | -0.166 | 21.74 | 0.62 | 57.4 | 0.78 | 0 |
| 2042††Galaxy exhibits late-type structure and is not well fit with an r1/4 law profile. | 1:52:42.38 | -13:59:46.6 | 1 | 18.12 | 0.958 | 24.90 | 19.43 | 0.212 | 22.48 | 0.75 | -40.3 | 0.17 | 0 |
| ID | RA | Dec | Nmeas | mtot,dev | mtot,ser | nser | PAave | Memberaa1: galaxy is considered a member of RX J1226.9+3332; 0: galaxy is not a member, left blank indicates redshift not available | |||||
|---|---|---|---|---|---|---|---|---|---|---|---|---|---|
| (2000) | (F814W) | (arcsec) | mag arcsec-2 | (F814W) | (arcsec) | mag arcsec-2 | |||||||
| 18 | 12:27:06.81 | 33:35:29.73 | 1 | 21.50 | -0.615 | 20.42 | 21.54 | -0.649 | 20.29 | 3.55 | -84.2 | 0.41 | 0 |
| 38 | 12:27:05.65 | 33:35:28.64 | 1 | 21.51 | -0.097 | 23.01 | 21.95 | -0.417 | 21.86 | 1.77 | 57.0 | 0.51 | 1 |
| 55 | 12:26:53.16 | 33:35:13.69 | 1 | 21.41 | -0.523 | 20.79 | 21.44 | -0.541 | 20.73 | 4.45 | 5.1 | 0.18 | 1 |
| 56††Galaxy exhibits late-type structure and is not well fit with an r1/4 law profile. | 12:27:08.86 | 33:35:19.88 | 1 | 21.37 | -0.222 | 22.25 | 21.59 | -0.384 | 21.66 | 2.70 | 8.8 | 0.35 | 1 |
| 91††Galaxy exhibits late-type structure and is not well fit with an r1/4 law profile. | 12:27:06.64 | 33:35:08.25 | 1 | 23.36 | -0.496 | 22.87 | 0.69 | -16.2 | 0.67 | 0 | |||
| 104 | 12:26:59.78 | 33:35:02.07 | 1 | 21.89 | -0.374 | 22.01 | 21.85 | -0.339 | 22.15 | 4.37 | 29.2 | 0.02 | 1 |
| 122††Galaxy exhibits late-type structure and is not well fit with an r1/4 law profile. | 12:27:01.32 | 33:34:56.27 | 1 | 22.01 | -0.442 | 21.79 | 22.09 | -0.503 | 21.56 | 3.36 | 31.4 | 0.64 | 1 |
| 132 | 12:26:47.77 | 33:34:48.31 | 1 | 21.24 | -0.518 | 20.64 | 21.17 | -0.461 | 20.85 | 4.66 | 42.0 | 0.64 | 0 |
| 138 | 12:27:00.63 | 33:34:46.95 | 1 | 20.93 | -0.789 | 18.98 | 20.82 | -0.707 | 19.28 | 5.50 | -81.4 | 0.32 | 0 |
| 154 | 12:26:47.80 | 33:34:44.64 | 1 | 22.51 | -1.014 | 19.42 | 22.38 | -0.952 | 19.61 | 8.06 | -19.0 | 0.24 | 0 |
| 178††Galaxy exhibits late-type structure and is not well fit with an r1/4 law profile. | 12:26:48.35 | 33:34:40.22 | 1 | 21.33 | -0.155 | 22.55 | 21.90 | -0.542 | 21.18 | 1.12 | -90.2 | 0.71 | 0 |
| 185 | 12:26:53.32 | 33:34:36.17 | 1 | 21.18 | -0.329 | 21.52 | 21.13 | -0.294 | 21.65 | 4.24 | 38.2 | 0.13 | 0 |
| 203††Galaxy exhibits late-type structure and is not well fit with an r1/4 law profile. | 12:26:59.35 | 33:34:19.92 | 1 | 20.17 | 0.499 | 24.66 | 20.97 | -0.005 | 22.93 | 0.63 | 6.5 | 0.03 | 0 |
| 220 | 12:26:55.16 | 33:34:25.53 | 2 | 21.58 | -0.466 | 21.24 | 21.51 | -0.410 | 21.45 | 4.52 | -28.1 | 0.21 | 0 |
| 229 | 12:27:07.35 | 33:34:24.34 | 1 | 21.89 | -0.353 | 22.11 | 21.74 | -0.232 | 22.57 | 5.07 | 51.6 | 0.11 | 1 |
| 245 | 12:27:07.42 | 33:34:19.73 | 1 | 22.00 | -0.609 | 20.94 | 21.95 | -0.575 | 21.07 | 4.43 | -27.3 | 0.32 | 0 |
| 247††Galaxy exhibits late-type structure and is not well fit with an r1/4 law profile. | 12:26:51.34 | 33:34:14.92 | 1 | 18.94 | 0.337 | 22.62 | 19.60 | -0.125 | 20.97 | 0.83 | -48.5 | 0.40 | 0 |
| 249††Galaxy exhibits late-type structure and is not well fit with an r1/4 law profile. | 12:26:52.08 | 33:34:12.47 | 1 | 19.81 | 0.202 | 22.81 | 20.44 | -0.194 | 21.46 | 0.56 | -4.6 | 0.67 | 0 |
| 293 | 12:27:05.85 | 33:34:05.23 | 1 | 21.35 | -0.301 | 21.84 | 21.34 | -0.278 | 21.94 | 4.48 | 23.4 | 0.29 | 1 |
| 295††Galaxy exhibits late-type structure and is not well fit with an r1/4 law profile. | 12:27:02.18 | 33:34:06.41 | 1 | 21.42 | -0.009 | 23.37 | 21.36 | -0.111 | 22.80 | 2.07 | -14.0 | 0.07 | 1 |
| 309 | 12:27:04.45 | 33:34:06.81 | 1 | 22.62 | -0.944 | 19.89 | 22.63 | -0.948 | 19.88 | 3.92 | -45.0 | 0.53 | 1 |
| 310 | 12:26:53.25 | 33:34:05.72 | 1 | 22.42 | -0.912 | 19.85 | 22.37 | -0.875 | 19.98 | 4.77 | 47.1 | 0.45 | 1 |
| 316††Galaxy exhibits late-type structure and is not well fit with an r1/4 law profile. | 12:26:59.58 | 33:34:04.32 | 1 | 21.56 | 0.620 | 26.65 | 22.93 | -0.206 | 23.89 | 0.48 | -77.7 | 0.47 | 0 |
| 329††Galaxy exhibits late-type structure and is not well fit with an r1/4 law profile. | 12:26:54.54 | 33:33:56.56 | 1 | 20.63 | 0.627 | 25.76 | 21.85 | -0.146 | 23.11 | 0.10 | -71.9 | 0.21 | 0 |
| 333††Galaxy exhibits late-type structure and is not well fit with an r1/4 law profile. | 12:27:00.44 | 33:33:59.17 | 1 | 22.14 | 0.239 | 25.32 | 23.09 | -0.362 | 23.27 | 0.98 | 20.8 | 0.44 | 0 |
| 347††Galaxy exhibits late-type structure and is not well fit with an r1/4 law profile. | 12:27:04.39 | 33:33:52.62 | 1 | 20.23 | -0.059 | 21.93 | 20.74 | -0.428 | 20.60 | 1.12 | -52.1 | 0.56 | 0 |
| 349 | 12:27:01.33 | 33:33:53.42 | 1 | 20.78 | -0.571 | 19.91 | 20.98 | -0.713 | 19.40 | 1.90 | -29.0 | 0.25 | 0 |
| 359††Galaxy exhibits late-type structure and is not well fit with an r1/4 law profile. | 12:26:54.38 | 33:33:51.04 | 1 | 20.82 | 0.187 | 23.74 | 21.53 | -0.300 | 22.02 | 0.69 | -77.0 | 0.67 | 0 |
| 374 | 12:27:02.07 | 33:33:43.63 | 1 | 20.94 | -0.032 | 22.77 | 21.50 | -0.428 | 21.35 | 1.30 | -47.9 | 0.49 | 0 |
| 386††Galaxy exhibits late-type structure and is not well fit with an r1/4 law profile. | 12:26:54.48 | 33:33:40.70 | 1 | 21.54 | -0.139 | 22.84 | 21.92 | -0.411 | 21.85 | 2.02 | 7.7 | 0.57 | 0 |
| 408 | 12:26:54.25 | 33:33:34.78 | 1 | 22.82 | -1.217 | 18.72 | 22.24 | -0.836 | 20.05 | 5.26 | 16.6 | 0.38 | 0 |
| 423 | 12:26:53.15 | 33:33:31.39 | 1 | 21.83 | -0.477 | 21.43 | 21.71 | -0.378 | 21.81 | 5.03 | -34.4 | 0.19 | 1 |
| 441 | 12:26:53.86 | 33:33:28.92 | 1 | 22.60 | -0.698 | 21.10 | 22.77 | -0.816 | 20.67 | 2.48 | -8.0 | 0.59 | 1 |
| 446 | 12:27:06.76 | 33:33:27.15 | 1 | 21.74 | -0.647 | 20.50 | 21.75 | -0.654 | 20.47 | 3.91 | -14.9 | 0.26 | 1 |
| 452††Galaxy exhibits late-type structure and is not well fit with an r1/4 law profile. | 12:26:53.99 | 33:33:23.08 | 1 | 22.01 | -0.203 | 22.99 | 21.90 | -0.232 | 22.73 | 1.85 | -33.1 | 0.54 | 1 |
| 462 | 12:26:52.47 | 33:33:24.18 | 1 | 22.45 | -0.565 | 21.62 | 22.35 | -0.475 | 21.96 | 5.01 | -60.4 | 0.06 | 1 |
| 470 | 12:26:54.90 | 33:33:24.48 | 1 | 22.95 | -0.764 | 21.12 | 22.96 | -0.774 | 21.08 | 3.84 | 54.1 | 0.28 | 1 |
| 491 | 12:26:57.55 | 33:33:14.05 | 2 | 21.36 | -0.300 | 21.85 | 21.38 | -0.319 | 21.78 | 3.84 | 24.4 | 0.21 | 1 |
| 499††Galaxy exhibits late-type structure and is not well fit with an r1/4 law profile. | 12:27:07.72 | 33:33:14.32 | 2 | 22.05 | -0.127 | 23.40 | 22.64 | -0.535 | 21.96 | 1.24 | 16.2 | 0.61 | 0 |
| 500††Galaxy exhibits late-type structure and is not well fit with an r1/4 law profile. | 12:26:53.55 | 33:33:10.10 | 1 | 20.71 | -0.065 | 22.37 | 21.24 | -0.443 | 21.01 | 1.12 | -38.4 | 0.68 | 0 |
| 512 | 12:26:55.67 | 33:33:13.13 | 1 | 22.77 | -0.820 | 20.66 | 22.86 | -0.880 | 20.45 | 2.97 | -32.0 | 0.53 | 1 |
| 523 | 12:26:57.18 | 33:33:05.06 | 1 | 21.56 | -0.182 | 22.64 | 21.50 | -0.145 | 22.77 | 3.91 | -5.9 | 0.26 | 0 |
| 528††Galaxy exhibits late-type structure and is not well fit with an r1/4 law profile. | 12:27:04.49 | 33:33:07.77 | 2 | 20.91 | 0.071 | 23.25 | 21.42 | -0.283 | 22.00 | 1.43 | -80.4 | 0.79 | 1 |
| 529 | 12:27:01.38 | 33:33:04.80 | 2 | 21.17 | -0.418 | 21.07 | 21.08 | -0.343 | 21.35 | 4.74 | -68.8 | 0.22 | 1 |
| 534 | 12:26:56.83 | 33:33:06.30 | 1 | 21.98 | -0.590 | 21.02 | 22.06 | -0.654 | 20.78 | 3.22 | -72.3 | 0.53 | 1 |
| 547††Galaxy exhibits late-type structure and is not well fit with an r1/4 law profile. | 12:26:54.23 | 33:32:53.61 | 1 | 21.12 | 0.395 | 25.09 | 22.01 | -0.165 | 23.17 | 1.16 | -23.8 | 0.42 | 1 |
| 557 | 12:27:07.73 | 33:32:55.59 | 1 | 22.10 | -0.689 | 20.64 | 22.08 | -0.678 | 20.68 | 4.17 | 73.8 | 0.24 | 1 |
| 563 | 12:26:58.29 | 33:32:49.00 | 3 | 18.70 | 0.662 | 24.00 | 18.71 | 0.653 | 23.96 | 3.92 | -84.6 | 0.38 | 1 |
| 572 | 12:27:02.65 | 33:32:57.47 | 2 | 21.92 | -0.944 | 19.19 | 21.88 | -0.914 | 19.30 | 4.79 | 60.1 | 0.51 | 0 |
| 593††Galaxy exhibits late-type structure and is not well fit with an r1/4 law profile. | 12:26:57.08 | 33:32:53.54 | 2 | 22.15 | -0.585 | 21.21 | 22.36 | -0.732 | 20.69 | 1.97 | 12.0 | 0.65 | 1 |
| 602 | 12:26:53.01 | 33:32:49.89 | 1 | 21.73 | -0.892 | 19.25 | 21.69 | -0.883 | 19.27 | 5.26 | -51.9 | 0.35 | 1 |
| 608 | 12:26:50.63 | 33:32:46.54 | 1 | 21.53 | -0.520 | 20.92 | 21.42 | -0.429 | 21.26 | 4.92 | -82.5 | 0.12 | 1 |
| 630 | 12:26:57.35 | 33:32:46.85 | 2 | 22.88 | -0.732 | 21.22 | 22.94 | -0.762 | 21.12 | 3.29 | -44.9 | 0.25 | 1 |
| 641 | 12:26:59.28 | 33:32:40.94 | 2 | 22.08 | -0.291 | 22.62 | 22.11 | -0.314 | 22.53 | 3.82 | 11.4 | 0.34 | 1 |
| 647 | 12:27:00.00 | 33:32:40.87 | 1 | 22.27 | -0.434 | 22.09 | 22.25 | -0.417 | 22.16 | 4.16 | 23.6 | 0.19 | 1 |
| 648 | 12:26:50.41 | 33:32:41.65 | 1 | 21.69 | -0.502 | 21.16 | 21.60 | -0.430 | 21.44 | 4.68 | -33.5 | 0.30 | 1 |
| 649 | 12:26:56.33 | 33:32:41.24 | 2 | 22.48 | -0.607 | 21.44 | 22.38 | -0.525 | 21.75 | 4.89 | 52.4 | 0.28 | 0 |
| 650 | 12:27:10.57 | 33:32:41.90 | 1 | 22.24 | -0.417 | 22.14 | 22.30 | -0.466 | 21.96 | 3.56 | -35.6 | 0.19 | 1 |
| 656 | 12:26:56.72 | 33:32:40.68 | 2 | 22.02 | -0.758 | 20.22 | 21.96 | -0.707 | 20.41 | 4.75 | -15.8 | 0.09 | 0 |
| 675 | 12:26:54.68 | 33:32:35.61 | 2 | 22.34 | -0.685 | 20.90 | 22.38 | -0.709 | 20.82 | 4.30 | 67.8 | 0.50 | 1 |
| 685 | 12:26:54.80 | 33:32:34.43 | 2 | 22.63 | -0.524 | 22.00 | 22.68 | -0.561 | 21.87 | 3.66 | -8.4 | 0.34 | 0 |
| 689 | 12:26:55.30 | 33:32:32.78 | 2 | 22.29 | -0.761 | 20.48 | 22.24 | -0.716 | 20.65 | 4.60 | 7.4 | 0.40 | 1 |
| 703 | 12:26:56.12 | 33:32:23.37 | 1 | 20.60 | -0.094 | 22.13 | 20.65 | -0.099 | 22.15 | 4.54 | -42.1 | 0.11 | 1 |
| 709 | 12:26:57.13 | 33:32:27.83 | 1 | 21.90 | -0.857 | 19.60 | 21.91 | -0.869 | 19.55 | 4.32 | -70.9 | 0.55 | 1 |
| 711 | 12:27:00.52 | 33:32:30.14 | 1 | 23.45 | -0.906 | 20.91 | 23.71 | -1.055 | 20.43 | 1.18 | 31.1 | 0.70 | 1 |
| 739 | 12:27:04.09 | 33:30:56.10 | 1 | 21.78 | -0.194 | 22.80 | 21.94 | -0.318 | 22.34 | 3.14 | 27.2 | 0.32 | 0 |
| 757††Galaxy exhibits late-type structure and is not well fit with an r1/4 law profile. | 12:27:04.65 | 33:31:01.17 | 1 | 22.49 | -0.529 | 21.83 | 22.87 | -0.785 | 21.02 | 1.65 | -80.4 | 0.67 | 1 |
| 760 | 12:27:03.83 | 33:31:01.45 | 1 | 21.78 | -0.738 | 20.08 | 21.74 | -0.708 | 20.19 | 4.47 | -49.8 | 0.47 | 1 |
| 781 | 12:26:46.73 | 33:31:03.83 | 1 | 22.07 | -0.888 | 19.61 | 22.05 | -0.886 | 19.61 | 4.85 | -37.0 | 0.33 | 0 |
| 798 | 12:26:56.10 | 33:31:09.63 | 1 | 24.37 | -1.142 | 20.65 | 24.71 | -1.240 | 20.50 | 0.26 | -31.8 | 0.56 | 0 |
| 801 | 12:27:07.23 | 33:31:15.87 | 1 | 21.54 | -0.242 | 22.32 | 21.53 | -0.235 | 22.35 | 4.07 | 87.2 | 0.35 | 1 |
| 805††Galaxy exhibits late-type structure and is not well fit with an r1/4 law profile. | 12:27:04.35 | 33:31:21.61 | 1 | 21.21 | -0.069 | 22.86 | 21.81 | -0.492 | 21.34 | 1.06 | 47.2 | 0.65 | 0 |
| 841††Galaxy exhibits late-type structure and is not well fit with an r1/4 law profile. | 12:27:04.49 | 33:31:32.86 | 1 | 20.78 | 0.025 | 22.90 | 21.30 | -0.365 | 21.47 | 0.85 | 30.9 | 0.73 | 0 |
| 861 | 12:27:04.90 | 33:31:32.46 | 1 | 20.93 | -0.392 | 20.96 | 21.20 | -0.575 | 20.31 | 1.89 | -49.7 | 0.62 | 0 |
| 863††Galaxy exhibits late-type structure and is not well fit with an r1/4 law profile. | 12:27:00.87 | 33:31:27.15 | 2 | 21.28 | -0.181 | 22.37 | 21.48 | -0.329 | 21.82 | 2.75 | 0.8 | 0.63 | 0 |
| 872††Galaxy exhibits late-type structure and is not well fit with an r1/4 law profile. | 12:26:58.08 | 33:31:34.58 | 1 | 22.38 | -0.128 | 23.73 | 1.46 | -0.8 | 0.87 | 0 | |||
| 883 | 12:26:56.32 | 33:31:37.20 | 1 | 22.76 | -0.669 | 21.41 | 22.91 | -0.777 | 21.02 | 2.70 | -48.4 | 0.58 | 1 |
| 899 | 12:26:45.63 | 33:31:40.66 | 1 | 22.05 | -0.780 | 20.14 | 22.06 | -0.785 | 20.12 | 3.90 | -25.9 | 0.47 | 1 |
| 907††Galaxy exhibits late-type structure and is not well fit with an r1/4 law profile. | 12:27:05.19 | 33:31:42.80 | 1 | 21.09 | 0.382 | 24.99 | 21.91 | -0.170 | 23.05 | 0.63 | -16.3 | 0.77 | 0 |
| 910 | 12:26:45.62 | 33:31:41.79 | 1 | 22.49 | -0.664 | 21.16 | 22.45 | -0.629 | 21.29 | 4.42 | 81.9 | 0.40 | |
| 928††Galaxy exhibits late-type structure and is not well fit with an r1/4 law profile. | 12:27:09.15 | 33:31:47.10 | 1 | 19.62 | -0.066 | 21.28 | 19.87 | -0.257 | 20.57 | 1.95 | -29.5 | 0.70 | 0 |
| 933 | 12:26:52.98 | 33:31:46.86 | 1 | 22.76 | -0.925 | 20.12 | 22.81 | -0.955 | 20.02 | 3.37 | 17.0 | 0.61 | 0 |
| 934††Galaxy exhibits late-type structure and is not well fit with an r1/4 law profile. | 12:26:53.53 | 33:31:50.23 | 1 | 19.83 | 0.500 | 24.32 | 20.78 | -0.069 | 22.43 | 1.02 | 43.8 | 0.24 | 0 |
| 960††Galaxy exhibits late-type structure and is not well fit with an r1/4 law profile. | 12:27:04.98 | 33:31:56.17 | 1 | 20.45 | 0.402 | 24.46 | 21.39 | -0.225 | 22.25 | 0.65 | 31.2 | 0.50 | 0 |
| 968 | 12:26:55.83 | 33:31:53.45 | 1 | 22.27 | -0.588 | 21.32 | 22.33 | -0.640 | 21.12 | 3.46 | -45.2 | 0.56 | 0 |
| 982††Galaxy exhibits late-type structure and is not well fit with an r1/4 law profile. | 12:27:03.02 | 33:31:57.27 | 1 | 18.92 | 0.160 | 21.71 | 19.30 | -0.119 | 20.69 | 2.17 | -60.2 | 0.35 | 0 |
| 995 | 12:26:46.13 | 33:32:01.54 | 2 | 21.45 | -0.406 | 21.41 | 21.44 | -0.397 | 21.44 | 4.09 | 28.0 | 0.24 | 0 |
| 996††Galaxy exhibits late-type structure and is not well fit with an r1/4 law profile. | 12:26:55.64 | 33:32:13.09 | 1 | 20.10 | -0.178 | 21.20 | 20.47 | -0.438 | 20.27 | 1.28 | -25.4 | 0.84 | 1 |
| 999 | 12:26:51.27 | 33:32:05.18 | 1 | 22.41 | -0.377 | 22.52 | 22.72 | -0.603 | 21.70 | 2.12 | 85.4 | 0.30 | 1 |
| 1001††Galaxy exhibits late-type structure and is not well fit with an r1/4 law profile. | 12:26:59.24 | 33:32:12.62 | 2 | 20.50 | 0.551 | 25.24 | 21.34 | 0.007 | 23.37 | 1.50 | 76.6 | 0.27 | 0 |
| 1005††Galaxy exhibits late-type structure and is not well fit with an r1/4 law profile. | 12:26:54.82 | 33:32:21.81 | 1 | 22.24 | -0.235 | 23.05 | 22.10 | -0.369 | 22.25 | 0.54 | -83.4 | 0.67 | 1 |
| 1009††Galaxy exhibits late-type structure and is not well fit with an r1/4 law profile. | 12:26:55.55 | 33:32:17.60 | 1 | 21.45 | 0.576 | 26.32 | 22.42 | -0.027 | 24.27 | 0.88 | -46.9 | 0.66 | |
| 1022††Galaxy exhibits late-type structure and is not well fit with an r1/4 law profile. | 12:27:08.20 | 33:32:07.47 | 1 | 24.89 | -0.040 | 26.68 | 23.65 | -0.347 | 23.91 | 0.44 | -5.2 | 0.22 | 1 |
| 1025 | 12:26:56.57 | 33:32:19.72 | 1 | 22.56 | -0.702 | 21.04 | 22.26 | -0.443 | 22.04 | 6.96 | -92.4 | 0.50 | 1 |
| 1027††Galaxy exhibits late-type structure and is not well fit with an r1/4 law profile. | 12:27:03.68 | 33:32:10.55 | 1 | 22.20 | -0.088 | 23.76 | 22.89 | -0.554 | 22.11 | 0.64 | 51.5 | 0.74 | 0 |
| 1042††Galaxy exhibits late-type structure and is not well fit with an r1/4 law profile. | 12:26:53.54 | 33:32:19.27 | 1 | 22.03 | 0.085 | 24.44 | 22.80 | -0.436 | 22.61 | 0.82 | 41.8 | 0.64 | 0 |
| 1047 | 12:26:56.08 | 33:32:15.75 | 1 | 21.76 | -0.764 | 19.92 | 21.81 | -0.802 | 19.79 | 3.30 | -4.8 | 0.60 | 1 |
| 1057††Galaxy exhibits late-type structure and is not well fit with an r1/4 law profile. | 12:27:05.52 | 33:30:43.90 | 1 | 22.41 | 0.022 | 24.52 | 23.13 | -0.457 | 22.83 | 1.02 | -31.5 | 0.16 | 0 |
| 1080††Galaxy exhibits late-type structure and is not well fit with an r1/4 law profile. | 12:27:01.74 | 33:30:25.27 | 2 | 21.90 | -0.214 | 22.82 | 22.38 | -0.549 | 21.62 | 1.30 | -26.6 | 0.72 | 0 |
| 1083††Galaxy exhibits late-type structure and is not well fit with an r1/4 law profile. | 12:26:49.64 | 33:30:19.40 | 1 | 21.84 | -0.159 | 23.04 | 21.62 | -0.089 | 23.17 | 3.26 | 87.3 | 0.41 | 0 |
| 1091††Galaxy exhibits late-type structure and is not well fit with an r1/4 law profile. | 12:27:08.23 | 33:32:13.13 | 1 | 21.50 | 0.148 | 24.23 | 22.05 | -0.235 | 22.87 | 1.67 | -86.9 | 0.40 | 1 |
| 1103††Galaxy exhibits late-type structure and is not well fit with an r1/4 law profile. | 12:27:02.61 | 33:30:13.75 | 2 | 22.15 | -0.022 | 24.03 | 22.84 | -0.496 | 22.36 | 0.72 | -0.6 | 0.73 | 0 |
| 1157††Galaxy exhibits late-type structure and is not well fit with an r1/4 law profile. | 12:27:03.56 | 33:30:14.19 | 1 | 22.13 | 0.105 | 24.65 | 22.93 | -0.434 | 22.75 | 0.69 | 40.5 | 0.65 | 0 |
| 1164 | 12:26:55.69 | 33:30:37.88 | 1 | 22.18 | -0.442 | 21.97 | 22.42 | -0.620 | 21.31 | 2.31 | 50.4 | 0.15 | 1 |
| 1170 | 12:26:49.39 | 33:30:31.35 | 1 | 21.36 | -0.328 | 21.71 | 21.34 | -0.313 | 21.76 | 4.12 | 24.7 | 0.25 | 1 |
| 1175 | 12:26:57.81 | 33:30:37.75 | 1 | 21.68 | -0.655 | 20.39 | 21.72 | -0.682 | 20.30 | 4.44 | 78.6 | 0.25 | 0 |
| 1196††Galaxy exhibits late-type structure and is not well fit with an r1/4 law profile. | 12:27:01.79 | 33:30:22.25 | 2 | 22.37 | 0.059 | 24.66 | 23.16 | -0.473 | 22.79 | 0.66 | 53.9 | 0.72 | 0 |
| 1199 | 12:27:08.57 | 33:30:48.16 | 1 | 22.13 | -0.748 | 20.38 | 22.07 | -0.699 | 20.57 | 4.71 | 79.8 | 0.22 | 1 |
| 1251 | 12:26:56.33 | 33:32:41.81 | 2 | 22.38 | -0.655 | 21.10 | 22.60 | -0.797 | 20.60 | 1.90 | 65.3 | 0.74 | 1 |
| 1252 | 12:27:03.15 | 33:31:55.36 | 1 | 21.89 | -0.218 | 22.79 | 22.16 | -0.407 | 22.11 | 2.74 | -2.9 | 0.34 | 1 |
| 1253††Galaxy exhibits late-type structure and is not well fit with an r1/4 law profile. | 12:27:07.70 | 33:32:54.26 | 1 | 21.77 | 0.234 | 24.93 | 22.80 | -0.389 | 22.85 | 0.46 | -3.8 | 0.72 | |
| 1254 | 12:26:56.12 | 33:31:09.35 | 1 | 21.97 | -0.065 | 23.64 | 21.90 | -0.014 | 23.82 | 4.31 | -53.9 | 0.30 |
| ID | RA | Dec | Nmeas | mtot,dev | mtot,ser | nser | PAave | Memberaa1: galaxy is considered a member of RX J0142.0+2131; 0: galaxy is not a member | |||||
|---|---|---|---|---|---|---|---|---|---|---|---|---|---|
| (2000) | (F775W) | (arcsec) | mag arcsec-2 | (F775W) | (arcsec) | mag arcsec-2 | |||||||
| 1 | 1:42:09.11 | 21:33:23.84 | 1 | 17.46 | 0.360 | 21.24 | 16.93 | 0.794 | 22.89 | 6.98 | -57.7 | 0.07 | 1 |
| 22 | 1:42:08.68 | 21:33:22.62 | 1 | 18.98 | -0.313 | 19.40 | 18.97 | -0.305 | 19.43 | 4.09 | -85.9 | 0.28 | 1 |
| 88 | 1:42:09.21 | 21:33:13.97 | 1 | 21.74 | -0.611 | 20.67 | 22.04 | -0.814 | 19.96 | 1.48 | 53.8 | 0.50 | 1 |
| 128 | 1:42:07.37 | 21:33:02.13 | 1 | 18.76 | 0.029 | 20.90 | 18.80 | 0.002 | 20.80 | 3.77 | -0.2 | 0.21 | 1 |
| 205 | 1:42:04.40 | 21:32:39.82 | 1 | 18.47 | 0.015 | 20.54 | 18.24 | 0.209 | 21.28 | 5.72 | 39.4 | 0.34 | 1 |
| 318 | 1:41:57.29 | 21:32:27.84 | 1 | 19.73 | -0.058 | 21.43 | 20.04 | -0.294 | 20.56 | 1.91 | -14.7 | 0.41 | 1 |
| 322 | 1:42:03.69 | 21:32:15.34 | 1 | 18.58 | 0.070 | 20.92 | 18.85 | -0.142 | 20.14 | 1.91 | -19.2 | 0.65 | 1 |
| 379 | 1:42:01.92 | 21:32:10.19 | 1 | 18.71 | -0.276 | 19.32 | 18.68 | -0.252 | 19.41 | 4.30 | -37.4 | 0.52 | 1 |
| 412 | 1:42:02.45 | 21:31:57.59 | 1 | 18.25 | -0.061 | 19.93 | 18.19 | -0.019 | 20.09 | 4.40 | -47.0 | 0.09 | 1 |
| 442 | 1:42:02.64 | 21:32:06.54 | 1 | 20.74 | -0.539 | 20.04 | 20.87 | -0.634 | 19.69 | 2.77 | -33.0 | 0.32 | 1 |
| 479 | 1:42:03.46 | 21:31:17.36 | 2 | 16.31 | 0.925 | 22.92 | 16.32 | 0.919 | 22.91 | 4.01 | -58.6 | 0.38 | 1 |
| 537 | 1:42:08.64 | 21:31:45.50 | 1 | 19.97 | -0.461 | 19.65 | 19.86 | -0.370 | 20.00 | 5.07 | 6.6 | 0.21 | 1 |
| 614 | 1:42:01.26 | 21:31:31.98 | 1 | 19.68 | -0.525 | 19.05 | 19.77 | -0.594 | 18.80 | 2.95 | 52.3 | 0.33 | 1 |
| 637 | 1:42:01.38 | 21:31:22.13 | 1 | 19.41 | -0.246 | 20.17 | 19.43 | -0.266 | 20.09 | 3.78 | 19.5 | 0.32 | 1 |
| 671 | 1:42:03.21 | 21:31:11.90 | 2 | 17.90 | -0.142 | 19.18 | 18.00 | -0.223 | 18.88 | 3.24 | 25.7 | 0.60 | 1 |
| 760 | 1:42:01.28 | 21:31:04.59 | 2 | 19.87 | -0.566 | 19.03 | 19.93 | -0.608 | 18.88 | 3.22 | 3.7 | 0.48 | 1 |
| 777 | 1:41:59.76 | 21:30:57.91 | 2 | 19.11 | -0.364 | 19.28 | 19.16 | -0.401 | 19.14 | 3.54 | -6.9 | 0.44 | 1 |
| 844 | 1:42:07.17 | 21:30:49.71 | 1 | 19.69 | -0.437 | 19.49 | 19.65 | -0.409 | 19.60 | 4.37 | -76.7 | 0.47 | 1 |
| 911 | 1:42:03.11 | 21:30:31.59 | 1 | 20.67 | -0.579 | 19.76 | 20.65 | -0.561 | 19.83 | 4.25 | 80.1 | 0.31 | 1 |
| 1012 | 1:42:01.75 | 21:30:17.39 | 1 | 20.23 | -0.500 | 19.72 | 20.19 | -0.473 | 19.82 | 4.35 | 73.9 | 0.13 | 1 |
| 1029 | 1:41:55.20 | 21:30:12.08 | 1 | 19.85 | -0.278 | 20.46 | 19.82 | -0.249 | 20.56 | 4.25 | 45.0 | 0.25 | 1 |
| 1043 | 1:41:58.57 | 21:30:01.91 | 1 | 18.69 | -0.153 | 19.91 | 18.70 | -0.163 | 19.87 | 3.89 | 5.7 | 0.50 | 1 |
| 1099 | 1:42:05.63 | 21:30:03.39 | 1 | 21.06 | -0.068 | 22.71 | 21.58 | -0.451 | 21.31 | 1.06 | 52.2 | 0.73 | 1 |
| 1179 | 1:42:00.91 | 21:29:41.60 | 1 | 18.93 | 0.352 | 22.68 | 19.43 | -0.014 | 21.35 | 1.37 | -26.2 | 0.29 | 1 |
| 1205 | 1:41:53.41 | 21:29:26.73 | 1 | 19.34 | -0.351 | 19.57 | 19.33 | -0.342 | 19.60 | 4.10 | -19.3 | 0.64 | 1 |
| 1207 | 1:42:04.04 | 21:29:35.51 | 1 | 19.81 | -0.403 | 19.78 | 19.77 | -0.373 | 19.90 | 4.33 | 60.2 | 0.46 | 1 |
| 1412 | 1:42:07.28 | 21:28:56.51 | 1 | 19.79 | -0.239 | 20.59 | 19.64 | -0.138 | 20.95 | 4.80 | 25.6 | 0.14 | 1 |
| 1416 | 1:42:06.40 | 21:28:38.73 | 1 | 19.99 | 0.155 | 22.76 | 20.43 | -0.194 | 21.45 | 1.61 | -26.8 | 0.70 | 1 |
| PSF | ||||
|---|---|---|---|---|
| Parameter | RealaaEmpirical PSFs generated from real stars | Raw TinyTim | drizzled 3′′ | drizzled 9′′ |
Note. — Values listed are the average offset and standard deviation of the measurements.
| Parameter | z=0.83 | z=0.28 | z=0.83 | z=0.28 |
|---|---|---|---|---|
| All sims | All sims | n | n | |
| FPPr1/4 | ||||
| FPPser | ||||
| nser | ||||
| FPPBDr1/4 |
Note. — r1/4 refers to profile fits with r1/4 law profiles, ser to Sersic profile fits, and BDr1/4 to objects generated with 2 components but fit with a single r1/4 law profile. Errors listed are the rms scatter in the differences.
| FPP | ||||
|---|---|---|---|---|
| range1 | range2 | range3 | ||
| Nearest neighbor | d | d | d | |
| Size | ||||
| Mag | ||||
| Parameter | (This work - Blakeslee et al.)aaComparison between 23 galaxies in common. | (subset Blakeslee et al. | )bbComparison between 10 galaxies for which we find best Sersic fits with n while Blakeslee et al. limit n . We show the comparison with both our Sersic and r1/4 law (n ) fits. | |
|---|---|---|---|---|
| zero point shift applied | no shift | This work: Sersic | r1/4 fits | |
| FPPser |