Orbital character variation of the Fermi surface and doping dependent changes of the dimensionality in BaFe2-xCoxAs2 from angle-resolved photoemission spectroscopy
Abstract
From a combination of high resolution angle-resolved photoemission spectroscopy and density functional calculations, we show that BaFe2As2 possesses essentially two-dimensional electronic states, with a strong change of orbital character of two of the -centered Fermi surfaces as a function of . Upon Co doping, the electronic states in the vicinity of the Fermi level take on increasingly three-dimensional character. Both the orbital variation with and the more three-dimensional nature of the doped compounds have important consequences for the nesting conditions and thus possibly also for the appearance of antiferromagnetic and superconducting phases.
pacs:
74.70.-b, 74.25.Jb, 79.60.-i, 71.20.-bSince the discovery of high superconductivity in Fe-pnictides Kamihara:2008 , many experiments have been carried out to reveal the physical and electronic properties of these materials Rotter:2008 ; Wang:2009 ; Yuan:2009 ; Tanatar:2009 . The parent compounds of Fe-pnictide superconductors are antiferromagnetic (AFM) metals. Both electron and hole doping suppresses the AFM order and leads to a superconducting phase. The AFM ordering is supposed to occur by nesting of hole pockets at the center of the Brillouin zone (BZ) and electron pockets at the zone corner. Nesting may be also important for the pairing mechanism in these compounds Mazin:2008 although there are alternative scenarios based on the high polarizability of the As ions Sawatzky:2009 . The nesting scenario could explain why in the SmFeAsO-based superconductors Liu:2008 , predicted to have an almost two-dimensional electronic structure Singh:2008 ; Ma:2008 , higher superconducting transition temperatures are observed than in BaFe2As2-based systems Rotter:2008 which are predicted to have a more three-dimensional electronic structure Singh:2008-1 . In general, reduction of the dimensionality increases the number of states that could be considered to be well nested. Furthermore, we point out that the orbital character of the states at the Fermi level is very important for the nesting conditions as the interband transitions which determine the electronic susceptibility, as calculated by the Lindhard function, are (in weak coupling scenarios) by far strongest when the two Fermi surfaces have the same orbital character Graser:2009 . The admixture of three-dimensionality, arising from interlayer coupling, makes the materials potentially more useful in devices and other applications. Thus the dimensionality of the electronic structure, i.e., the dispersion of the electronic states is of great importance for the understanding and application of these new superconductors.
Although angle-resolved photoemission spectroscopy (ARPES) is an ideal tool to study the dispersion of bands parallel and perpendicular to the FeAs layers there exist only a few experimental studies of these issuesCLiu:2009 ; Vilmercati:2009 ; Kondo:2009 . In this letter, we report a systematic study of the dimensionality of the electronic structure of BaFe2-xCoxAs2 (= 0 to 0.4) using polarization dependent ARPES, uncovering two new factors which are of great significance for the nesting of the Fermi surfaces of these systems. Firstly we show that the Co doping of BaFe2As2 strongly increases the three-dimensionality of the electronic structure. Secondly, we also detect an important change of the orbital character of the electronic states at the Fermi level when changing the wave vector perpendicular to the layers. Our results are in qualitative agreement with density functional theory (DFT) calculations.
Single crystals of BaFe2-xCoxAs2, were grown in Amsterdam using a self-flux method. Another set of single crystals of BaFe2As2 were grown in Garching using Sn-flux. Characterizing studies on Amsterdam samples have been reported elsewhere Massee . The ARPES measurements were carried out at the BESSY II synchrotron radiation facility using the UE112-PGM2a beam line, equipped with a SCIENTA SES 100 analyzer. The total energy resolution was 25 meV while the angular resolution was 0.2∘ along the slit of analyzer and 0.3∘ perpendicular to it. All the samples were cleaved in situ at a temperature of less than 50 K. Further experimental details have been published previously Fink . Due to matrix element effects, measurements performed with polarized photons can detect different Fe 3 states depending on the polarization and sample alignment (i.e, -X or -M) (see Table I). In the following we will not discuss the states as they are well below the Fermi energy .
| Alignment | Fe | Fe | Fe | Fe | Fe |
|---|---|---|---|---|---|
| -M (p-pol) | yes | yes | yes | no | no |
| -M (s-pol) | no | no | no | yes | yes |
| -X (p-pol) | no | yes | yes | yes | yes |
| -X (s-pol) | yes | no | yes | yes | no |
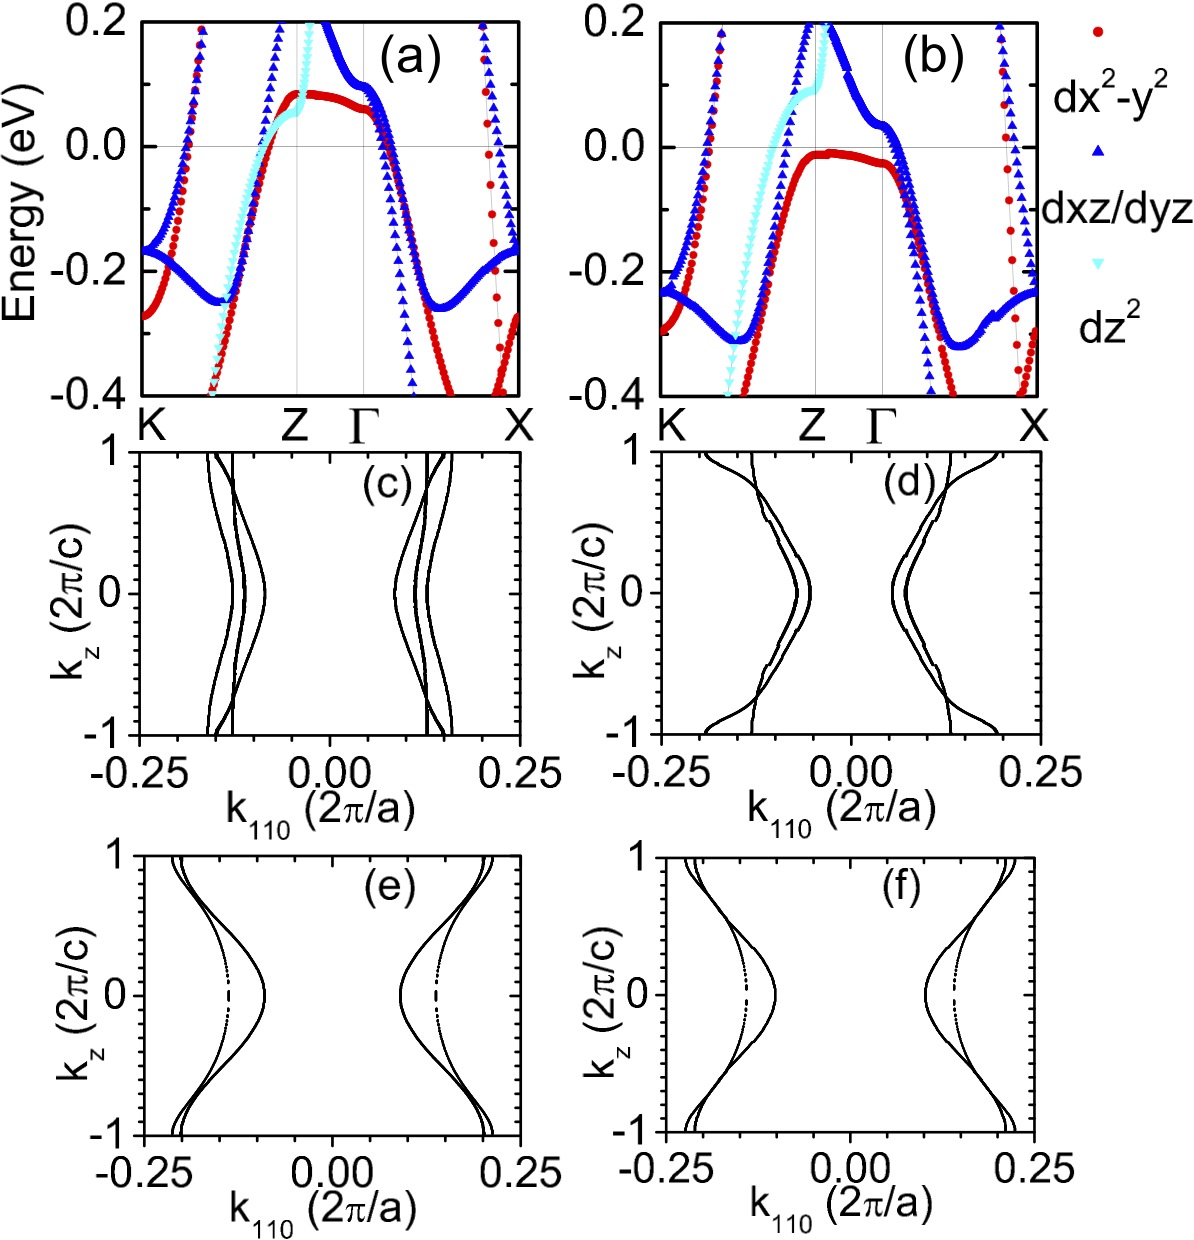
DFT calculations have been performed on BaFe2As2 and BaFe1.8Co0.2As2, using the Perdew-Burke-Ernzerhof generalized gradient approximation (see Fig. 1). For BaFe2As2 experimental structural data were taken from Huang . For BaFe2-xCoxAs2 we use Car-Parrinello molecular dynamics based on projector augmented wave basis to fully optimize the lattice structure within the virtual crystal approximation. High symmetry points of the BZ are denoted by = (0, 0, 0), Z = (0, 0, 1), X = (1/2, 1/2, 0), and K = (1/2, 1/2, 1) in the units (2, 2, 2), where and are the tetragonal lattice constants of BaFe2As2 along the and axis, respectively. In Fig. 1(a) and (b), the orbital character of the bands is shown in color.
ARPES measurements on undoped BaFe2As2 are displayed in Fig. 2. The measurements were performed using the photon energies, h=75 eV and h=57 eV, corresponding to 0 ( point) and 1 (Z point), respectively. The values are calculated using an inner potential of 15 eV Vilmercati:2009 . s-polarized photons were used for recording the data along the -X direction. Figure 2(b)-(e) depicts the h=75 eV data.
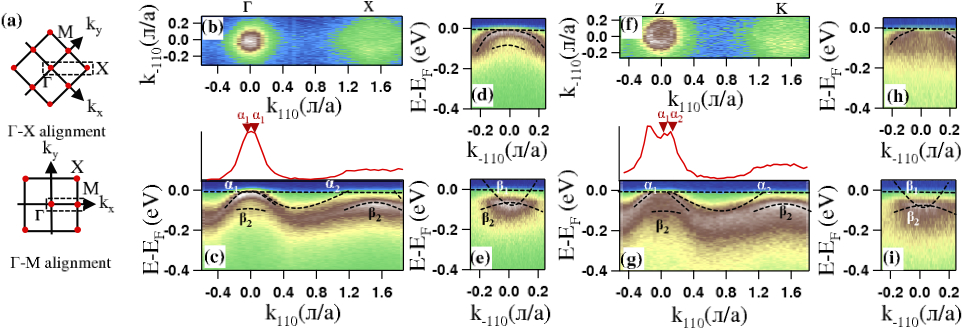
We observe a hole pocket at and an electron pocket at X in the Fermi surface map. Figure 2(c) shows the energy distribution map taken along the direction. We resolved two bands ( and ) at . Only crosses while is not visible for binding energies less than 20 meV. A Fermi vector Å-1 is calculated for by fitting the momentum distribution curve (MDC) taken over the integration range of a 20 meV window with respect to . Using the polarization dependent selection rules (see Table I), with s-polarized photons along the -X direction, the band can be attributed to and the band is related to and states. Around a weak spectral feature is observed near 100 meV below . This feature is related to a back folding and hybridisation of bands near and X, due to the AFM order in the As-Fe-As block. Around the zone corner X we observe two bands along ( and ) [Fig. 2(c)], and an additional hole pocket along () [Fig. 2(e)]. Maintaining the same geometry, but switching to h=57 eV (1) we can identify [Fig. 2(f)] two hole pockets around and one electron pocket around X. The energy distribution map [Fig. 2(g)] shows two bands crossing at the zone center ( and ). Since there is no clear separation between these bands we give the average Fermi vector Å-1. The small difference in Fermi vectors between and Z suggests a modest dispersion in undoped BaFe2As2 a point which we will return to later.
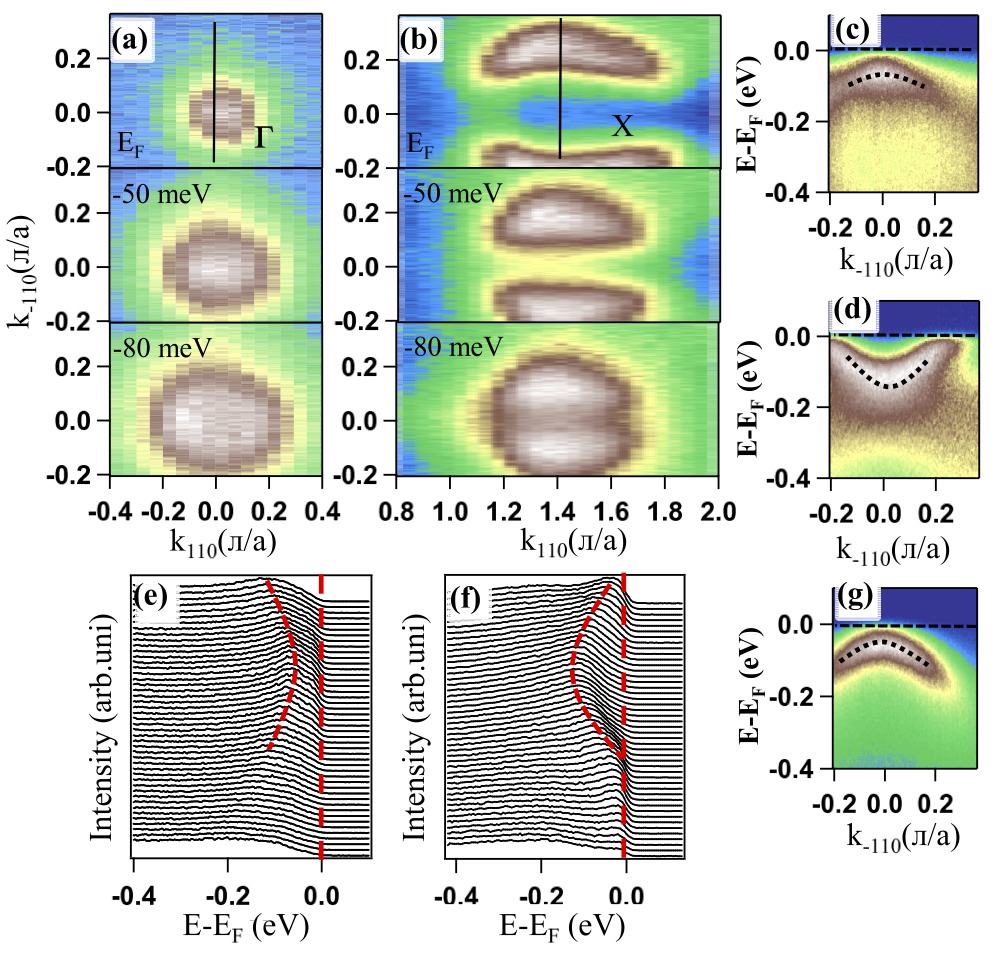
Next we discuss our ARPES measurements on BaFe1.6Co0.4As2. The data shown in Fig. 3 were recorded along -X with h=75 eV, corresponding to 0. Constant energy contours around were taken with p-polarized photons [see Fig. 3(a)] and analogous contours around X were taken with s-polarized photons [Fig. 3(b)] because no spectral weight was observed at X with p-polarized photons.
To resolve the band features we made different cuts along the direction at and X. In Fig. 3(c) and (e) we can see that no bands cross near in these measurements performed with p-polarized photons. The final spectral weight observed in Fig. 3(a) at is due to the tail of the top of the valence band. Using the polarization dependent selection rules of Table I, we can thus exclude hole pockets formed from states having , , or character. The existence of hole pockets with character, which according to the band structure calculations should be the first to sink below upon electron doping, is excluded from measurements using s-polarized photons [Fig. 3(g)]. Therefore for high Co doping of BaFe2As2, the hole pockets for 0 are completely filled, i.e., there are no states at near the point. Similar conclusions were derived in a previous report Sekiba but without polarization analysis, the absence of a hole pocket at cannot definitely be excluded. Furthermore, in BaFe1.6Co0.4As2 the size of the electron pocket at X (0) has become larger by a factor of two when compared to the undoped system. This indicates a shift of to higher energies upon substituting Fe by Co. On the other hand, we point out that we were not able to perform a full integration of the volume of the Fermi cylinders to judge whether a Co atom really adds one full electron to the Fe 3 dominated low-energy band structure.
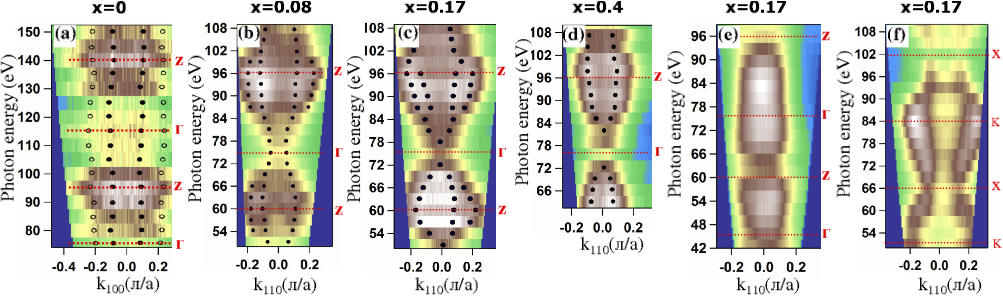
In order to reveal the dispersion of the bands in BaFe2As2, we have performed photon energy dependent scans with excitation energies ranging from 75 eV to 150 eV in steps of 5 eV. Figure 4(a) depicts the Fermi surface map in the vs. h plane. The data were recorded along the -M direction with p-polarized light. The strong and periodic intensity variation with would at first sight seem to indicate a strong dispersion along this direction. However, by fitting the MDCs we traced two bands across and Z which are showing almost no or only minor dispersion within our resolution limits. The clue to what is happening here comes from the DFT calculations. Inspection of Fig. 1(a) shows that near the Z point there is a related Fermi surface, while near , only and states cross . This radical dependent change of the orbital character of the Fermi surface – which is naturally periodic in the c-axis reciprocal lattice vector – combined with the strong photon energy dependence of the matrix elements for emission from states Fink gives rise to the strong intensity variations shown here and reported in CLiu:2009 ; Vilmercati:2009 ; Kondo:2009 . The true dispersion for undoped BaFe2As2 between and Z is small, as can also be seen from the DFT results of Fig. 1(c). Analogous ARPES data for SrFe2As2 and EuFe2As2 (not shown) confirm that the dispersion derived from a careful MDC fit analysis for the centered Fermi surfaces is small. Thus the picture for undoped BaFe2As2 is clear: there is little dispersion of the states around , but there is an important -dependent change in the orbital character of the /Z-centerd Fermi surfaces.
Having dealt with the important question of the dimensionality and the orbital character of the central Fermi surface cylinders of the undoped parent compound BaFe2As2, we now address the issue of the evolution of the dispersion in BaFe2-xCoxAs2 as a function of Co doping concentration. Figures 4(b)-(d) show the Fermi surface maps in the vs. h plane, measured along -X using p-polarized photons and photon energy steps of 3 eV. For lower Co concentrations, by fitting the MDCs, we could resolve two bands crossing around Z while at =0.4 only one band could be resolved. A remarkable observation is that with increasing Co concentration, the dispersion increases and the spectral weight at decreases. In the geometry used in Fig. 4(b)-(d), we probe , , and states. Thus we relate the outer bands to states while the inner ones to , states. In order to obtain more information on the orbital character of the bands, we contrast the =0.17 data of Fig. 4(c), measured with p-polarization, with analogous data measured with s-polarization which are presented in Fig. 4(e). In the latter the spread of the spectral weight along the direction is considerably reduced and the intensity is large at and small at Z. Since in -X (s-polarized) geometry, we do not detect states, and since at that doping level the band is already completely filled [see also Fig. 1(b)], we observe here only the degenerate , bands. These states give rise to spectral weight at but not at Z, as we have learned that these states transform at Z into states which cannot be detected in this geometry. Thus summarizing the situation for the states near the point: with increasing doping concentration, first the hole pocket will be filled at 0.1 and later on the , hole pocket moves below above 0.2. At Z, the pocket disappears near =0.2 but there remains a hole pocket which has predominantly character. This means that with increasing doping concentration the system transforms from a more two dimensional system with strong nesting conditions to a more three-dimensional metal where nesting is in principle possible in the 1 planes of the BZ, but there it is strongly reduced due to the different orbital character of the Fermi surfaces. In the =0 plane nesting is no longer possible since there is no hole pocket. The observed doping dependence of the electronic structure is in remarkable agreement with the band structure calculations [Fig. 1 (c) and (d)]. Finally, we report for =0.17 also a clear dispersion along the X-K direction, derived from fits of MDCs of data shown in Fig. 4(f) where, due to this specific geometry, we probe all states (, , and ) expected at . The strength of the dispersion and the small difference in the dispersion for the three bands is in good qualitative agreement with the calculations presented in Fig. 1(f).
In conclusion, we have performed a systematic photon energy dependent high resolution ARPES study to reveal the intrinsic dispersion in BaFe2-xCoxAs2 compounds. In the undoped system we see a modest dispersion near indicating a more two-dimensional system. At higher Co doping the dispersion increases and a gradual filling of all three hole pockets at is detected. Thus in the region of the BZ near =0 the nesting conditions are strongly reduced. In this context, our results on the orbital character indicate that nesting occurs predominantly in the =0 plane since at the top and at the bottom of the BZ the orbital character of the Fermi cylinders in the center and in the corner is different (/ at Z and / at K). Furthermore, the warped Fermi cylinders in optimally doped BaFe2-xCoxAs2 could lead to nesting vectors which are pointing out of the Fe layers possibly leading to a more three-dimensional superconducting state. The present results could possibly lead to a microscopic understanding of the disappearance of AFM order upon doping for =0.06 and the suppression of the superconducting phase in the overdoped phase near =0.18 Chu . The results on the dimensionality have also implication for the potential application of these materials.
References
- (1) Y. Kamihara et al., J. Am. Chem. Soc.130, 3296 (2008).
- (2) M. Rotter et al., Phys. Rev. Lett. 101, 107006 (2008).
- (3) X. F. Wang et al., Phys. Rev. Lett. 102, 117005 (2009).
- (4) H. Q. Yuan et al., Nature (London) 457,565 (2009).
- (5) M. A. Tanatar et al., Phys. Rev. B 79, 094507 (2009).
- (6) I. I. Mazin et al., Phys. Rev. Lett. 101, 057003 (2008).
- (7) G. A. Sawatzky et al., Europhys. Lett. 86, 17006 (2009).
- (8) R. H. Liu et al., Phys. Rev. Lett. 101, 087001 (2008).
- (9) D.J. Singh and M.-A. Du, Phys. Rev. Lett. 100, 23700 (2008).
- (10) F. Ma and Z.-Y. Lu, Phys. Rev. B 78, 033111 (2008).
- (11) D. J. Singh, Phys. Rev. B 78, 094511 (2008).
- (12) S. Graser et al., New J. Phys. 11, 025016 (2009).
- (13) C. Liu et al., Phys. Rev. Lett. 102, 167004 (2009).
- (14) P. Vilmercati et al., Phys. Rev. B 79, 220503 (R) (2009).
- (15) T. Kondo et al., arXiv:090502 (2009).
- (16) F. Massee et al., arXiv:0907.5544v1.
- (17) J. Fink et al., Phys. Rev. B 79, 155118 (2009).
- (18) Q. Huang et al., Phys. Rev. Lett. 101, 257003 (2008).
- (19) Y. Sekiba et al., New J. Phys. 11, 025020 (2009).
- (20) J.-H. Chu et al., Phys. Rev. B 79, 014506 (2009).