present affiliation:] GSI, Planckstr. 1, 64291 Darmstadt, Germany. present affiliation:] GSI, Planckstr. 1, 64291 Darmstadt, Germany. present affiliation:] Faculty of Science, Balqa Applied University, P.O.Box 7051, Salt 19117, Jordan. present affiliation:] Instituut voor Kern- en Stralingsfysica, K. U. Leuven, Celestijnenlaan 200D, B-3001 Leuven, Belgium. present affiliation:] GSI Darmstadt, Planckstr. 1, 64291 Darmstadt, Germany.
The 14C cross section between 10 keV and 1 MeV
Abstract
The neutron capture cross section of 14C is of relevance for several nucleosynthesis scenarios such as inhomogeneous Big Bang models, neutron induced CNO cycles, and neutrino driven wind models for the process. The 14C reaction is also important for the validation of the Coulomb dissociation method, where the cross section can be indirectly obtained via the time-reversed process. So far, the example of 14C is the only case with neutrons where both, direct measurement and indirect Coulomb dissociation, have been applied. Unfortunately, the interpretation is obscured by discrepancies between several experiments and theory. Therefore, we report on new direct measurements of the 14C reaction with neutron energies ranging from 20 to 800 keV.
pacs:
28.20.Fc, 24.50.+g, 26.35.+c, 97.10.Cv, 98.80.FtI Introduction
Inhomogeneous big bang models Applegate and Hogan (1985) offer the possibility to bridge the mass gaps at and 8 and to contribute substantially to the synthesis of heavier nuclei. The suggested reaction sequence Applegate et al. (1988); Malaney and Fowler (1988) for this outbreak is 7Li()8Li()11B()12B()12C. Subsequent neutron captures on 12C and 13C will then lead to the production of 14C, which has a half-life of 570030 yr Ajzenberg-Selove (1986). On the time scale of big bang nucleosynthesis 14C can be considered as stable and further proton, alpha, deuteron, and neutron capture reactions on 14C will result in the production of heavier nuclei with Applegate et al. (1988). Due to the high neutron abundance the 14C15C reaction is expected to compete strongly with other reaction channels.
The 14C()15C reaction plays an important role in the discussion of neutron induced CNO cycles Wiescher et al. (1999) during -process nucleosynthesis. Such -process scenarios are characterized by comparably low neutron densities, resulting in neutron capture times, which are slow compared to typical decay half lives and are associated with the He and C burning phases of stellar evolution where neutrons are produced by () reactions on 13C and 22Ne. While the process starts by neutron captures on iron seed nuclei, neutron captures on the light isotopes present in the burning zones can initiate a neutron induced CNO cycle. Starting from the abundant 12C, the cycle is represented by the neutron capture series on 12C, 13C, and 14C followed by the sequence 15C()15N()16N()16O()17O()14C or by producing 16N via 14N()14C()15C()15N(). The slowest reaction in this cycle is 14C()15C and, therefore, 14C can build up a correspondingly high abundance. Although the outbreak from the neutron induced CNO cycle via 17O()18O is strongly suppressed by the dominance of the () channel, there might be a non-negligible effect on the neutron balance of the process depending on the cross section for 14C(). To settle this issue, the cross section would be needed for thermal energies in the 10 to 100 keV region.
Neutron capture reactions on very light nuclei carry a substantial part of the reaction flow in neutrino driven wind scenarios for the process Terasawa et al. (2001). Among these reactions 14C()15C contributes mostly during the early phases, when 14C is formed via the sequences 9Be()12C()13C()14C and 9Be()10Be()14C. In these applications the () cross section is required up to MeV energies because of the high temperatures in excess of K, corresponding to thermal energies of about 300 keV.
The 14C() reaction is also important to validate the () cross sections obtained by theoretical calculations Wiescher et al. (1990); Timofeyuk et al. (2006) via the Coulomb dissociation method in the experiments reported in Refs. Horváth et al. (2002); Datta Pramanik et al. (2003); Nakamura et al. (2003). In this approach the time-reversed process is measured via breakup of 15C projectiles in the virtual photon field of a 208Pb target. The () cross section can then be inferred via detailed balance. The 14C()15C reaction is the only case with neutrons so far where both, direct and indirect, approaches were investigated experimentally. In fact, 14C belongs to the few cases where the Coulomb dissociation method can be validated in a convincingly clean way.
The first direct measurement Beer et al. (1992) was carried out at Forschungszentrum Karlsruhe using the same sample as in the present experiment. At that time, however, the measurement was severely hampered by the fact that the nickel container used for the 14C powder sample had been strongly activated by a previous irradiation with 800 MeV protons. The present study is a repetition of this first measurement after a 12-year cooling time of the nickel container, which led to a reduction of this disturbing activity to an acceptable level. Another reason for repeating the measurement was that meanwhile a more efficient detector system for the induced activity became available. Finally, the energy range was significantly extended compared to the previous experiment.
Preliminary results of this second experiment Reifarth et al. (2005) turned out to be subject to significant corrections resulting from the accidental activation of the HPGe detector used. In this article we present a detailed description of the measurement as well as a thorough re-analysis of the data and of the remaining uncertainties. The results are compared to model predictions and can be used to test the applicability of the Coulomb dissociation method.
II Experiment
II.1 -detection
The short half-life of 15C of only = s Alburger and Millener (1979); Audi et al. (1997) necessitates the use of the fast cyclic activation technique Beer (1991). The induced activity during each cycle was detected via the characteristic 5.2978 MeV -line (relative intensity ) in the 15C decay using a HPGe detector with a relative efficiency of 100%.
The detector efficiency was determined with a set of calibration sources and via the 27Al(p,)28Si reaction as described in Ref. Anttila et al. (1977). The distance between the 15C sample and the HPGe detector during the experiment was only 6 mm. The distance between the detector and the aluminum target during the 27Al(p,) calibration had to be significantly increased to 76 cm in order to keep the probability for summing of different -rays out of one cascade at a negligible level. A thin layer of 148 nm aluminum, which corresponds to 40 g/cm2 as used by Anttila Anttila et al. (1977), was evaporated on a copper backing. The thickness of the Al layer was determined with a quartz crystal. The energy loss for 1-MeV protons in this layer is less than 7 keV. The HPGe detector was placed at an angle of 55∘ as described in Ref. Anttila et al. (1977).
The calibration at 76 cm was completed with a set of calibrated sources, namely 22Na, 54Mn, 60Co, and 208Tl (which is part of the 232Th decay chain). A separate series of calibration measurements at a distance of 6 mm to the detector was performed to normalize the above determined efficiency curve to the geometry during the cyclic activation. Very weak calibrated samples of 54Mn, 65Zn, 88Y were used for that purpose. Simulations of the -ray efficiency using the detector simulation tool GEANT 3.21 Apostolakis (1993) showed that the energy dependence is slightly different for the setup during the activation (6 mm distance) and during the 27Al(p,)28Si experiment (50 cm), see Fig. 1. This effect was taken into account during the analysis.

The main difference to our preliminary analysis Reifarth et al. (2005) was the discovery of a huge dead time effect during the experiment. Even though the detector was shielded from the neutron production target to reduce radiation damage, enough neutrons reached the detector to produce significant intrinsic activity from () reactions on 74Ge and 76Ge. The previous activation of the Ni container led to the production of 44Ti in the container ( yr Görres et al. (1998)). The 1.16 MeV -ray activity from the decay of the daughter 44Sc was measured independently and could be used as an internal standard to determine the crucial dead time corrections of about a factor of 3.
The decay properties of the radio-nuclides used in the analysis of the efficiency calibrations are summarized in Table 1. The only important change compared to the previous experiment Beer et al. (1992) concerns the intensity of the 5297.8 MeV line in the decay of 15C. The new recommended value is (63.2 0.8)% Firestone (1996) instead of (68 2)% Browne and Firestone (1986).
| Isotope | Energy | Intensity |
|---|---|---|
| (keV) | (%) | |
| 15C | 5297.8 | 63.2 0.8 |
| 22Na | 511 | 181.1 |
| 1274.5 | 99.94 | |
| 44Sc | 1157.0 | 99.9 |
| 54Mn | 834.83 | 99.98 |
| 60Co | 1173.2 | 99.9 |
| 1332.5 | 99.98 | |
| 65Zn | 1115.5 | 50.6 |
| 88Y | 898.04 | 93.7 |
| 1836.0 | 99.2 | |
| 208Tl | 510.77 | 22.6 |
| 583.19 | 84.5 | |
| 860.56 | 12.4 | |
| 2614.5 | 99.16 |
aThe decay intensities of the calibration sources are known to better than 0.5% Firestone (1996).
A 1 mm thick lead sheet was placed in front of the HPGe detector during the experiment as well as during the different calibrations in order to reduce the strong low energy background caused by bremsstrahlung from the 14C decay electrons.
The results of the efficiency calibration are summarized in Table 2. The photo-peak efficiency for the 5.2978 MeV line following the decay of 15C was determined to (1.09 0.05)%.
| Process | E (keV) | Efficiency (%) |
|---|---|---|
| Double Escape (DE) | 4275.8 | 0.18 0.04 |
| Single Escape (SE) | 4786.8 | 0.58 0.06 |
| Full Energy (FE) | 5297.8 | 1.09 0.05 |
| Sum of all above | 1.86 0.09 |
II.2 Neutron spectra
Neutrons were produced via the 7Li()7Be reaction by bombarding metallic 7Li targets with proton beams provided by the Karlsruhe 3.7 MV Van de Graaff accelerator. Different neutron energy distributions were obtained by varying of the proton energy and the thickness of the Li targets.
The thickness of the 14C sample in the neutron beam direction was 5 mm . The neutron flux up- and downstream of the sample was monitored with two gold foils, allowing a measurement relative to the well known 197Au198Au cross section. At the end of each run the activity of the gold foils was determined via the 412 keV -ray from the 198Au decay ( = 2.7 d) using a well calibrated germanium detector. The shape of the gold foils was 21x12 mm2 according to the activity distribution of 14C in the sample, which was measured by detecting the emitted X-rays with a slit collimator.
The neutron fluxes obtained with the gold foils up- and downstream of the sample were significantly different due to the close geometry between the neutron source and the sample. This effect was evaluated by means of Monte-Carlo simulations of the neutron spectra, starting from the double-differential 7Li() cross section from Liskien and Paulsen Liskien and Paulsen (1975) and including the energy loss of the protons in the lithium layer. With this approach, the standard neutron spectrum used for activations Ratynski and Käppeler (1988) could be nicely reproduced as shown in Fig. 2.
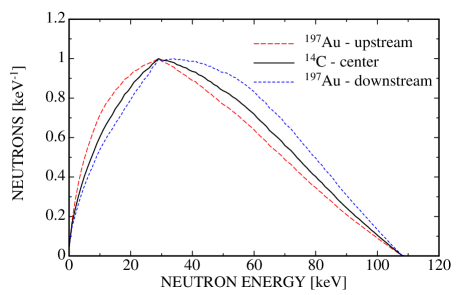
Based on the good agreement for this spectrum, which is rather sensitive to the proton energy distribution close to the neutron production threshold, the same method was also applied to the runs at higher energies. The resulting neutron energy distributions shown in Fig. 3 represent effective spectra, where the variation of the sample thickness as a function of neutron emission angle was properly considered. Correspondingly, the neutron spectra seen by the 14C sample and by the gold foils are exhibiting different widths. In addition, the spectra at 750 keV (bottom panel of Fig. 3) show a second neutron group around 200 keV, which results from the population of the first excited state in 7Be at 429 keV Liskien and Paulsen (1975). The parameters of the different runs are summarized in Table 3.
The corresponding integrated neutron fluxes are listed in Table 4. The values as derived from the gold foils were interpolated to the center plane of the sample in the following way. Since the neutron spectra for the up- and downstream gold samples differ significantly, an effective 197Au cross section had to be calculated in a first step. This was performed by folding the effective neutron spectra with the differential 197Au cross section by Macklin Macklin (1982), normalized to Ratynski and Käppeler Ratynski and Käppeler (1988), during the Monte-Carlo simulations of the neutron spectra. The neutron flux passing the up- and downstream gold samples were then determined based on the number of produced 198Au nuclei
where the correction accounts for the fraction of 198Au nuclei that decayed already during the irradiation Beer and Käppeler (1980). The flux at the sample position and the corresponding systematic uncertainties were then derived by normalizing the results from the Monte-Carlo simulations to the measured neutron fluxes at the position of the gold foils:

| Run | ||||
|---|---|---|---|---|
| (keV) | () | (keV) | (h) | |
| I | 1912 | 30 | 23.3 (MACS) | 22.0 |
| II | 2001 | 5 | 150 (average) | 24.0 |
| III | 2291 | 5 | 500 (average) | 20.0 |
| IV | 2530 | 5 | 750 (average) | 5.5 |
| Run | Upstream | Downstream | Sample | |||
| Uncert. | ||||||
| (mbarn) | (1013) | (mbarn) | (1013) | (1013) | (%) | |
| I | 604 | 1.82 | 546 | 1.26 | 1.56 | 3.0 |
| II | 284 | 2.08 | 270 | 0.62 | 0.84 | 9.4 |
| III | 155 | 2.42 | 133 | 1.09 | 1.64 | 6.8 |
| IV | 106 | 0.95 | 100 | 0.44 | 0.655 | 6.0 |


II.3 Sample mass
The independent determination of the sample mass by a calorimetric measurement of the decay heat turned out to be crucial for the analysis of this experiment. The use of this technique was favored by the comparably low end point energy of keV and by the fact that 14C decays without emission of -rays. The measurement was carried out at the Tritium Laboratory of Forschungszentrum Karlsruhe Dörr et al. (2005), yielding a heat production of W. Adopting an average energy keV NUD (2007) for the decay electrons and a half-life of yr Firestone (1996), the measured decay heat corresponds to an activity of Ci or a total mass of mg of 14C. This value is independent of the isotopic enrichment (which was quoted to be 89%) and more than a factor of two less than the specified value, which had been wrongly adopted in the previous activation Beer et al. (1992). This mismatch was presumably due to the undocumented removal of 14C powder from the original sample.
As mentioned before, the nickel container was still slightly active due to its previous exposure to proton beams up to 800 MeV in energy. In principle, the measured decay heat of the sample represents, therefore, only an upper limit of the sample mass, since other radio-isotopes can contribute as well. However, a careful analysis of all potential candidates confirms that this correction can be neglected. The two main constraints would be the half-life and the -activity of the contaminating isotope. Since the proton experiments were made 25 years ago, the half-life had to be in the range between 10 and 100 years, otherwise the isotope would have either already decayed or its specific activity would be too low to make any impact. The -activity was carefully measured by means of a HPGe detector with Be-window, and was shown not to exceed the completely negligible level of the weak 44Ti decay.
II.4 Cyclic activation
Each cycle consisted of an activation time of = 10 s, the -ray detection time = 10 s (during which the proton beam was switched off), and twice the time for moving the sample between detector and neutron production target = 0.8 s.
Figs. 4 and 5 show a typical -ray spectrum taken during the experiment. Full energy, single escape as well as double escape peaks of the 5.2978 MeV line from the decay of 15C are obtained with good signal/background ratios. In order to reduce systematic uncertainties, the time dependence of the 15C decay during the 10 s counting period, has been monitored. The decay curve is compared in Fig. 6 with a fit assuming a constant background and the exponential decay law with s half-life. Within the statistical uncertainties the measured activity follows the expected time dependence.


III Analysis and Results
III.1 Results from the activation measurement
The 14C cross section for the different neutron spectra were determined from the ratio of 15C to 14C atoms including corrections for 15C atoms decayed, while the sample was not in front of the HPGe detector. The details of this method are very well described in Beer et al. (1994, 1992). The results including uncertainties are presented in Table 5. The main contributions to the overall uncertainty come from counting statistics (2-8%), the -ray detection efficiency (5%), and the determination of the neutron flux (2-10%). All other uncertainties are smaller than 2%. With respect to the second neutron group during Run IV (750 keV), we performed the entire analysis three times. A first time without consideration of the second group, a second time with the cross section as suggested by Liskien and Paulsen (1975), and a last time adopting twice the cross section populating the excited state of 7Be. The value for the resulting 14C cross section increased by 5% in each step. Therefore we quadratically added an additional systematic uncertainty of 5% to the cross section at 750 keV.
| Run | Neutron energy | Cross section results (barn) | ||
|---|---|---|---|---|
| distribution (keV) | Measured valuesa | Theoryb | Theory/Experiment | |
| I | 23.3 (MACS) | 7.10.5 (6.7) | ||
| II | 150 (average) | 10.71.2 (11) | ||
| III | 500 (average) | 17.01.5 (8.8) | ||
| IV | 750 (average) | 15.81.6 (10) | ||
a Relative uncertainties ( in %) are indicated in brackets.
b Convoluted with the neutron spectra of Fig. 3.
III.2 Theoretical modeling of direct radiative capture
We used a simple potential model to calculate the cross section for direct capture of a low-energy neutron on 14C. The modeling of this radiative process was further simplified by relying on Siegert’s theorem to approximate the exact current form of the electromagnetic operator by its density form in terms of electrostatic multipoles. The calculations were performed with the direct-reaction code FRESCO Thompson (1988), and the radiative capture was modeled as a one-step process using first-order DWBA theory. A real potential was used to describe the incident wave, which is appropriate for capture far from resonances, and to generate the single-particle configurations of the ground and first-excited states of 15C (bound and , respectively). These two states are very close to pure single-particle configurations, which validates our potential-model approach. Since we assume that the observed, non-resonant cross section corresponds to direct radiative capture, the calculated cross section only had to be normalized by the final bound-state spectroscopic factor. The ratio of experimentally observed to calculated cross section is then a measure of the spectroscopic purity of the single-particle configuration. We note that the particular structure of the 15C states implies that E1 capture is only possible for p-wave neutrons. The possibility of E2 capture of s-wave neutrons to the first-excited state was also included in these calculations, but the contribution to the capture cross section was found to be less than at the relevant energies.
In all calculations, single-particle configurations were generated from a Woods-Saxon potential well with the geometry of Ref. Capel et al. (2003). The potential depths were chosen to reproduce the binding energies of the two bound states in 15C with respect to the thresholds. This procedure led to slightly different potential depths for the ( MeV) and ( MeV) channels. Since -wave capture is the dominating process, the potential was used to describe the scattering wave of the incoming channel. The use of -dependent potentials is, in principle, not compatible with the requirements of applying Siegert’s theorem. However, for the case considered here, we found that the difference between the initial- and final-state potentials was so small that Siegert’s theorem was still valid.
The calculated radiative-capture cross section was convoluted with the
neutron spectra of Fig. 3
to facilitate a direct comparison with the data from
the activation measurement. The calculated capture to the first excited
state of 15C was normalized by the spectroscopic factor , extracted from experimental neutron transfer
data Goss et al. (1975). Since this channel contributes less than
to the total capture cross section at the relevant energies, the
final result is not very sensitive to the particular choice of this
spectroscopic factor. A fit to the experimental data, weighted by the
relative error bar of each data point, was then performed and resulted
in a best-fit spectroscopic factor of for the
ground state single-particle configuration, which is in good agreement
with 0.88 as derived from (d,p) data Goss et al. (1975). The final
calculated cross section, convoluted with the different neutron spectra,
is compared with the experimental data in
Table 5. In addition, the energy-differential
cross section, including the 1 error band, is shown in
Fig. 7.

III.3 Recommended astrophysical reaction rates
The fitted theoretical cross section of the previous section was used to compute reaction rates for astrophysical applications. The resulting reaction rate is plotted in Fig. 8 as a function of stellar temperature (in units of K). The applicability of the calculated capture cross section is restricted by the experimental energy range used in the activation measurement, i.e. from 1 keV to 1 MeV. The extracted reaction rate is therefore presented up to a maximum temperature of K. Extrapolations beyond this temperature range would yield results that are not restricted by the data from the present experiment.

The reaction rates were fitted to the parametrization suggested by Rauscher and Thielemann Rauscher and Thielemann (2000)
The reaction rate is given in cm3s-1mol-1 with the temperature in K. The best-fit parameters, which reproduce the numerical values to within in the temperature range, are:
IV Discussion and Astrophysical Implications
Compared to the result of the previous activation with keV Beer et al. (1992) (b) we find agreement, if the sample mass measured in this work and the currently available decay properties of 15C are taken into account. The agreement is then within 1.
All available differential data for the total capture cross section of 14C are compared in Fig 9. The data are divided by to remove the energy dependence caused by the -wave orbital-momentum barrier. The present cross section results are in good agreement with theoretical estimates of Wiescher et al. Wiescher et al. (1990) and with the recently published estimates of Timofeyuk et al. Timofeyuk et al. (2006) based on mirror symmetry considerations. Our data fall approximately 20% below the values of Descouvemont Descouvemont (2000), but exhibit the same energy dependence.
The results of Horváth et al. Horváth et al. (2002), which were obtained in a Coulomb-breakup study, show a large, constant offset (Fig 9). In other words, not only the cross section values are different, but also the energy dependence. The difference can be expressed as:
With respect to the importance of the 14C()15C cross section for validating the Coulomb-break-up approach for deducing this cross section from the time-reversed dissociation of 15C it is important, however, to emphasize that the present results are in good agreement with preliminary data from two other Coulomb break-up studies Datta Pramanik et al. (2003); Nakamura et al. (2003); Nakamura (2004).

Since the paper by Beer et al. Beer et al. (1992), a comparison of the differential cross section at 23.3 keV is published in most papers dealing with the 14C() cross section. We note that the value published by Beer et al. was a Maxwellian averaged cross section for , which is different from the differential cross section at keV. In this tradition, a comparison of the differential 23.3 keV cross sections is presented in Fig. 10. The present value of 5.2 0.3 barn is based on the theoretical description of the cross section provided in the previous section.

The rate suggested by Wiescher et al. (1990) has been used for most of the nucleosynthesis simulations of the scenarios summarized at the beginning of this paper. The agreement with the present experimental results confirms many of the previous model predictions. While present Cosmologies dismiss the likelihood of inhomogeneous Big Bang scenarios, previous simulations of the associated nucleosynthesis Rauscher et al. (1994) based on this 14C() reaction rate demonstrated a substantial production of 14C at such conditions.
The role of the 14C()15C reaction as the slowest link in the neutron induced CNO cycles proposed by Wiescher et al. (1999) is also confirmed by the present results. Detailed simulations now help to analyze the impact of such a cycle on the neutron flux during core carbon burning and shell carbon burning. These results indicate that many more branches exist due to the presence of charged particles in stellar helium and carbon burning environments Pignatari et al. (2007). For helium burning most of the 13C produced by 12C() is depleted by the 13C() reaction rather than by 13C() and the production of 14C is negligible as shown already by Travaglio et al. (1996). This may be different for shell carbon burning which is characterized by higher 12C abundances and a significantly lower flux. New simulations on aspects of neutron production and capture reactions are presently in preparation Pignatari et al. (2008). The study indicates that the main production of 14C is given by the two reactions 14N()14C and 17O()14C. Because of the here confirmed low cross section, the 14C() reaction does not play a significant role for reducing the 14C abundance. However, because of the relatively high temperatures of T1 GK in the carbon burning zone, alternative depletion channels open via 14C()14N with a negative Q-value of -626 keV and via 14C()18O alpha capture providing a new abundance balance.
New simulations are also underway for studying the impact of neutron capture reactions on neutron rich Be, B, and C isotopes on the nucleosynthesis of light elements in neutrino driven wind supernova shock scenarios Bartlett et al. (2006). The completion of these studies does however require a detailed analysis of neutron capture reactions on short-lived neutron rich isotopes to simulate the anticipated reaction flow reliably Terasawa et al. (2001). New shell model based simulations of these rates are presently in preparation taking also into account the rapidly growing experimental nuclear structure information on neutron rich nuclei in the Be to Ne range.
V Summary
We have measured the 14C(15C cross section applying the activation technique with four different energy distributions. The results of the present experiment has removed the uncertainty associated with the results of the previous 14C() activation measurement by Beer and Käppeler (1980). A theoretical fit of the present cross section data is in good agreement with the capture cross sections deduced from Coulomb dissociation studies of 15C beams by Datta Pramanik et al. (2003) and Nakamura et al. (2003) while in striking disagreements with a third measurement by Horváth et al. (2002). Moreover, our results and analysis demonstrate good agreement with a number of theoretical predictions for the reaction rate by Wiescher et al. (1990) and Timofeyuk et al. (2006).
The experimental results confirm the rate suggested by Wiescher et al. (1990), which has been used for most of the nucleosynthesis simulations mentioned in the Sec. I. Therefore, the astrophysical consequences of the previous model predictions remain essentially unchanged. A new aspect concerning the role of neutron capture reactions on neutron rich Be, B, and C isotopes is the production of light elements in neutrino driven wind supernova shock scenarios, which are presently under investigation Bartlett et al. (2006).
Acknowledgements.
We would like to thank E.-P. Knaetsch, D. Roller, and W. Seith for their support at the Karlsruhe Van de Graaff accelerator. We are also grateful to M. Pignatari for discussing the impact of our experimental results on the 14C nucleosynthesis during stellar helium and carbon burning. This work was partly supported by the Joint Institute for Nuclear Astrophysics (JINA) through NSF Grants Nos. PHY-0072711 and PHY-0228206, and partly performed under the auspices of the U.S. Department of Energy by the University of California, Lawrence Livermore National Laboratory (LLNL) under contract No. W-7405-Eng-48 and the Los Alamos National Laboratory (LANL) under the auspices of Los Alamos National Security, LLC, DOE contract number DE-AC52-06NA25396.References
- Applegate and Hogan (1985) J. H. Applegate and C. J. Hogan, Phys. Rev. D (Particles and Fields) 31, 3037 (1985).
- Applegate et al. (1988) J. H. Applegate, C. J. Hogan, and R. J. Scherrer, Astrophysical Journal 329, 572 (1988).
- Malaney and Fowler (1988) R. A. Malaney and W. A. Fowler, Ap. J. 333, 14 (1988).
- Ajzenberg-Selove (1986) F. Ajzenberg-Selove, Nucl. Phys. A 449, 1 (1986).
- Wiescher et al. (1999) M. Wiescher, J. Görres, and H. Schatz, Journal of Physics G Nuclear Physics 25, 133 (1999).
- Terasawa et al. (2001) M. Terasawa, K. Sumiyoshi, T. Kajino, G. J. Mathews, and I. Tanihata, Astrophys. J. 562, 470 (2001).
- Wiescher et al. (1990) M. Wiescher, J. Görres, and F.-K. Thielemann, Ap. J. 363, 340 (1990).
- Timofeyuk et al. (2006) N. K. Timofeyuk, D. Baye, P. Descouvemont, R. Kamouni, and I. J. Thompson, Phys. Rev. Let. 96, 162501 (2006).
- Horváth et al. (2002) A. Horváth, J. Weiner, A. Galonsky, F. Deák, Y. Higurashi, K. Ieki, Y. Iwata, A. Kiss, J. Kolata, Z. Seres, et al., Ap. J. 570, 926 (2002).
- Datta Pramanik et al. (2003) U. Datta Pramanik, T. Aumann, K. Boretzky, B. Carlson, D. Cortina, T. Elze, H. Emling, H. Geissel, A. Grünschloß, M. Hellström, et al., Phys. Lett. B 551, 63 (2003).
- Nakamura et al. (2003) T. Nakamura, N. Fukuda, N. Aoi, H. Iwasaki, T. Kobayashi, T. Kubo, A. Mengoni, M. Notani, H. Otsu, H. Sakurai, et al., Nuclear Physics A 722, 301 (2003).
- Beer et al. (1992) H. Beer, M. Wiescher, F. Käppeler, J. Görres, and P. E. Koehler, Ap. J. 387, 258 (1992).
- Reifarth et al. (2005) R. Reifarth, M. Heil, R. Plag, U. Besserer, S. Dababneh, L. Dörr, J. Görres, R. C. Haight, F. Käppeler, A. Mengoni, et al., Nucl. Phys. A 758, 787C (2005).
- Alburger and Millener (1979) D. E. Alburger and D. J. Millener, Phys. Rev. C 20, 1891 (1979).
- Audi et al. (1997) G. Audi, O. Bersillon, J. Blachot, and A. H. Wapstra, Nucl. Phys. A 624, 1 (1997).
- Beer (1991) H. Beer, Ap. J. 375, 823 (1991).
- Anttila et al. (1977) A. Anttila, J. Keinonen, M. Hautala, and I. Forsblom, NIM 147, 501 (1977).
- Apostolakis (1993) J. Apostolakis, Tech. Rep., CERN, GEANT library (1993), http://wwwinfo.cern.ch/asd/geant/.
- Görres et al. (1998) J. Görres, J. Meißner, H. Schatz, E. Stech, P. Tischhauser, M. Wiescher, D. Bazin, R. Harkewicz, M. Hellström, B. Sherrill, et al., Physical Review Letters 80, 2554 (1998).
- Firestone (1996) R. B. Firestone, Table of Isotopes (Wiley, New York, 1996).
- Browne and Firestone (1986) E. Browne and R. Firestone, Table of Radioactive Isotopes (Wiley, New York, 1986).
- Liskien and Paulsen (1975) H. Liskien and A. Paulsen, Atomic Data and Nucl. Data Tables 15, 57 (1975).
- Ratynski and Käppeler (1988) W. Ratynski and F. Käppeler, Phys. Rev. C 37, 595 (1988).
- Macklin (1982) R. Macklin (1982), private communication to Mughabghab, S.F.
- Beer and Käppeler (1980) H. Beer and F. Käppeler, Phys. Rev. C 21, 534 (1980).
- Dörr et al. (2005) L. Dörr, U. Besserer, M. Glugla, S. Grünhagen, B. Kloppe, M. Sirch, and J. Hemmerich, Fusion Sci. Tech. 48, 358 (2005).
- NUD (2007) Tech. Rep., Brookhaven National Laboratory (2007), online Nuclear Data Files NUDAT: www.nndc.bnl.gov/nudat2/.
- Beer et al. (1994) H. Beer, G. Rupp, G. Walter, F. Voss, and F. Käppeler, Nucl. Instr. Meth. A 337, 492 (1994).
- Thompson (1988) I. J. Thompson, Comp. Phys. Rep. 7, 167 (1988).
- Capel et al. (2003) P. Capel, D. Baye, and V. S. Melezhik, Phys. Rev. C 68, 014612 (2003).
- Goss et al. (1975) J. D. Goss, P. L. Jolivette, C. P. Browne, S. E. Darden, H. R. Weller, and R. A. Blue, Phys. Rev. C 12, 1730 (1975).
- Rauscher and Thielemann (2000) T. Rauscher and F.-K. Thielemann, Atomic Data Nucl. Data Tables 75, 1 (2000).
- Descouvemont (2000) P. Descouvemont, Nuclear Physics A 675, 559 (2000).
- Nakamura (2004) T. Nakamura (2004), private communication.
- Pramanik and Land-Cb-Frs-Collaboration (2002) U. D. Pramanik and Land-Cb-Frs-Collaboration, Progress of Theoretical Physics Supplement 146, 427 (2002).
- Rauscher et al. (1994) T. Rauscher, J. Applegate, J. Cowan, F.-K. Thielemann, and M. Wiescher, Ap. J. 429, 499 (1994).
- Pignatari et al. (2007) M. Pignatari, R. Gallino, M. Heil, M. Wiescher, F. Käppeler, F. Herwig, and S. Bisterzo, Ap. J. in prep. (2007).
- Travaglio et al. (1996) C. Travaglio, R. Gallino, C. Arlandini, and M. Busso, MemSAIt 67, 831 (1996).
- Pignatari et al. (2008) M. Pignatari, R. Gallino, M. Wiescher, and F. Herwig, Ap. J. in prep. (2008).
- Bartlett et al. (2006) A. Bartlett, J. Görres, G. J. Mathews, K. Otsuki, M. Wiescher, D. Frekers, A. Mengoni, and J. Tostevin, Phys. Rev. C 74, 015802 (2006).