A Measurement of Coherent Neutral Pion Production in Neutrino Neutral Current Interactions in the NOMAD Experiment
Abstract
We present a study of exclusive neutral pion production in neutrino-nucleus Neutral Current interactions using data from the NOMAD experiment at the CERN SPS. The data correspond to muon-neutrino Charged Current interactions in the energy range GeV. Neutrino events with only one visible in the final state are expected to result from two Neutral Current processes: coherent production, and single production in neutrino-nucleon scattering. The signature of coherent production is an emergent almost collinear with the incident neutrino while ’s produced in neutrino-nucleon deep inelastic scattering have larger transverse momenta. In this analysis all relevant backgrounds to the coherent production signal are measured using data themselves. Having determined the backgrounds, and using the Rein-Sehgal model for the coherent production to compute the detection efficiency, we obtain corrected coherent- events with GeV. We measure . This is the most precise measurement of the coherent production to date.
keywords:
coherent pion neutrino neutral currentPACS:
13.15.+g , 13.85.Lg , 14.60.Lm1 Motivation
Precise measurement of production when a neutrino scatters coherently off a target nucleus, , depicted in Figure 1, is challenging: the cross-section () of coherent- (Coh ) is 0.003 of the inclusive neutrino charged current (CC) interactions at GeV [1]; the single is notoriously refractory to accurate identification in neutrino detectors. Consequently the past cross-section measurements of Coh have been poor, with a precision no better than [2, 3, 4, 5, 6]; recently the MiniBOONE experiment has reported the fraction of Coh in all exclusive NC production [7] . This challenge is the primary motivation for the present analysis. The second motivation is utilitarian. Since Coh is almost collinear with the incident neutrino, in massive neutrino detectors a Coh event will manifest itself as a forward electromagnetic shower posing a background for the -induced signal. This is relevant to the long baseline experiments searching for appearance with the purpose of measuring the mixing angle . A precise measurement of Coh , although conducted at energies higher than those of the long baseline projects at Fermilab (MINOS/NOA), will constrain the error on a model-prediction of this background to the appearance. Finally, the study of coherent pion production provides an insight into the structure of the weak hadronic current [1, 8], and offers a test of the partially conserved axial-vector current hypothesis (PCAC) [9]. Ref. [10] presents an excellent review of these topics.
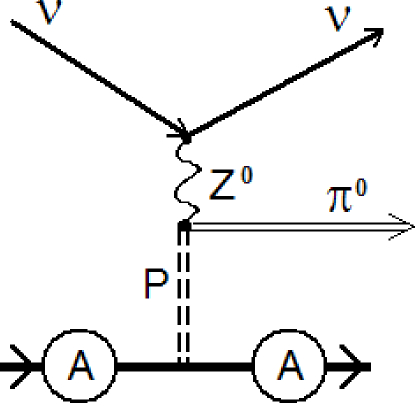
A coherent interaction, Figure 1, where no charge or isospin is exchanged between the and the target nucleus () which recoils without breakup, leads to an enhancement in the cross-section. In the Coh process the interaction is mediated by a pomeron-like particle bearing the quantum number of the vacuum. The cross section is dominated by the axial vector current. The contribution of the isovector current to the Coh process is minimal where can be viewed as a meson which produces a exchanging an isoscalar with . This minimal contribution of the isovector current to the Coh arises from two reasons: (a) the cross section of the isovector - interaction is zero in the forward direction, a direction preferred by the nuclear form factor; and (b) the vector component has a contribution proportional to reducing the isovector contribution further, the net reduction with respect to the axial part being a factor of 3.5. The PCAC hypothesis stipulates that for zero-momentum transfer (, where is the negative of the square of the four-momentum transfer from the incident neutrino to the target), the - cross section can be related to the - cross section. The - cross section in the forward direction is related to the strong - interaction as follows:
| (1) |
In Equation (1) is the Fermi coupling constant, is the nucleon mass, and , where is the energy of the hadronic system in the final state, are the standard scaling variable, and is the pion decay constant. The variable quantifies the coherence (forwardness) and is defined as , i.e. the square of the four-momentum transfer to the nucleus. In a neutral current (NC) event since the emergent neutrino remains invisible, cannot be measured. Instead the very small transverse momentum expected in a coherent interaction can be quantified using the variable defined as: This variable has the property that its distribution depends weakly on the incident neutrino energy.
For low but non-zero values, the hadron dominance model [11] provides a guide to extend the cross section formula for the Coh -like process. The boson can be viewed as a superposition of axial vector and vector currents. These compose the weak hadronic current.
2 Beam and Detector
The Neutrino Oscillation MAgnetic Detector (NOMAD) experiment at CERN used a neutrino beam [12] produced by the 450 GeV protons from the Super Proton Synchrotron (SPS) incident on a beryllium target and producing secondary , , and mesons. The positively charged mesons were focussed by two magnetic horns into a 290 m long evacuated decay pipe. Decays of , , and produced the SPS neutrino beam. The average neutrino flight path to NOMAD was 628 m, the detector being 836 m downstream of the Be-target. The SPS beamline and the neutrino flux incident at NOMAD are described in [13]. The -flux in NOMAD is constrained by the and production measurements in proton-Be collision by the SPY experiment [14, 15, 16] and by an earlier measurement conducted by Atherton et al. [17]. The -integrated relative composition of ::: CC events, constrained by the measurement of CC-interactions of each of the neutrino species, is . Thus, 95% of -events, are due to -interactions with a small -contamination.
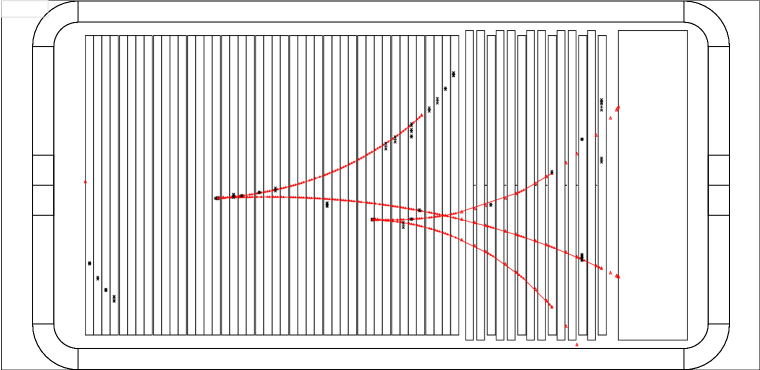
The NOMAD experiment was designed to search for oscillations at eV2, and in large range it set stringent limit [18] on this search, along with the CHORUS experiment [19]. The NOMAD apparatus [20] was composed of several sub-detectors. The active target comprised 132 planes of m2 drift chambers (DC) with an average density similar to that of liquid hydrogen (0.1 gm/cm3). On average, the equivalent material in the DC encountered by particles produced in a -interaction was about half a radiation length and a quarter of an hadronic interaction length (). The fiducial mass of the NOMAD DC-target, 2.7 tons, was composed primarily of carbon (64%), oxygen (22%), nitrogen (6%), and hydrogen (5%) yielding an effective atomic number, =12.8, similar to carbon. Downstream of the DC, there were nine modules of transition radiation detectors (TRD), followed by a preshower (PRS) and a lead-glass electromagnetic calorimeter (ECAL). The ensemble of DC, TRD, and PRS/ECAL was placed within a dipole magnet providing a 0.4 T magnetic field orthogonal to the neutrino beam line. Two planes of scintillation counters, and , positioned upstream and downstream of the TRD, provided the trigger in combination with an anti-coincidence signal, , from the veto counter upstream and outside the magnet. Downstream of the magnet was a hadron calorimeter, followed by two muon-stations each comprising large area drift chambers and separated by an iron filter placed at 8- and 13-’s downstream of the ECAL, that provided a clean identification of the muons. The schematic of the detector in the Y-Z view is shown in Figure 2. The charged tracks in the DC were measured with an approximate momentum () resolution of ( in GeV/ and in meters) with unambiguous charge separation in the energy range of interest. The detailed individual reconstruction of each charged and neutral track and their precise momentum vector measurement enabled a quantitative description of the event kinematics: the strength and basis of NOMAD analyses. The experiment recorded over 1.7 million neutrino interactions in its active drift-chamber (DC) target. These data are unique in that they constitute the largest high resolution neutrino data sample with accurate identifications of , , , and charged current interactions in the energy range GeV. In addition, the experiment recorded over 2 million -interactions in the Al-coil and over 20 million in the Fe-scintillator calorimeter, both upstream of the active-DC target.
3 The Coh Signature and Models
The signature for Coh is a single forward and nothing else. The will promptly decay into two forward photons (). In massive neutrino detectors the signal will manifest itself as an electromagnetic shower, short and compact, with a forward direction. The accompanying irreducible backgrounds will be , , and -NC events dominated by ’s. In NOMAD, however, the Coh signal will reveal two distinct photons. The photons will either both convert in the DC target, or one of the photons will convert in the tracker and the other will be measured in the electromagnetic calorimeter (ECAL), or both photons will be measured in the ECAL. In this analysis we focus on the event sample where both photons convert in the DC target. Figure 2 shows such an event. The momenta of the associated and are measured in the magnetic field. Each event thus provides a complete -momentum vector. We use the Rein-Sehgal (RS) model [1] to simulate the Coh interaction in the NOMAD detector. As a check we also simulated the Coh interaction following the Belkov-Kopeliovich (BK) [8] model. The reconstruction efficiency computed using the BK model is similar to that determined by the RS model.
Recently a set of new Coh calculations has been proposed (see [21], [22], and [23]). They focus on Coh production in low-energy neutrino interaction ( GeV). However, the present Coh measurement at an average GeV, more precise by about a factor of three than currently available, could be used to constrain parameters used in these calculations.
4 Selection of Exclusive - Events
We select events with two converted photons in the DC target. The analysis uses the entire NOMAD data and the associated Monte Carlo (MC) samples as described in [24]. The number of fully corrected -CC in the standard fiducial volume of NOMAD is events: the denominator for the present measurement. The NC-DIS sample, defined by requiring that the generated invariant hadronic mass squared () be GeV2, is normalized to events which corresponds to 0.37 of the -CC. The NC-Resonance () sample is set at 3.5% of the NC-DIS. The MC sample specific to this analysis is the RS Coh simulation. Motivated by the -induced coherent- cross sections presented in [8] and the fact that the NC/CC coherent pion cross section ratio should be (1/2), the Coh sample is normalized to 5000 events with generated GeV. The large sample of data and those of the NC and CC deep inelastic scattering (DIS) MC events are subjected to a preselection. The preselection includes the following requirements: (a) the presence of one converted photon whose reconstructed conversion point is defined as the event vertex (, , ); (b) no identified muons; (c) vertex coordinates of the converted photon within the fiducial volume, cm and cm where depends upon the detector configuration (see [24] for detail); (d) the invariant mass () of the and less than 100 MeV/ which selects both the converted photons — the upstream being , and the downstream being —, with 95% purity and 97% efficiency. The preselection reduces the data and the NC-MC samples by a factor of about a hundred.
The cuts for the final selection of the Coh events are set to maximize the selection efficiency of two photon conversions in the DC tracker. The cuts are optimized to reduce the NC-DIS background while keeping the Coh signal high. We also look at about 10% of the data to check the efficacy of cuts used in reducing the background induced by -interactions occurring outside the fiducial volume — the outside background (OBG). The remaining data have no influence on the choice of the cuts. The results presented here include the entire data sample. Among the generated Coh , only about 29% of events trigger the apparatus. The loss arises from the non-converted photons () and, among the converted photons, from the tracks that do not reach the downstream trigger counters ().
The final event selection follows the preselection cuts with more stringent requirement. The cut is tightened to MeV/ which increases the photon conversion purity to while reducing the efficiency to 93%. Two additional cuts are imposed to reduce outside background by requiring that there be no tracks upstream of the first photon conversion ( ) and that there be no hits associated with the tracks composing the in the most upstream DC. The second photon conversion, , occurs downstream. The two reconstructed photon momentum vectors enable one to determine the -interaction vertex by extrapolating the vectors upstream and finding the coordinates of their distance of closest approach (DCA). The procedure defines the DCA-vertex with coordinates denoted as DCA-X, DCA-Y, and DCA-Z. The DCA-vertex resolution is well understood using ordinary -interactions where the primary charged tracks composing the event vertex are ignored and the rest of the event is subjected to the and reconstruction. The DCA-X and DCA-Y resolution is cm. However, the DCA-Z resolution is poor, cm. This is expected since photons from a Coh decay have a small opening angle, consequently their intersection in the Z-direction will be poorly determined. Finally, the angular resolution of the and vectors is precise ( mrad) but the momentum resolution, as determined via the curvature of the and tracks, is poorer () due to the bremsstrahlung losses. Therefore we have principally relied upon angular variables to determine the signal. Table 1 summarizes the selection of events in the MC samples. The reconstruction efficiency of the Coh signal is 7.8% (the BK model yields 7.7%.) Table 1 also shows that the NC-Resonance production contributes less than 1% to the sample. In the following the resonance contribution is simply added to the NC-DIS component. The preselected data are subjected to identical cuts. Having identified the two photons, and having imposed the DCA-X/Y cuts, data can be compared with the respective predictions as shown in the Table 2. Note that the fraction of events failing the DCA-Z cut is larger in data than those in the Coh and NC-DIS simulations. This is due to neutrinos interacting in material just outside the fiducial volume cut such as the magnet, coil, etc., which are not simulated in the MC. Some of these interactions will also produce events with DCA-Z . The measurement of this background and the calibration of the NCDIS and Coh predictions are presented in the following section.
| Cut | Coh -RS | NC-DIS | NC-Res |
|---|---|---|---|
| Raw | 1435.4 | 4743.2 | 1132.8 |
| No -ID | 1435.4 | 4687.9 | 1125.7 |
| Fid-Cuts | 1373.0 | 4682.3 | 1030.4 |
| MeV | 917.5 | 3664.9 | 27.2 |
| No Upstream Track | 862.2 | 1717.7 | 23.8 |
| No Veto | 858.4 | 1659.5 | 23.7 |
| Fid-Cuts | 128.9 | 311.7 | 1.2 |
| MeV | 117.5 | 236.7 | 1.1 |
| GeV | 117.5 | 236.7 | 1.1 |
| DCA- cm | 115.9 | 225.2 | 1.0 |
| DCA- | 112.6 | 222.5 | 1.0 |
| DCA- | 3.3 | 2.7 | 0.0 |
5 Extraction of the Coh Signal
The extraction of Coh signal is data driven. Monte Carlo simulations can neither reliably provide the normalization of the outside-background nor the normalization of the NC-DIS induced where nothing else is visible nor the shape of the variables. Distinct control samples in the data provide a measure of these backgrounds, including the integral and the shape of the variables relevant to this analysis.
First we present the measurement of background induced by -interactions outside the fiducial volume (OBG). As shown in Table 1, the fraction of MC events in the fiducial region but with DCA-Z is negligible. The 169 data events that fail the DCA-Z cut (see Table 2) are dominated by interactions upstream of the detector (); the contribution from the events entering from the sides give a small contribution ( of the background). This is for two reasons: first, since the transverse resolution of DCA-vertex is accurate to cm, the DCA-X and DCA-Y cuts largely eliminate these events; second, among the events relevant to the Coh selection the two photons travel along the beam while particles entering the detector from the sides have much larger angles.
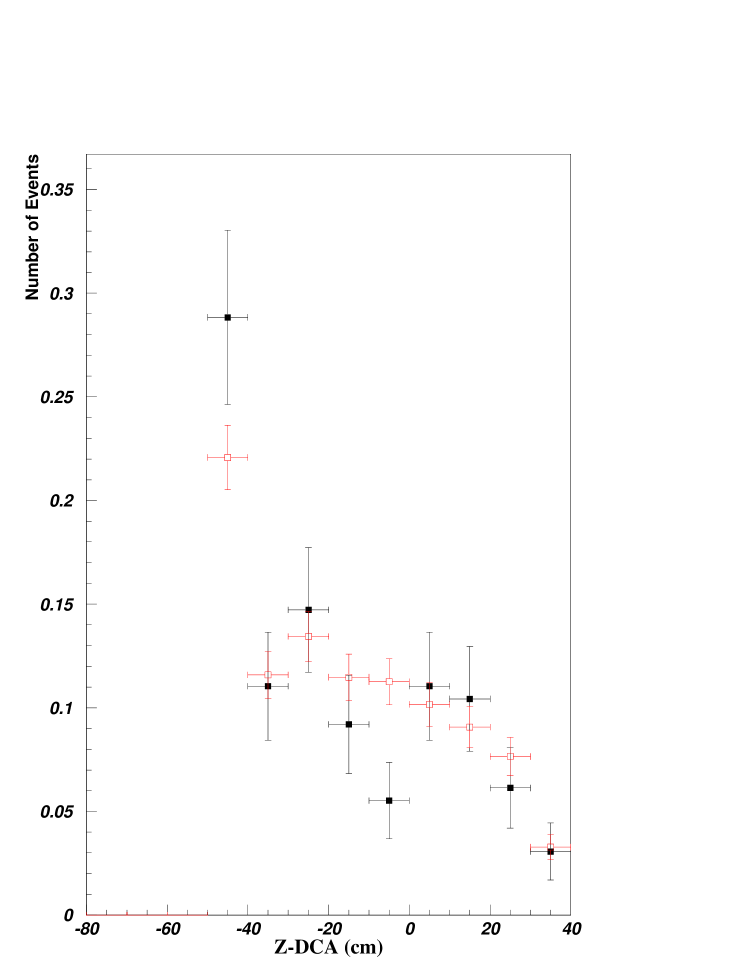
The 169 events failing the DCA-Z cut (Table 2) are the key to providing the normalization for the outside-background (OBG). To determine the OBG a different data sample is selected in which a vertex is reconstructed upstream of the detector (). In this control sample the primary tracks are then ignored and the events are subjected to the Coh analysis. A total of 1378 events survive this selection of which 451 (927) events have the DCA vertex within (outside) the fiducial volume. Figure 3 compares the shape of the Z-distribution of the DCA of the 169 events that fail the DCA cut in the Coh signal sample with the 927 events that fail this cut in the control sample. The shapes agree well.
We thus measure the normalized OBG prediction to be: events. The distributions of the OBG variables (vertex position, , Mγγ , etc.) are measured using the two-photon data with DCA-Z normalized to 82.2 events. Table 2 presents the calibrated OBG background.
Second, we present the measurement of the NC-DIS background. The NC-DIS component of the 2- sample is selected using the kinematic variables. We use events with GeV/ or , where the Coh contribution is minimal, to obtain the normalization of the NC-DIS, 0.86, with a 7.5% statistical precision. The distributions of the NC-DIS variables predicted by the MC are corrected using the Data-Simulator (DS) technique: first, NC events with a reconstructed primary vertex are selected from both data and MC; then, after removing the primary tracks, these events are subjected to the Coh analysis; finally, the ratio Data/MC provides the DS-correction. This correction is found to be unity within . Table 2 presents the calibrated NC-DIS background.
| Cut | Coh -RS | NC-DIS | OBG | Total | Data |
|---|---|---|---|---|---|
| DCA- cm | 114.2 | 193.7 | 241.9 | 549.8 | 550 |
| DCA- | 110.9 | 191.4 | 82.2 | 384.5 | 381 |
| DCA- | 3.3 | 2.3 | 159.7 | 165.3 | 169 |
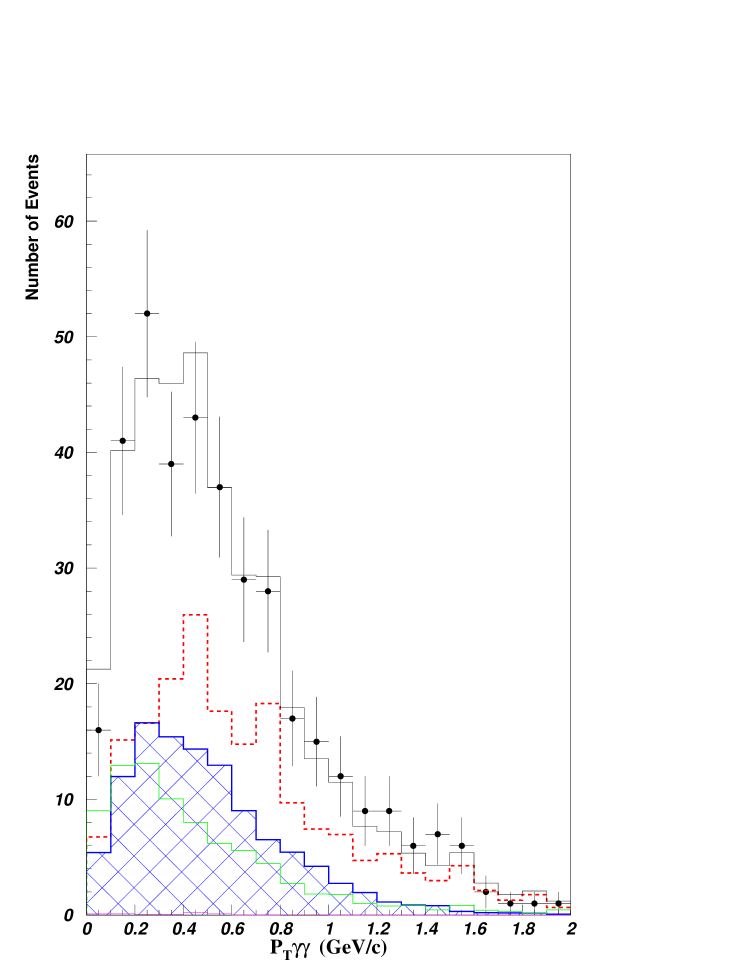
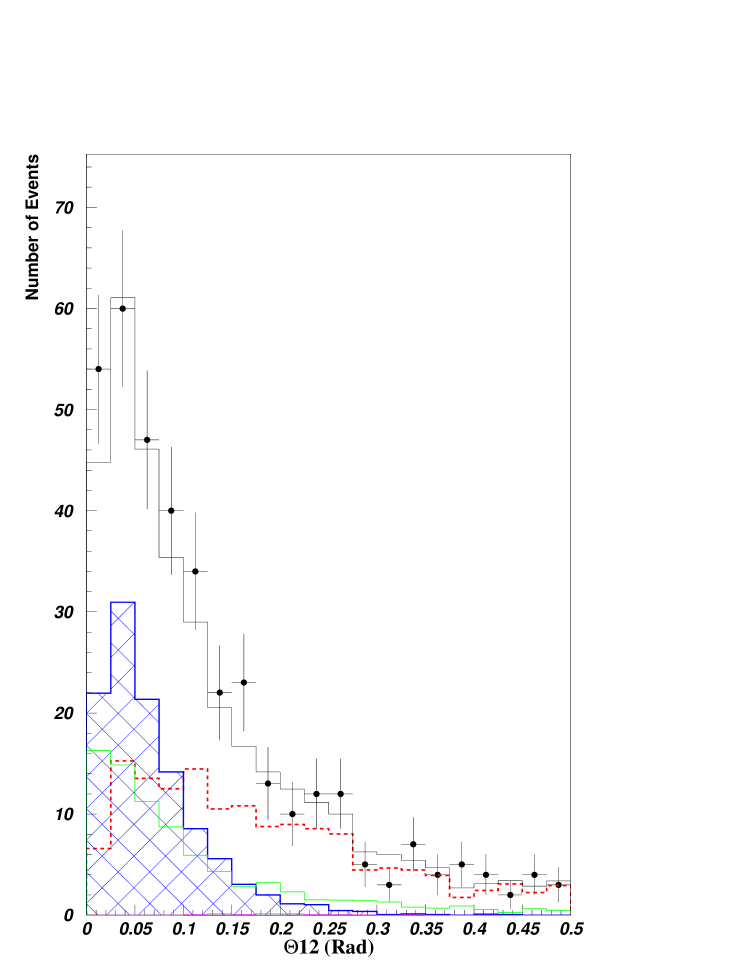
Finally, we present the extraction of the Coh signal which is based upon three variables: , , and , where is the opening angle between and . The choice of variables is dictated by the resolution. The variables and are correlated while displays no correlation with the former variables. A between data and prediction is defined using two distributions: the two-dimensional and distribution, and the distribution. The between the data and the prediction is minimized with respect to the Coh normalization factor, . The expected numbers of OBG and NC-DIS events are determined as described above, and are kept fixed, while the simulated Coh sample is normalized to 5000 generated events. The is minimized with respect to which is varied between 0 and 2 in steps of 0.01. The minimum , 45.1 for 44 degrees of freedom (DoF), is obtained for . The probability of this fit is 0.44. Using the number of Coh signal (112.6) in Table 1 and , we extract the observed signal: . The error is statistical and corresponds to a change by one unit.
To check if the two photon data can be explained using only OBG and NC-DIS component, we set the Coh contribution to zero and fit for the normalization of OBG and NC-DIS — their respective distributions being fixed by the data. The best was 80.3 for 43 DoF but neither the normalization nor any of the data distributions — the and vertex positions, the DCA-vertex position, energy, , , Mγγ , etc. — are well described by this hypothesis. The probability of this fit is 0.001.
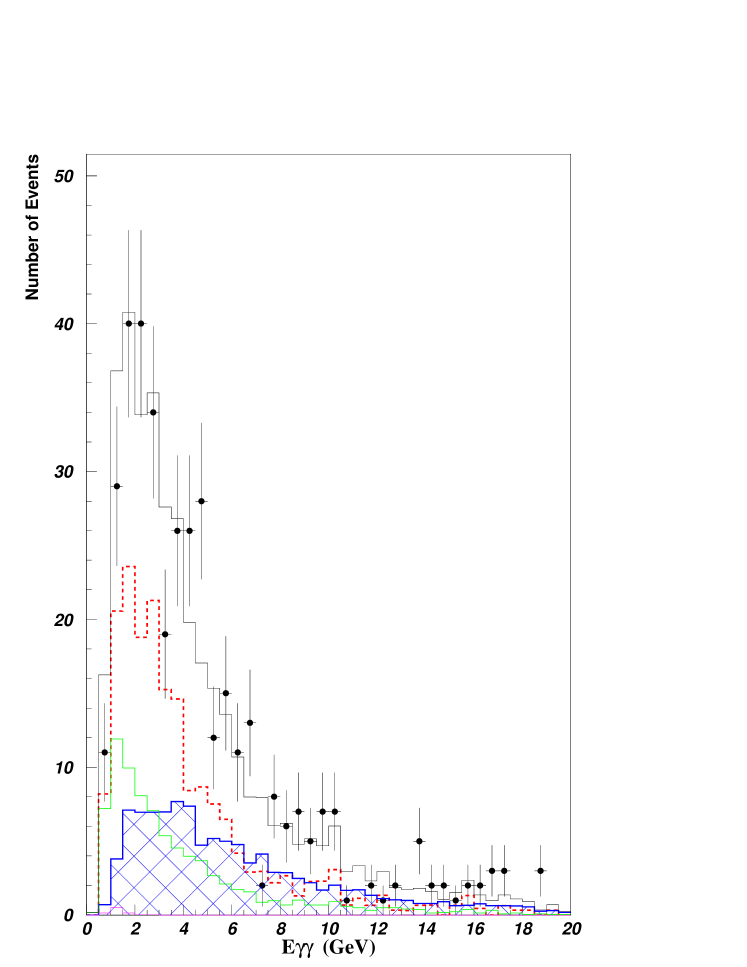
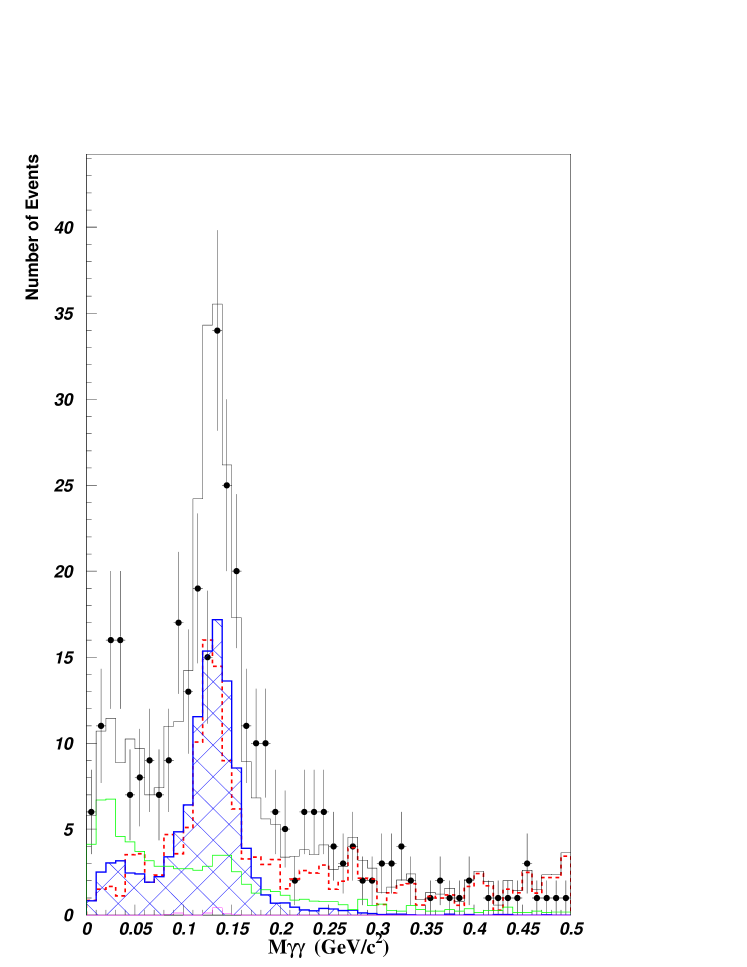
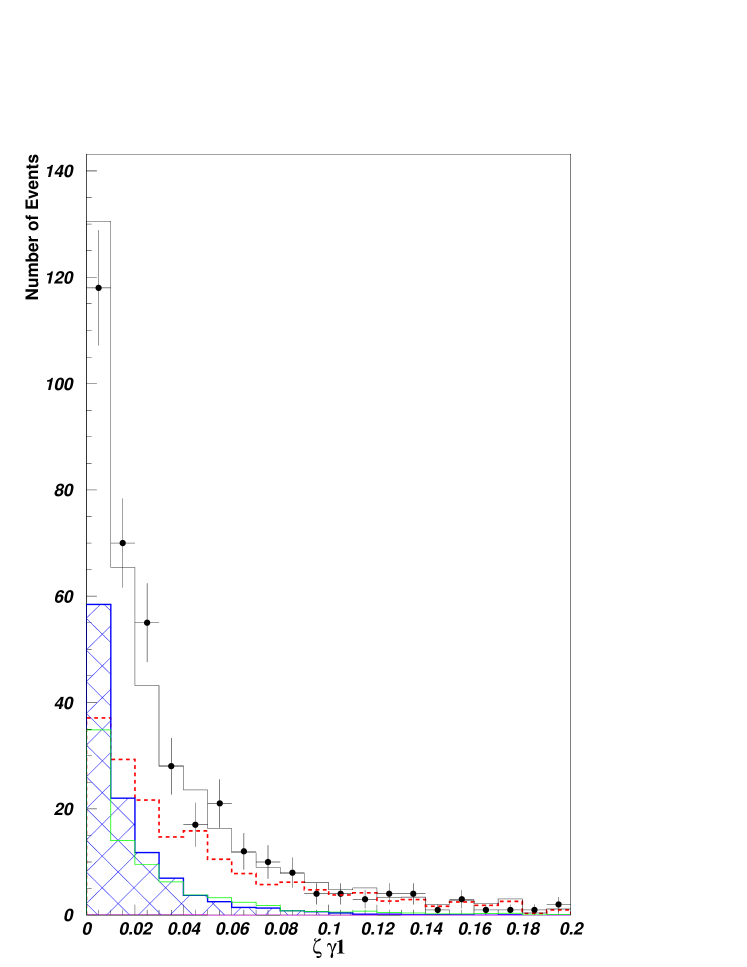
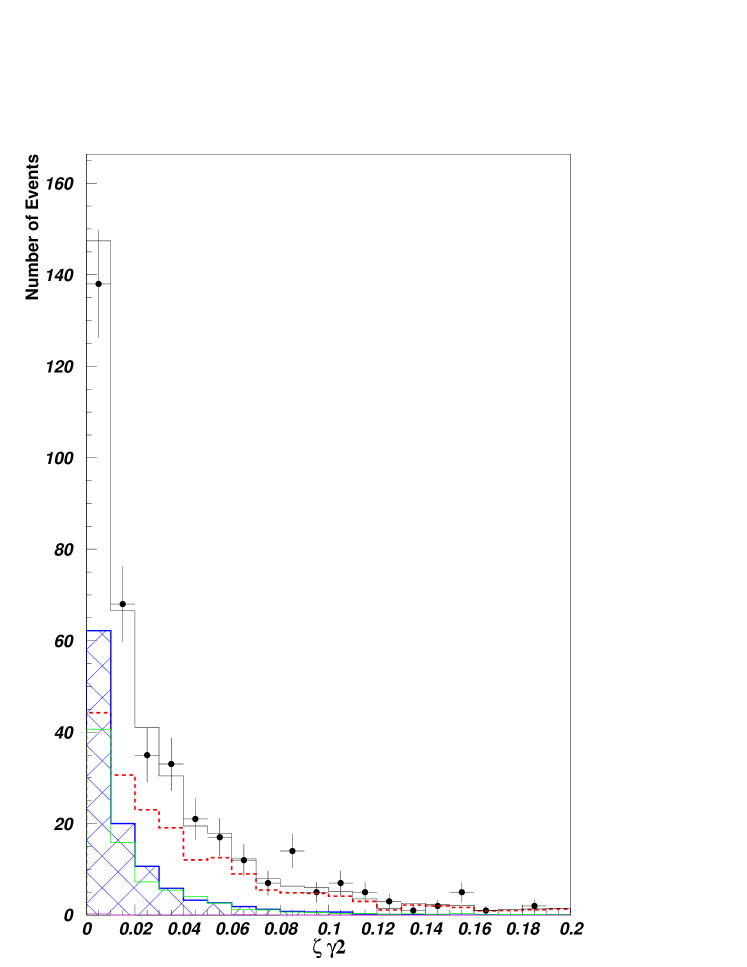
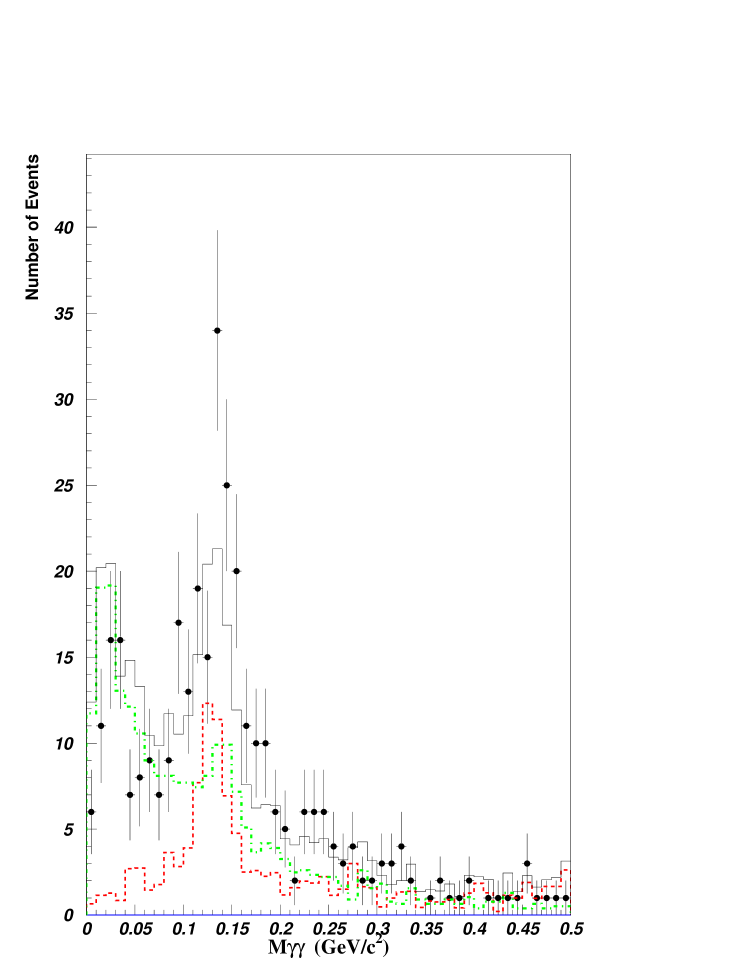
Having determined all the components of the 2- sample, Table 2 compares the final predictions with the data. Below we present a comparison of a set of salient variables between data in symbols and expectation — DS-corrected NC-DIS in red-dotted histogram, OBG in green-histogram, the Coh signal in blue-coarsely-hatched histogram, and the total expectation (MC) in black histogram. Figure 4 and Figure 5 compare the , defined as , and distributions. Figure 6 compares the invariant mass distribution computed using the and vectors. Figure 7 and Figure 8 compare the and distributions; and Figure 9 compares the distribution. The agreement between data and MC for the variables is satisfactory. For illustration, in Figure 10 we present the comparison of the Mγγ distribution between data and the best fitted (OBG+NC-DIS) prediction with Coh set to zero: here the Data-vs-MC increases by 12 units compared to the Figure 6.
6 Systematic Uncertainties
The principal source of systematic error in the measurement of the Coh cross section comes from the error in determining the NC-DIS induced contribution to the 2- sample. The 7.5% error in the NC-DIS contribution translates to 7.0% in the signal. Since the OBG is entirely determined by the 169 events that fail the DCA-cut, its contribution to the Coh signal is computed to be 5.4%. The error in the reconstruction efficiency is estimated to be 2.7% determined using -conversions from standard DIS interactions. Finally, the error in the absolute flux determination is determined to be 2.5% which comes about as follows: the error is 2.1% for GeV, 2.6% for GeV, and 4.0% for GeV as determined in [24]; these errors are folded in with the Coh cross-section as a function of yielding an overall flux normalization error of 2.5%. These errors are summarized in Table 3.
| Source | Error |
|---|---|
| NC-DIS | 7.0% |
| OBG | 5.4% |
| Reconstruction | 2.7% |
| Absolute Normalization | 2.5% |
| Total | 9.5% |
7 Result
Using the RS model, the Coh reconstruction efficiency is estimated to be 2.27%. This value is the product of the fraction of Coh events that trigger the apparatus (29.0%), and the reconstruction efficiency (7.8%). The -sample is dominated by the -interactions. The Coh sample is corrected for the small contribution from other neutrino species to yield a pure -contribution. The correction factor to account for the , , and contributions to the Coh interactions is 0.94. The factor takes into account the different energy spectra for the different -flavors (we assume that the and induced Coh cross sections are the same). The error in the Coh cross section due to this 6% correction is and is deemed negligible in this analysis. Thus the -induced Coh events are events. The number of fully corrected -CC in the same fiducial volume is measured to be . Our result is:
| (2) |
Using the measured inclusive -CC cross-section from [24] as a function of , the absolute cross section of Coh production for at the average energy of the neutrino flux GeV is determined to be:
| (3) |
The measurement agrees with the RS prediction of using and the CERN-SPS flux. A comparison of the NOMAD measurement of the Coh with other published measurements is summarized in Table 4.
To summarize, we have presented an analysis of the Coh interaction in the -NC using the two reconstructed photons in the final state. This is the most precise measurement of the Coh process.
Acknowledgments
We gratefully acknowledge the CERN SPS staff for the magnificent performance of the neutrino beam. The experiment was supported by the following agencies: ARC and DIISR of Australia; IN2P3 and CEA of France, BMBF of Germany, INFN of Italy, JINR and INR of Russia, FNSRS of Switzerland, DOE, NSF, Sloan, and Cottrell Foundations of USA, and VP Research Office of the University of South Carolina.
References
- [1] D. Rein and L. M. Sehgal, Nucl. Phys. B 223, 29 (1983).
- [2] H. Faissner et al., Phys. Lett. B 125, 230 (1983).
- [3] E. Isiksal et al. Phys. Rev. Lett. 52, 1096 (1984).
- [4] F. Bergsma et al. [CHARM Collaboration], Phys. Lett. B 157, 469 (1985).
- [5] H. J. Grabosch et al. [SKAT Collaboration], Z. Phys. C 31, 203 (1986).
- [6] C. Baltay et al., Phys. Rev. Lett. 57, 2629 (1986).
- [7] A. A. Aguilar-Arevalo et al. [MiniBooNE Collaboration], Phys. Lett. B 664, 41 (2008) [arXiv:hep-ex/0803.3423].
- [8] A. A. Belkov and B. Z. Kopeliovich, Sov. J. Nucl. Phys. 46, 499 (1987) [Yad. Fiz. 46, 874 (1987)].
- [9] S.L. Adler, Phys. Rev. B 135, 963 (1964).
- [10] B. Z. Kopeliovich and P. Marage, Int. J. Mod. Phys. A 8, 1513 (1993).
- [11] C.A. Piketty and L. Stodolsky, Nucl. Phys. B 15, 571 (1970).
- [12] G. Acquistapace , CERN-ECP/95-14
- [13] P. Astier et al. [NOMAD collaboration], NIM A 515, 800-828 (2003).
- [14] G. Ambrosini et al. [SPY Collaboration], Phys. Lett. B 420, 225 (1998).
- [15] G. Ambrosini et al. [SPY Collaboration], Phys. Lett. B 425, 208 (1998).
- [16] G. Ambrosini et al. [SPY Collaboration], Eur. Phys. J., C 10,605-627 (1999).
- [17] H.W. Atherton et al., CERN Yellow Report 80-07, 1980.
- [18] P. Astier et al. [NOMAD collaboration], Nucl. Phys. B 611, 3-39 (2001).
- [19] E. Eskut et al. [CHORUS Collaboration], Nucl. Phys. B 793, 326 (2008) [arXiv:0710.3361 [hep-ex]].
- [20] J. Altegoer et al. [NOMAD collaboration], NIM A 404, 96-128 (1998).
- [21] S. K. Singh, M. Sajjad Athar and S. Ahmad, Phys. Rev. Lett. 96, 241801 (2006).
- [22] L. Alvarez-Ruso, L. S. Geng and M. J. Vicente Vacas, Phys. Rev. C 76, 068501 (2007) [arXiv:nucl-th/0707.2172].
- [23] E. A. Paschos, A. Kartavtsev and G. J. Gounaris, Phys. Rev. D 74, 054007 (2006) [arXiv:hep-ph/0512139].
- [24] Q. Wu et al. [NOMAD collaboration], Phys. Lett. B 660, 19-25 (2008); arXiv:hep-ex/0711.1183.