also at ]Department of Physics, University of Ottawa, Ottawa, Canada, K1N 6N5.
All-optical conditional logic with a nonlinear photonic crystal nanocavity
Abstract
We demonstrate tunable frequency-converted light mediated by a nonlinear photonic crystal nanocavity. The wavelength-scale InP-based cavity supports two closely-spaced localized modes near 1550 nm which are resonantly excited by a 130 fs laser pulse. The cavity is simultaneously irradiated with a non-resonant probe beam, giving rise to rich second-order scattering spectra reflecting nonlinear mixing of the different resonant and non-resonant components. In particular, we highlight the radiation at the sum frequencies of the probe beam and the respective cavity modes. This would be a useful, minimally-invasive monitor of the joint occupancy state of multiple cavities in an integrated optical circuit.
To realize all-optical logic on an integrated semiconductor chip, it is necessary to develop a toolkit of logical operations (gates) which can manipulate optical signals. These operations serve to generate, condition, and detect optical signals, and are most naturally applied in cavities, where photons can be localized for many optical cycles. Recent work has demonstrated that photonic crystal nanocavities can be fabricated with factors greater than , and are thus capable of storing photons for more than 1 nanosecond Tanabe et al. (2007); Takahashi et al. (2007) and realizing one-bit delays in bit streams of data Notomi et al. (2008). Cavities can also serve as channel drop filters to transfer a signal from one waveguide to another Fan et al. (1998).
In both classical and quantum optical protocols, the ability to perform conditional logic requires nonlinear functionality Soljačić and Joannopoulos (2004); Turchette et al. (1995). Recent advances on this front include all-optical switching via bistability and free-carrier tuning Cowan and Young (2003); Tanabe et al. (2005); Barclay et al. (2005); Fushman et al. (2007); Almeida et al. (2004), dynamic factor control for the release of photons on demand Tanaka et al. (2007), and adiabatic frequency conversion through the perturbation of cavity modes McCutcheon et al. (2007a); Tanabe et al. (2009); Preble et al. (2007); Notomi et al. (2006). The latter approach is effective for generating small frequency shifts in an optical mode, but for larger shifts, the nonlinearity of the material can be exploited to generate new harmonics. Theoretical work has shown that, in principle, loss-less harmonic generation is feasible in doubly-resonant and cavities Rodriguez et al. (2007); Burgess et al. (2009). Experimentally, we have shown in our previous work that second-harmonic generation and sum-frequency generation are possible at microwatt-scale powers by leveraging the high factor and small mode volume of a photonic crystal nanocavity McCutcheon et al. (2007b).
To perform conditional logic, it is important to be able to monitor mode occupation in a cavity. In this letter, we use nonlinear mode mixing in a photonic crystal nanocavity to demonstrate a method to monitor the populations of modes in different cavities in a weakly perturbative fashion. The experiment involves conditionally generating a signal dependent both on the occupation of one microcavity mode (or many) and the overlapping presence of a transient (non-resonant) signal in the cavity. In addition to serving as a joint-state monitor, this technique could be used to generate new signals at a frequency of choice.
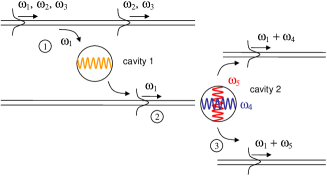
Our experiment is motivated by the schematic optical circuit of Fig. 1. The figure shows two cavities, 1 and 2, with 1 acting as a single mode channel drop filter Fan et al. (1998), and 2 acting to store photons at frequencies and . Signal is dropped from a multi-mode channel through the microcavity filter and into the middle waveguide. When signal reaches cavity 2, it can interact with modes and via the material second-order nonlinearity of the cavity. New signals are generated at and/or that are conditional on the combined occupation state of cavities 1 and 2. Our experiment illustrates the nonlinear physics involved in generating these conditional signals.
The slab which hosts the two-mode PhC nanocavity is a 230 nm thick [001]-oriented InP free-standing membrane mounted on a glass substrate. It is excited by a train of 130 fs pulses from a 80 MHz optical parametric oscillator (OPO) (Spectra Physics) with a bandwidth of 100 cm-1 and an average power of 60 W that is focussed through a 100 microscope objective. Using our well-established technique McCutcheon et al. (2005), the resonantly scattered light is collected in reflection, and detected in the cross-polarization with respect to the incident beam using a Bomem Fourier transform infrared spectrometer. The second-order radiation is collected in transmission using a 40 (NA=0.65) microscope objective, and detected using a grating spectrometer and a liquid-nitrogen cooled CCD detector.
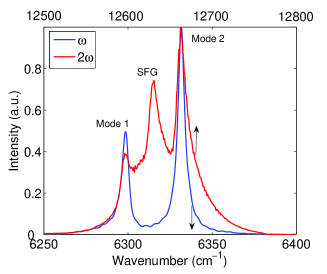
We first consider the resonant linear and nonlinear response of the cavity (taken to be cavity 2 in Fig. 1). The whole spectrum is excited simultaneously due to the wide bandwidth of the OPO, and the modes show up as resonant peaks. The linear spectrum is shown in blue in Fig. 2(b), clearly revealing the two modes of interest. These modes aren’t part of the usual in-bandgap spectrum of the L3-cavity, but rather are quasi-localized modes in the dielectric band continuum McCutcheon et al. (2007b). They suit our purposes well because of their close spectral spacing (which allows simultaneous excitation by a single short pulse) and relatively high factors. The nonlinear spectrum, superimposed on the same plot for comparison purposes, is shown in red. The lowest and highest energy peaks are at exactly twice the frequencies of the microcavity modes evident in the linear spectra, and the central sharp feature, at 2 6315 cm-1, is at precisely their sum frequency. The extra peak at the sum frequency therefore corresponds to the second-order nonlinear interaction of fields resonant in the two modes, and suggests an application. In an integrated optical circuit, detection of this second-order radiation using narrow band filters would provide a weak, non-destructive means of monitoring the joint occupation state of the microcavity, providing a logical AND gate operation. Although this functionality is demonstrated here in the case where a single short pulse is used to simultaneously populate the two modes, the sum-frequency signature would also occur if the modes were populated by independent sources.
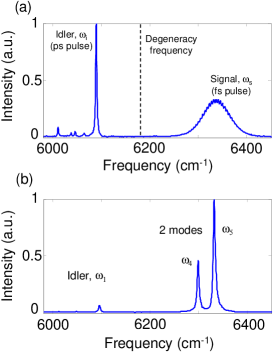
To demonstrate the conditional mode monitoring operation, we simultaneously irradiate the cavity with short, resonant pulses (as above) and a second non-resonant excitation beam consisting of longer, picosecond pulses tuned far off resonance with the cavity modes. This two-color source is readily available from the unfiltered “signal” beam output of the OPO when it is tuned near the degeneracy point (where both signal and idler frequencies are close to half the pump frequency). An example of this unfiltered spectrum when the signal is tuned to 6335 cm-1 is shown in Figure 3(a). The short OPO signal pulses are accompanied by relatively long (a few ps) OPO idler pulses. The idler pulses in this spectrum are dominated by a single spectral feature at cm-1, but there are several smaller intensity peaks at lower frequency which are also revealed in the second-order nonlinear processes discussed below. The resonant scattering spectrum from the two-mode microcavity studied in Fig. 2, when excited by the source of Fig. 3(a), is shown in Fig. 3(b). The resonant enhancement of the mode features is evident in comparison to the non-resonantly scattered idler.
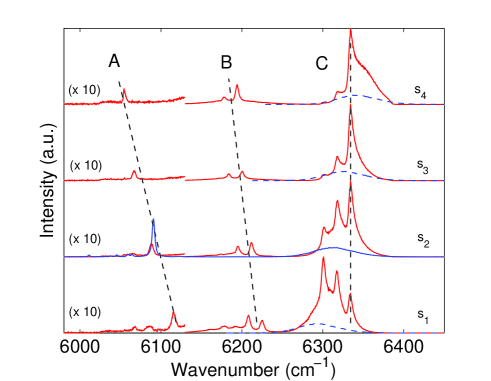
We now use this spectrum to explore the scheme shown in Fig. 1. The off-resonant ps pulse from the idler plays the role of , while the two modes are associated with and . Figure 4 shows a series of four second-order spectra from the microcavity supporting the quasi-localized modes discussed in Fig. 2(b) irradiated by the two-color source. The OPO is tuned to four different values of the center wavelength to acquire the spectra, which show three principal groups of features that are marked by lines A, B, and C to guide the eye. Feature A and the broad background in group C (the fit of which is plotted separately as a dashed blue line), are due to non-resonant second-harmonic generation of the ps and fs features, respectively, in the excitation spectra.
The three sharp features in group C that do not shift, and the two sharp features in group B that shift at half the rate of the excitation beam(s), are specific to the microcavity modes. They all arise from second-order processes involving the fields “trapped” in at least one of the modes. The three (fixed) peaks in group C correspond to the mode SHG (, ) and SFG () features, as in Figure 2. The features in group B are then easily understood to result from the second-order radiation from the two field distributions trapped in the microcavity modes respectively interacting with the ps pulses that irradiate the cavity during the ring-down to produce peaks at and . To understand the difference in the shift rate between features A and B, consider a ps pulse at interacting with a microcavity mode at . When the ps pulse is tuned from to , the second-order feature A shifts from 2 to , which is a shift of , whereas feature B shifts from to , a shift of just .
The lifetime of each cavity mode is about 1 ps, and so the pulsed excitation probes the impulse response of the cavity (i.e. there is minimal local field enhancement). The coupling efficiency into the cavity of the 60 W average power resonant excitation beam is Banaee et al. (2007); therefore, accounting for the 80 MHz repetition rate of the OPO, approximately photons are resonantly coupled into the cavity with each pulse. It is useful to consider what equivalent, critically-coupled cw-excitation or quasi-cw-excitation would create mode populations sufficient to yield an equivalent nonlinear response. In the cw limit, the local field intensity in the cavity is enhanced by a factor of . Assuming the cw-beam is coupled into the cavity from a 600 nm 200 nm single-mode ridge waveguide, the same nonlinear response could be achieved by a cw power of about 20 W.
The processes illustrated here demonstrate that the fields stored in microcavity modes can be nonlinearly mixed with non-resonant signals to produce sum-frequency radiation. If the non-resonant fields were generated from light previously stored in a different microcavity, as in the schematic of Fig. 1, this principle could be used to conditionally generate information at new frequencies which depend on the joint occupation state of two different microcavities.
Acknowledgements
The authors wish to acknowledge the financial support of the Natural Sciences and Engineering Research Council of Canada, the Canadian Institute for Advanced Research, the Canadian Foundation for Innovation, and the Canadian Institute for Photonic Innovations.
References
- Tanabe et al. (2007) T. Tanabe, M. Notomi, E. Kuramochi, A. Shinya, and H. Taniyama, Nature Photon. 1, 49 (2007).
- Takahashi et al. (2007) Y. Takahashi, H. Hagino, Y. Tanaka, B.-S. Song, T. Asano, and S. Noda, Opt. Express 15, 17206 (2007).
- Notomi et al. (2008) M. Notomi, E. Kuramochi, and T. Tanabe, Nature Photon. 2, 741 (2008).
- Fan et al. (1998) S. Fan, P. R. Villeneuve, J. D. Joannopoulos, and H. A. Haus, Phys. Rev. Lett. 80, 960 (1998).
- Soljačić and Joannopoulos (2004) M. Soljačić and J. D. Joannopoulos, Nature Materials 3, 211 (2004).
- Turchette et al. (1995) Q. A. Turchette, C. J. Hood, W. Lange, H. Mabuchi, and H. J. Kimble, Phys. Rev. Lett. 75, 4710 (1995).
- Cowan and Young (2003) A. R. Cowan and J. F. Young, Phys. Rev. E 68, 046606 (2003).
- Tanabe et al. (2005) T. Tanabe, M. Notomi, S. Mitsugi, A. Shinya, and E. Kuramochi, Appl. Phys. Lett. 87, 151112 (2005).
- Barclay et al. (2005) P. E. Barclay, K. Srinivasan, and O. Painter, Opt. Express 13, 801 (2005).
- Fushman et al. (2007) I. Fushman, E. Waks, D. Englund, N. Stoltz, P. Petroff, and J. Vučković, Appl. Phys. Lett. 90, 091118 (2007).
- Almeida et al. (2004) V. R. Almeida, C. A. Barrios, R. R. Panepucci, and M. Lipson, Nature 431, 1081 (2004).
- Tanaka et al. (2007) Y. Tanaka, J. Upham, T. Nagashima, T. Sugiya, T. Asano, and S. Noda, Nature Mat. 6, 862 (2007).
- McCutcheon et al. (2007a) M. W. McCutcheon, A. G. Pattantyus-Abraham, G. W. Rieger, and J. F. Young, Opt. Express 15, 11472 (2007a).
- Tanabe et al. (2009) T. Tanabe, M. Notomi, H. Taniyama, and E. Kuramochi, Phys. Rev. Lett. 102, 043907 (2009).
- Preble et al. (2007) S. F. Preble, Q. Xu, and M. Lipson, Nature Photon. 1, 293 (2007).
- Notomi et al. (2006) M. Notomi, H. Taniyama, S. Mitsugi, and E. Kuramochi, Phys. Rev. Lett. 97, 023903 (2006).
- Rodriguez et al. (2007) A. Rodriguez, M. Soljačić, J. D. Joannopoulos, and S. G. Johnson, Opt. Express 15, 7304 (2007).
- Burgess et al. (2009) I. B. Burgess, A. W. Rodriguez, M. W. McCutcheon, J. Bravo-Abad, Y. Zhang, S. G. Johnson, and M. Lončar, Opt. Express 17, 9241 (2009).
- McCutcheon et al. (2007b) M. W. McCutcheon, J. F. Young, G. W. Rieger, D. D. Dalacu, S. Frédérick, P. J. Poole, and R. L. Williams, Phys. Rev. B 76, 245104 (2007b).
- McCutcheon et al. (2005) M. W. McCutcheon, G. W. Rieger, I. W. Cheung, J. F. Young, D. Dalacu, S. Frédérick, P. J. Poole, G. C. Aers, and R. L. Williams, Appl. Phys. Lett. 87, 221110 (2005).
- Banaee et al. (2007) M. G. Banaee, A. G. Pattantyus-Abraham, M. W. McCutcheon, G. W. Rieger, and J. F. Young, Appl. Phys. Lett. 90, 193106 (2007).