A Direct Measurement of the IGM Opacity to H I Ionizing Photons
Abstract
We present a new method to directly measure the opacity from H I Lyman limit (LL) absorption along quasar sightlines by the intergalactic medium (IGM). The approach analyzes the average (“stacked”) spectrum of an ensemble of quasars at a common redshift to infer the mean free path to ionizing radiation. We apply this technique to 1800 quasars at drawn from the Sloan Digital Sky Survey (SDSS), giving the most precise measurements on at any redshift. From to 4.3, the opacity increases steadily as expected and is well parameterized by with and (proper distance). The relatively high values indicate that the incidence of systems which dominate evolves less strongly at than that of the Ly forest. We infer a mean free path three times higher than some previous estimates, a result which has important implications for the photo-ionization rate derived from the emissivity of star forming galaxies and quasars. Finally, our analysis reveals a previously unreported, systematic bias in the SDSS quasar sample related to the survey’s color targeting criteria. This bias potentially affects all IGM studies using the SDSS database.
Subject headings:
large-scale structure of universe — quasars: absorption lines — intergalactic medium1. Introduction
The observed high transmission of quasars at rest wavelengths blueward of H I Ly reveals that the intergalactic medium (IGM) is highly ionized (Gunn & Peterson, 1965). The presence of the Ly forest demands an intense, extragalactic ultraviolet background (EUVB) radiation field. The quasars themselves provide a significant fraction of the required ionizing flux, buoyed by the emission from more numerous yet fainter star-forming galaxies. Several recent studies have argued that the latter population dominates the EUVB at (Faucher-Giguère et al., 2008a; Cowie et al., 2009; Dall’Aglio et al., 2009), where the quasar population likely declines (e.g. Fan et al., 2004). These assertions, however, hinge on the opacity of the IGM to ionizing radiation via H I Lyman limit absorption () which directly impacts estimates of the EUVB measured from the integrated quasar and stellar ionizing emissivity.
Traditionally, has been estimated from the incidence of so-called Lyman limit systems (LLSs) via surveys of quasar spectroscopy (e.g. Lanzetta, 1991; Storrie-Lombardi et al., 1994; Péroux et al., 2003). Observationally, one can rather easily identify systems with large optical depths and the majority of these surveys have probed to this limit. The integrated opacity of the IGM, however, includes and is likely dominated by gas with , the so-called partial Lyman limit systems and Ly forest clouds. Systems with these H I column densities () are especially difficult to survey because the strong lines of the Lyman series (e.g. Ly, Ly) lie on the flat portion of the curve-of-growth and they exhibit only weak absorption at the Lyman limit. Therefore, current estimates of are based on an extrapolation/interpolation of the frequency of systems with and (Madau et al., 1999; Schirber & Bullock, 2003; Faucher-Giguere et al., 2009). Current constraints on span over a magnitude of uncertainty, especially at .
In this Letter, we introduce a new technique to estimate that avoids the traditional line-counting statistics of the IGM. We analyze the average rest-frame spectra of 1800 quasars drawn from the Sloan Digital Sky Survey, Data Release 7 (Abazajian et al., 2009). As an ensemble at a common redshift, these “stacked” spectra show the exponential drop in flux at Å from the integrated opacity of the IGM. We precisely evaluate in a series of small redshift intervals covering to explore redshift evolution. We adopt a cosmology with , , and and report proper lengths unless specified.
2. Methodology
The H I Lyman limit opacity of the IGM has traditionally been expressed as an effective optical depth estimated from the observationally constrained frequency distribution . An ionizing photon () emitted from a quasar with redshift will redshift to 1 Ryd at . The effective optical depth that this photon experiences by IGM Lyman limit opacity is then (cf. Meiksin & Madau, 1993):
| (1) | |||
where is the photoionization cross-section evaluated at the photon frequency. In practice, this approach is subject to large uncertainties because (1) is poorly constrained for systems with , (2) observational surveys rarely measure at the same epoch forcing interpolation and extrapolation; and (3) estimates of for the LLS may always be subject to large systematic uncertainty (Prochaska et al., 2009). This traditional approach may never yield a precise and robust estimate of .
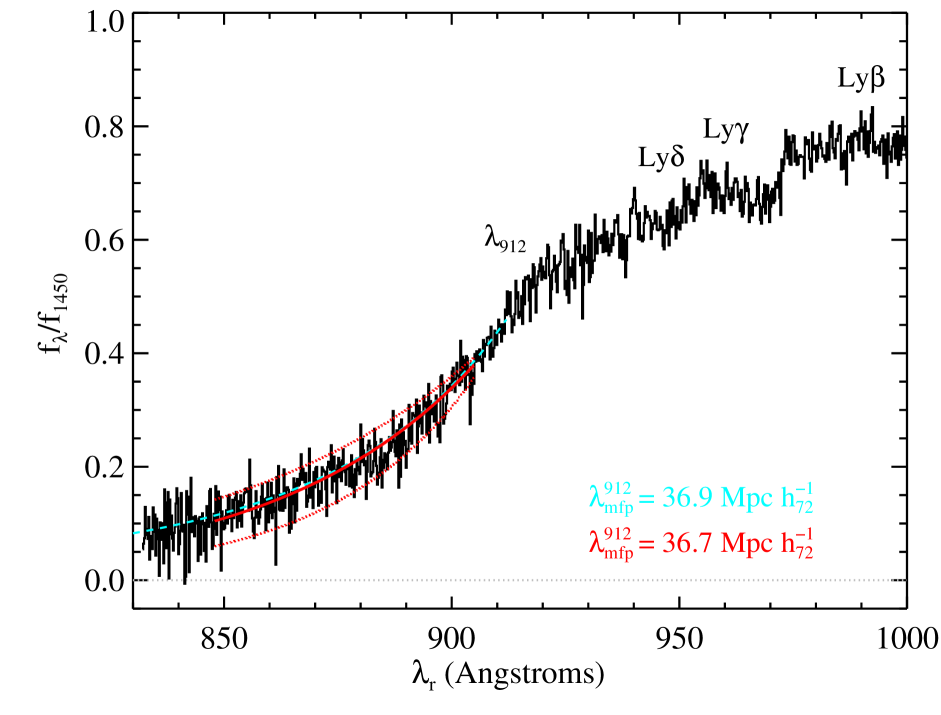
Our new approach is to directly measure through analysis of averaged ensembles of quasar spectra. In Figure 1, we present the stacked spectrum of 150 mock quasar spectra at . Each spectrum was given a unique emission redshift and SED111Quasar SEDs do not show strong emission features at Å (Telfer et al., 2002). (normalized at 1450Å), and then was blanketed with Lyman series and Lyman limit absorption from an assumed distribution (Dall’Aglio et al., 2008; Worseck & Prochaska, 2009). The spectra were degraded to the nominal spectral resolution of the SDSS spectrometer (FWHM=150km s-1) and Gaussian noise was added to give a distribution222The S/N and emission redshift distributions correspond to the third bin in the observational analysis that follows. of S/N values at Å. The data was then averaged without weighting.
Inspecting Figure 1, one identifies the effective opacity of the Ly forest at Å and corresponding decrements in the spectrum at Ly and Ly. One then observes a steep drop in the flux starting at Å due to the opacity of higher order Lyman series lines of optically thick absorbers (e.g. damped Ly systems). The continued decline at , however, is dominated by the continuum opacity of H I. At all wavelengths, the scatter in the stacked spectrum is due to small-scale variance in IGM absorption, not noise in the individual spectra.
Overplotted in Figure 1 is the flux model with evaluated from the input distribution (Equation 1) and , the flux at , estimated from the data. This is a good model of the stacked spectrum; even though the underlying average SED evolves as , the analysis is performed over too small a wavelength interval to note its evolution. The evaluation gives at corresponding to a proper mean free path at .
Now consider an alternate evaluation of which follows the standard definition of optical depth,
| (2) |
where the integral is evaluated to an arbitrary proper distance from the quasar. In an expanding universe, an ionizing photon emitted by the quasar will be attenuated by the Lyman limit opacity until it is redshifted to Ryd at . If the photon is not absorbed by IGM line opacity from gas at , it may be observed today at a wavelength . During the photon’s travel from to , the opacity evolves because of the decreasing frequency (redshift) and also from changes to the physical conditions of the universe (e.g. the expanding proper distance). We separate the frequency and radial dependencies in the opacity as follows,
| (3) |
where the frequency dependence related to is approximate. This treatment also ignores stimulated emission, i.e. it assumes is dominated by ‘clouds’ with .
In principle, one can adopt any radial dependence for . Expressing Equation 3 in redshift space, we have
| (4) |
With this functional form for the Lyman limit opacity, it is straightforward to integrate Equation 2 by adopting a Friedman-Walker cosmology where
| (5) |
At , the universe is matter dominated and we can express . Altogether, we find
| (6) |
In practice, we find that the analysis of a single stacked spectrum does not constrain the redshift evolution in . Therefore, we have simply parameterized by its value at , i.e., . The thin solid curve in Figure 1 shows the resulting flux model for for a best-fit value . The corresponding mean free path is in excellent agreement with the traditional evaluation. We stress that the analysis was performed without any consideration of the quasar SEDs nor any consideration of evolution in the Lyman series line-opacity. Although these contribute to the observed flux in the stacked spectrum, the exponential drop due to dominates over this and any other astrophysical aspect.
3. Results
Our new approach provides a tight constraint on the effective mean free path near the quasar emission redshift (at ). Because the stacked spectrum covers only several tenths in redshift below the Lyman limit, it imposes a very weak constraint on the redshift evolution of . Instead, one must evaluate the stacked spectrum of quasars at a range of emission redshifts.
We apply the methodology to 1800 quasar spectra drawn from the SDSS-DR7. We began with the vetted quasar list from our survey of Lyman limit systems (Prochaska et al., 2009) which avoids all purported quasars in the SDSS-DR7 that have erroneous redshift estimates or are not bona-fide quasars. We have also ignored all quasars with strong associated absorption in the C IV, N V, and/or O VI doublets (e.g. broad absorption line systems). We have not, however, removed quasars with evident Lyman limit absorption at . It is our goal to estimate the entire Lyman limit opacity that quasars experience, except for the influence of gas on parsec scales. Therefore, our estimates of include opacity from the quasar’s local galactic environment, i.e. its proximity region.
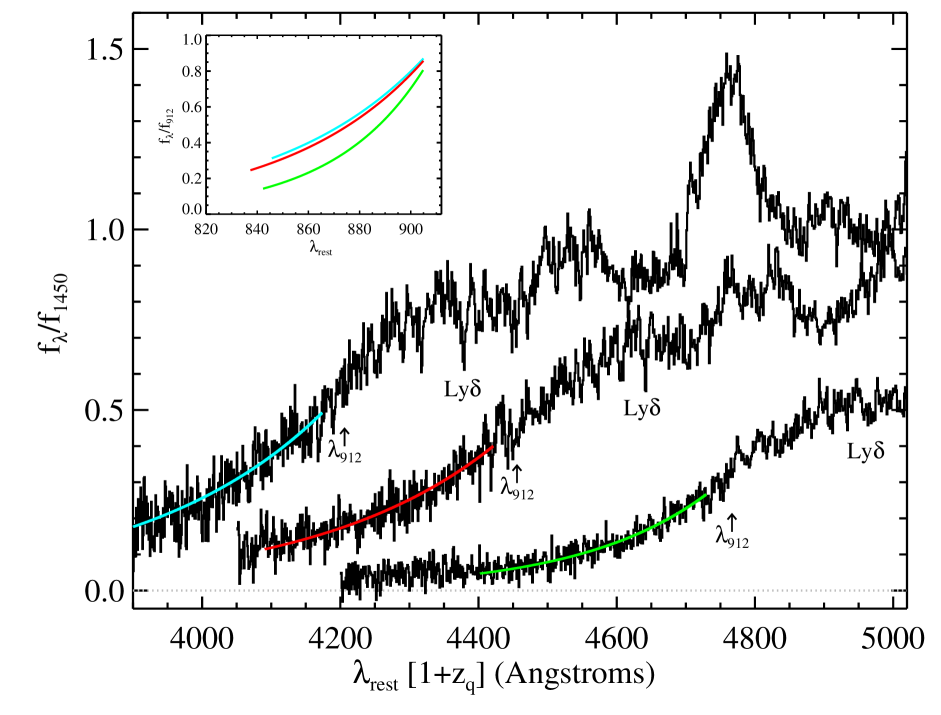
The sample was further limited to the following criteria: (1) to insure significant coverage of the Lyman limit in the SDSS spectra and minimize the likelihood that LLS bias the quasar target probability (but see below); (2) S/N at Å; (3) to insure that a stack of 150 quasars covers a redshift interval . Starting at , we constructed a series of bins of 150 quasars each to produce a stacked spectrum. Each quasar spectrum was normalized by the observed flux at Å (in a 20Å window) and shifted to its rest-frame (nearest pixel). The full ensemble was then averaged (without weighting) ignoring bad pixels. A sample of three of the stacked spectra are given in Figure 2.
As noted above, our analysis of includes contributions from the quasar’s proximity region. In general, this corresponds to or Å (e.g. Dall’Aglio et al., 2008). From the stacked spectrum, Figure 2 shows that the flux at the ‘edge’ of the proximity region (i.e. at Å) is times the flux at 912Å, giving . In the absence of the IGM beyond the proximity region, the flux would begin to recover shortward of 900Å as . It is evident, therefore, that opacity from the ‘true’ IGM dominates our analysis. Furthermore, we find that our analysis yields models that extrapolate well to 912Å suggesting the opacity of the proximity region follows the behavior of the general IGM. This is consistent with our finding that there is no strong differences in the incidence of LLS near quasars (Prochaska et al., 2009).
Using the model for (Equation 6), we have fitted the data to evaluate the opacity at in a series of redshift intervals, each containing 150 quasars. We minimized over rest-wavelength intervals starting at 905Å (to minimize bias from strong Lyman series absorption in the proximity zone of the quasar) and extending down in wavelength corresponding to the larger of 3900Å and . The scatter in the stacked spectrum was estimated locally in 21 pixel bins centered at each data point and presumed to be Gaussian. The flux at was estimated from the data but allowed to vary by 10% when minimizing . Because the observed scatter in the stacked spectrum is systematic (related to stochasticity in the IGM) and is not included in our model, one cannot estimate the uncertainty in from standard techniques. Instead, we performed a bootstrap analysis of 100 realizations of each stacked spectrum and estimated from the resulting distribution of values.
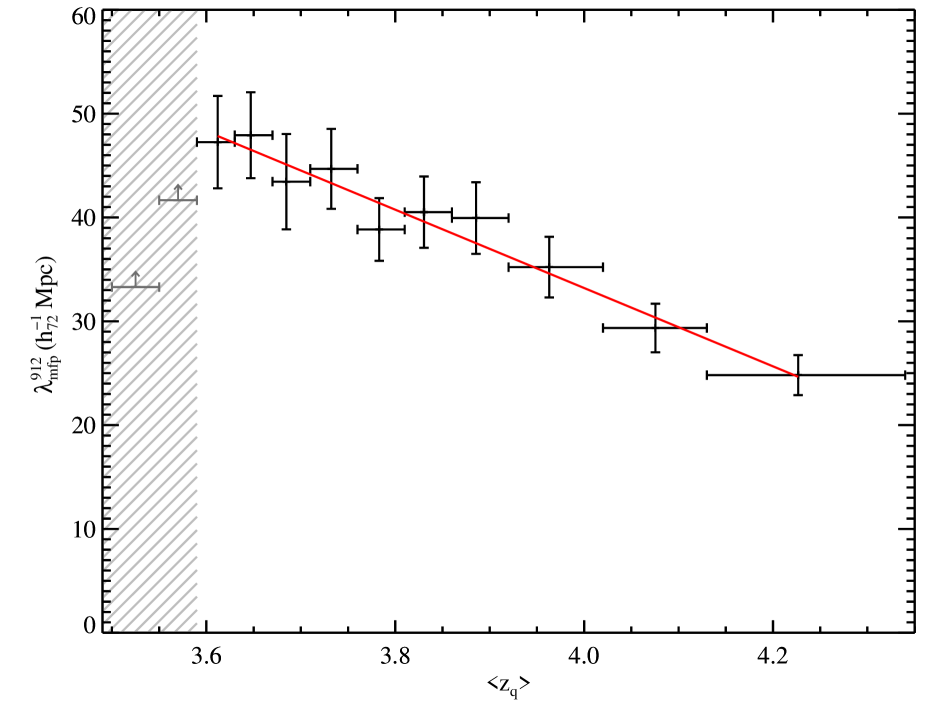
Figure 3 presents the evaluations of in terms of the mean free path (). The mean free path exhibits a peak (minimum in opacity) of nearly at and declines with increasing redshift. We have parameterized the redshift evolution in with a simple linear regression: . Restricting the analysis to , a minimization of this model to the binned evaluations of gives and .
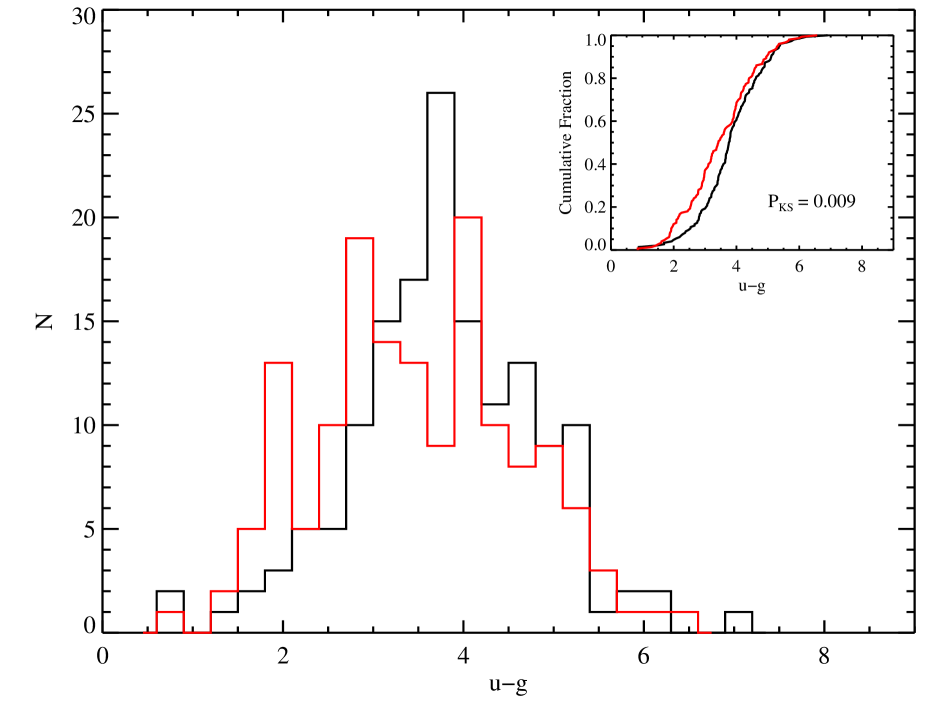
Formally, our analysis also indicated a rise in the opacity at , i.e. the lower limits in Figure 3. This runs contrary to all expectation and current understanding of the IGM. Initially, we suspected that this measurement indicated a systematic error in the SDSS spectra at the bluest wavelengths (e.g. Bernardi et al., 2003). To test this hypothesis, we examined the colors of the quasars in the first () and third () quasar bins. Figure 4 histograms the two distributions. The colors of the quasars are systematically redder than those at ; this is the exact opposite of what one predicts if the IGM were monotonically increasing in opacity with redshift. We conclude that the quasars at drawn from the SDSS are redder than the cohort at because of an elevated incidence of Lyman limit opacity, confirmed by analysis on the incidence of LLS (Prochaska et al., 2009).
We then explored whether this elevated opacity is related to observational bias in the SDSS quasar sample. We simulated the SDSS experiment by constructing mock quasar spectra at and with intrinsic SEDs having mean color of 0.57 mag and standard deviation of 0.19 mag. These spectra were blanketed with IGM absorption assuming a monotonically increasing opacity with redshift. After restricting the quasar sample according to the SDSS color-selection criteria (Richards et al., 2002), we found the cohort has systematically redder colors than the higher redshift sample. Similarly, we find a correspondingly higher opacity inferred from the stacked spectrum. Because of the targeting criteria, the cohort of quasars in the SDSS spectroscopic database are systematically biased against having which biases against sightlines without strong Lyman limit absorption. Our analysis indicates that the bias extends to , beyond which very few quasars are predicted to ever have such blue color (see Worseck & Prochaska, 2009, for further details). The results for are presented in Table 1.
| z | ||||
|---|---|---|---|---|
| (Å) | (Mpc-1) | (Mpc-1) | ||
| 3.59,3.63] | 3.61 | 846, 905] | 0.0209 | 0.0023 |
| 3.63,3.67] | 3.65 | 839, 905] | 0.0218 | 0.0021 |
| 3.67,3.71] | 3.68 | 834, 905] | 0.0224 | 0.0026 |
| 3.71,3.76] | 3.73 | 835, 905] | 0.0212 | 0.0020 |
| 3.76,3.81] | 3.78 | 836, 905] | 0.0257 | 0.0020 |
| 3.81,3.86] | 3.83 | 837, 905] | 0.0254 | 0.0024 |
| 3.86,3.92] | 3.89 | 837, 905] | 0.0243 | 0.0024 |
| 3.92,4.02] | 3.96 | 839, 905] | 0.0292 | 0.0026 |
| 4.02,4.13] | 4.08 | 840, 905] | 0.0341 | 0.0033 |
| 4.13,4.34] | 4.23 | 842, 905] | 0.0403 | 0.0036 |
Note. — Because of the color-criteria bias discussed in the paper, we caution that the values for the first few bins may systematically underestimate by . All wavelengths are in the quasar rest-frame and all distances are proper. The assumed cosmology has .
4. Discussion
Our new technique provides the most precise measurements on the IGM opacity to H I ionizing radiation at any redshift. Previous estimates of were limited by large uncertainties in the frequency distribution, especially the incidence of systems with (Madau et al., 1999; Schirber & Bullock, 2003; Miralda-Escudé, 2003; Meiksin & White, 2004; Faucher-Giguère et al., 2008a). Our results indicate that systems dominating at must evolve more slowly than the Ly forest. In turn, we infer a flattening in the H I frequency distribution between (Petitjean et al., 1993; O’Meara et al., 2007). We provide a full discussion on the implications for in Prochaska et al. (2009).
Our analysis also gives the first direct description of the evolution in , albeit over a small redshift interval. Our results are well parameterized by a linear decrease in but can also be described by a power-law with . These values are consistent with the observed evolution in the incidence of LLS (Prochaska et al., 2009).
Our results refine recent inferences (e.g. Faucher-Giguère et al., 2008a; Dall’Aglio et al., 2009) that galaxies contribute significantly to the EUVB at . We assume the photoionization rate at inferred from the effective Ly opacity of the IGM (; Faucher-Giguère et al., 2008b). Comparing this value against the photoionization rate inferred from quasars using an emissivity (comoving; Hopkins et al., 2007; Bongiorno et al., 2007) and adopting our estimate of at , we find . This suggests a modest but non-negligible contribution from galaxies to the EUVB at this redshift. The systematic uncertainties in and are sufficiently large that one could recover =, but would overpredict at given the observed rise in and with decreasing redshift.
The results also revise at least some previous estimates of the EUVB. Haardt & Madau (1996) and their subsequent analyses (CUBA), for example, have adopted an approximately 3 times shorter mean free path at than our analysis reveals. This implies: (1) the normalization of their EUVB spectrum is several times too low; and (2) the EUVB spectrum is softer at energies of , Ryd. The latter point may help to reconcile apparent contradictions in the metal-line analysis of the IGM (Aguirre et al., 2008) without resorting to a large input from galaxies. Other analyses, however, have used estimates for that are in much better agreement with our results (e.g. Faucher-Giguere et al., 2009). An understanding of the full implications of our new constraints on awaits new calculations of the EUVB.
We identified a previously unreported systematic bias in the SDSS quasar spectroscopic sample against sightlines at that are ‘clear’ of optically thick absorbers. This bias has implications for a range of IGM analysis at including: (i) the paucity of sightlines for studying He II reionization (Worseck & Prochaska, 2009); (ii) an overestimate of the incidence of LLS (Prochaska et al., 2009) and damped Ly systems (Prochaska & Wolfe, 2009); and (iii) analysis of the Ly forest. We caution that all existing studies of the IGM at using the SDSS database should be reviewed in light of this systematic bias.
In future work, we analyze these same spectra to constrain the SEDs of quasars, infer the frequency distribution and Doppler parameters of gas with , and isolate the opacity of the IGM far from the quasar’s proximity region. The technique introduced here is easily extended to higher and lower redshifts by obtaining modest signal-to-noise (S/N), low-resolution spectroscopy of several hundred quasars. Future ground and space-based programs will precisely estimate from .
References
- Abazajian et al. (2009) Abazajian, K. N., et al. 2009, ApJS, 182, 543
- Aguirre et al. (2008) Aguirre, A., Dow-Hygelund, C., Schaye, J., & Theuns, T. 2008, ApJ, 689, 851
- Bernardi et al. (2003) Bernardi, M., et al. 2003, AJ, 125, 32
- Bongiorno et al. (2007) Bongiorno, A., et al. 2007, A&A, 472, 443
- Cowie et al. (2009) Cowie, L. L., Barger, A. J., & Trouille, L. 2009, ApJ, 692, 1476
- Dall’Aglio et al. (2008) Dall’Aglio, A., Wisotzki, L., & Worseck, G. 2008, A&A, 491, 465
- Dall’Aglio et al. (2009) —. 2009, ArXiv e-prints
- Fan et al. (2004) Fan, X., et al. 2004, AJ, 128, 515
- Faucher-Giguere et al. (2009) Faucher-Giguere, C. ., Lidz, A., Zaldarriaga, M., & Hernquist, L. 2009, ArXiv e-prints
- Faucher-Giguère et al. (2008a) Faucher-Giguère, C.-A., Lidz, A., Hernquist, L., & Zaldarriaga, M. 2008a, ApJ, 688, 85
- Faucher-Giguère et al. (2008b) Faucher-Giguère, C.-A., Prochaska, J. X., Lidz, A., Hernquist, L., & Zaldarriaga, M. 2008b, ApJ, 681, 831
- Gunn & Peterson (1965) Gunn, J. E., & Peterson, B. A. 1965, ApJ, 142, 1633
- Haardt & Madau (1996) Haardt, F., & Madau, P. 1996, ApJ, 461, 20
- Hopkins et al. (2007) Hopkins, P. F., Richards, G. T., & Hernquist, L. 2007, ApJ, 654, 731
- Lanzetta (1991) Lanzetta, K. M. 1991, ApJ, 375, 1
- Madau et al. (1999) Madau, P., Haardt, F., & Rees, M. J. 1999, ApJ, 514, 648
- Meiksin & Madau (1993) Meiksin, A., & Madau, P. 1993, ApJ, 412, 34
- Meiksin & White (2004) Meiksin, A., & White, M. 2004, MNRAS, 350, 1107
- Miralda-Escudé (2003) Miralda-Escudé, J. 2003, ApJ, 597, 66
- O’Meara et al. (2007) O’Meara, J. M., Prochaska, J. X., Burles, S., Prochter, G., Bernstein, R. A., & Burgess, K. M. 2007, ApJ, 656, 666
- Péroux et al. (2003) Péroux, C., McMahon, R. G., Storrie-Lombardi, L. J., & Irwin, M. J. 2003, MNRAS, 346, 1103
- Petitjean et al. (1993) Petitjean, P., Webb, J. K., Rauch, M., Carswell, R. F., & Lanzetta, K. 1993, MNRAS, 262, 499
- Prochaska et al. (2009) Prochaska, J. X., O’Meara, J. M., & Worseck, G. 2009, ApJ, submitted
- Prochaska & Wolfe (2009) Prochaska, J. X., & Wolfe, A. M. 2009, ApJ, 696, 1543
- Richards et al. (2002) Richards, G. T., et al. 2002, AJ, 123, 2945
- Schirber & Bullock (2003) Schirber, M., & Bullock, J. S. 2003, ApJ, 584, 110
- Storrie-Lombardi et al. (1994) Storrie-Lombardi, L. J., McMahon, R. G., Irwin, M. J., & Hazard, C. 1994, ApJ, 427, L13
- Telfer et al. (2002) Telfer, R. C., Zheng, W., Kriss, G. A., & Davidsen, A. F. 2002, ApJ, 565, 773
- Worseck & Prochaska (2009) Worseck, G., & Prochaska, J. 2009, ApJ, submitted