THREE NEW VARIABLE STARS IN INDUS
Alex Golovin1, Kirill Sokolovsky2,3, Natalia Virnina4,5, Javier López Santiago6
Main Astronomical Observatory of National Academy of
Sciences of Ukraine, Kiev, UKRAINE
golovin.alex@gmail.com
Max-Planck-Institute für
Radioastronomie, Bonn, GERMANY
ksokolov@mpifr-bonn.mpg.de
Astro Space Center of
Lebedev Physical Institute, Moscow,
RUSSIA
Odessa National University, Odessa, UKRAINE
virnina@gmail.com
Odessa National Maritime
University, Odessa, UKRAINE
Physic Faculty,
Universidad Complutense de Madrid, Madrid, SPAIN
jls@astrax.fis.ucm.es
| Abstract: We report the discovery of three new variable stars in Indus: USNO-B1.0 0311-0760061, USNO-B1.0 0309-0771315, and USNO-B1.0 0315-0775167. Light curves of 3712 stars in a field centered on the asynchronous polar CD Ind were obtained using a remotely controlled 150 mm telescope of Tzec Maun Observatory (Pingelly, Western Australia). The VaST software based on SExtractor package was used for semi-automatic search for variable stars. We suggest the following classification for the newly discovered variable stars: USNO-B1.0 0311-0760061 - RR Lyr-type, USNO-B1.0 0309-0771315 - W UMa-type, and USNO-B1.0 0315-0775167 - W UMa-type. |
1 Introduction
We observed a field centered on the asynchronous polar CD Ind (magnetic cataclysmic binary; see Schwope et al., 1997 and Ramsay et al., 1999) from December 21, 2008 until January 19, 2009 during 10 nights. Observations were done remotely at Tzec Maun Observatory (Pingelly, Western Australia) using the Takahashi TOA-150 apochromatic refractor (D=150 mm, F = 1095 mm) and SBIG STL-6303 CCD camera. All observations were conducted with the Bessel R filter. The field of view was . About 4 000 objects were detected on each frame. Our goal was to find new variable stars.
2 Data Analysis
To carry out the search for new variable stars we analyzed 108 CCD frames. The VaST software (developed by K. Sokolovsky and A. Lebedev, described by Kolesnikova et al., 2008) based on the SExtractor routine (Bertin & Arnouts, 1996) was used to obtain light curves of 3712 objects in the vicinity of CD Ind. The range was . To identify possible variable stars among them, we created a RMS-scatter versus mean magnitude diagram (see Fig. 1). The fainter objects tend to have larger scatter. Those objects, which bounce from this relation, (objects with RMS-scatter significantly larger than the typical value for their mean magnitude) are good candidates to be variable stars. False positives could also be caused if object is a galaxy or blended, either by the presence of close companion or image defect etc.

Three previously unknown variable stars were discovered on our CCD images. They are marked by squares on Fig. 1, where 1 corresponds to USNO-B1.0 0311-0760061, 2 - to USNO-B1.0 0309-0771315, and 3 - to USNO-B1.0 0315-0775167.
The instrumental magnitudes were scaled to with the reference star USNO-B1.0 0313-0766011 (). In USNO-B1.0 catalog it has magnitudes and . All coordinates in this paper were taken from the USNO-B1.0 catalog (Monet et al., 2003).
The light curves of these newly discovered variable stars were searched for periodic variation of brightness using the “Period04” package, developed by Patrick Lenz (Lenz & Breger, 2005). A discrete Fourier transform (DFT) algorithm was used for the statistical analysis. Notably, dates are heliocentrically corrected. The average zero point (object mean magnitude) was subtracted to prevent the appearance of spurious features on a periodogram centered at frequency 0.0. We calculated a periodogram with frequency range from 0 to 50 cycles per day () and steps of 0.00172 .
We also looked for X-ray counterparts of these three stars. Unfortunately, no XMM-Newton or Chandra observations (either publicly released or not) have included this field. Similarly, no ROSAT/HRI observation was pointed in the direction of our targets. The stars were not detected in the ROSAT All Sky Survey, which is complete down to 0.03 cnt/s. Thus, we assume a maximum X-ray flux in the ROSAT/PSPC energy band (0.1-2.4 keV) of erg s-1 cm-2 (for radiation spectrum of optically thin plasma with a mean temperature keV = 5.8 K).
3 Notes on Individual Objects
3.1 USNO-B1.0 0311-0760061
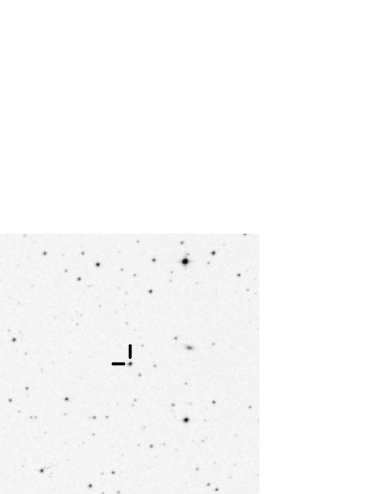
USNO-B1.0 0311-0760061 (= GSC 08805-00255, , ) displays variability with a mean level of brightness of . Fig. 2 shows DSS image (POSS2/UKSTU Red plate, hereafter) of the vicinity of this star. North is up, east is left.
The object is listed in the UCAC2 Catalogue (Zacharias et al., 2003, 2004) with proper motion values of mas/yr and mas/yr (mas/yr - milli-second of arc per year). PPMX Catalogue (Röser et al., 2008a; Röser et al., 2008b) gives values of mas/yr and mas/yr.
The dominant frequency in the DFT-periodogram implies a period of (Fig. 3a).


The following ephemeris were used for the phase plot (Fig. 3b):
The number of significant digits in the ephemeris reflects an estimated precision. Time in ephemeris hereinafter is UTC.
Based on the light curve, we classify this object as an RRC-type pulsating star. Rising time (M-m; time elapsed from minimum to the nearest further maximum) estimated to be (expressed in percentage of the period).
The pulsation period of the star lies just outside the boundary of delta Scuti-type variables. According to Poretti (2001) virtually all pulsating variables with are RRC-type. The smooth, sinusoidal shape of the light curve also helps to avoid confusion with High Amplitude -Scuti stars (HADS) which usually have asymmetric light curves with a steep ascending branch and a sharp maximum.
3.2 USNO-B1.0 0309-0771315
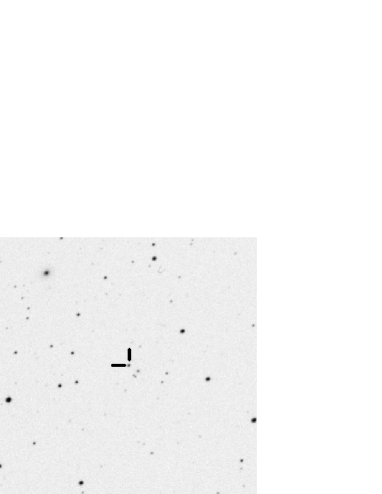
USNO-B1.0 0309-0771315 () is the next star with previously unknown variability. Fig. 4 shows the DSS image of its vicinity with the variable being marked. The proper motion of this object is mas/yr, mas/yr (Zacharias et al., 2003).
The mean brightness of the star is , with an amplitude variations of . Our periodogram analysis (Fig. 5a) revealed the dominant frequency to be (), although a twice longer period could not be excluded because of insufficient photometric coverage, so we folded our data with and (Fig. 5b, 5c). Most probably, the represented light curve could be explained if this star is a W UMa-type eclipsing binary. Ephemeris (with ) are:
3.3 USNO-B1.0 0315-0775167
USNO-B1.0 0315-0775167 () shows variability, with a mean level of brightness of in R-band.
Fig. 6 shows DSS image of the USNO-B1.0 0315-0775167 vicinity with the variable star being marked.
Periodogram analysis (Fig. 7a) revealed a dominant peak at a frequency . As in the case of USNO-B1.0 0309-0771315, we assumed to be the real period of the system (Fig. 7b, 7c). From the inspection of the light curve we suspect this star is a W UMa-type eclipsing binary, although further observations are required. Ephemeris (with ) are:
The light curve of USNO-B1.0 0315-0775167 (Fig. 7c) has a large scatter at the maximum which follows primary minimum compared to the maximum which follows secondary minimum. This is, most probably, an instrumental effect. However, since the exact nature of this effect is not clear, intrinsic stellar variability can not be completely discarded.
It is sometimes difficult to distinguish RRC-type variables from EW-type eclipsing binaries using only light curves since both types have nearly symmetrical light curves and comparable periods. However after close visual inspection of light curves, it is often possible to distinguish between them using the following features:
-
•
minima of EW-type variables are usually slightly sharper than maxima;
-
•
EW-type binaries may have minima of slightly different depth;
-
•
EW-type binaries may have slightly different brightness at maximum light before and after the primary minimum (O’Connel effect);
-
•
RRC-type variables may have slightly asymmetric light curves with the ascending branch a little steeper then descending branch.
Bearing all these features in mind, it is possible to distinguish between RRC- and EW-type variables using an accurate light curve.
Sometimes it is also possible to use color information to distinguish between RR Lyrae variables which are A-F type giants and W Ursae Majoris variables which usually have spectral types later then F.
We analyzed 2MASS data (JHK magnitudes with errors and Julian date of observation) of the studied objects. Last column in table 1 shows spectral type, estimated from JHK colour indexes according to Bessell & Brett (1988).
The Two Micron All-Sky Survey (2MASS) is a single-epoch survey so we have only one data point in each color. However, the good thing about the 2MASS is that JHK colors are measured truly simultaneously using a beam splitter, due to that fact the 2MASS colors are not affected by the variability. We neglect the small color change which may be a function of the variability phase because we are interested only in rough spectral classification, and, anyway, only rough spectral classification is possible from the broad-band photometry.
| Object | JD | Sp | ||||||
|---|---|---|---|---|---|---|---|---|
| 2MASS 21113531-5850146 | 13.702 | 0.026 | 13.632 | 0.041 | 13.485 | 0.048 | 2451490.5454 | |
| 2MASS 21162028-5901569 | 14.307 | 0.041 | 13.980 | 0.058 | 13.983 | 0.060 | 2451490.5730 | |
| 2MASS 21202644-5825020 | 15.199 | 0.052 | 14.826 | 0.077 | 15.115 | 0.133 | 2451490.5823 |
| Object | P | (UTC) | Type | ||||
|---|---|---|---|---|---|---|---|
| USNO-B1.0 0311-0760061 | 2454823.1005 | RRC | |||||
| USNO-B1.0 0309-0771315 | 2454823.0551 | EW: | |||||
| USNO-B1.0 0315-0775167 | 2454823.1042 | EW: |


.
4 Conclusions
We examined light curves of 3712 objects in the field centered on CD Ind and discovered three new variable stars. Two of them are most probably W UMa-type eclipsing binaries (EW), and the other one is most probably an RR Lyr-type (RRC) star. We show that RMS-scatter vs. Magnitude diagram is a useful tool to discover new variable stars.
Table 2 summarizes parameters of discovered variable stars, such as USNO-B1.0 designation, equatorial coordinates, brightness in maximum and minimum, period (in fractions of days), zero-epoch (, time of maximum for RRC star and time of minimum for EW stars) and GCVS type of variability.
Acknowledgments
This research is based on data collected with the Tzec Maun Observatory, operated by the Tzec Maun Foundation. Special thanks to Ron Wodaski (director of the observatory) and Donna Brown-Wodaski (director of the Tzec Maun Foundation). The authors are thankful to Leonid Elenin (“Astrogalaxy” team leader) for making these observations possible. JLS acknowledges financial support by the ASTROCAM project S-0505/ESP/000237. This work is partially supported by the Russian-Ukrainian grant F28.2/081 of FFI.
We would like to thank Alexander Pushkarev, Elena Pavlenko, Lyudmila Pakuliak, Tatyana Sergeeva, Mislav Balokovic and Yuliana Kuznyetsova for reviewing this manuscript. Special thanks to Aaron Price and David Trethewey for their help in preparing this paper.
This publication has made use of the Aladin interactive sky atlas, operated at CDS, Strasbourg, France and the International Variable Star Index (VSX) operated by the AAVSO. K. Sokolovsky was supported by the International Max Planck Research School (IMPRS) for Astronomy and Astrophysics at the universities of Bonn and Cologne. This research has made use of NASA’s Astrophysics Data System. This research has made use of data products from the Two Micron All Sky Survey, which is a joint project of the University of Massachusetts and the Infrared Processing and Analysis Center/California Institute of Technology, funded by the National Aeronautics and Space Administration and the National Science Foundation.
References
- Bertin & Arnouts (1996) Bertin E., Arnouts S., 1996, A&AS, 117, 393
- Bessell & Brett (1988) Bessell M. S., Brett J. M., 1988, PASP, 100, 1134
- Kolesnikova et al. (2008) Kolesnikova, D. M., Sat, L. A., Sokolovsky, K. V., Antipin, S. V., & Samus, N. N. 2008, Acta Astronomica, 58, 279
- Lenz & Breger (2005) Lenz, P., & Breger, M. 2005, Communications in Asteroseismology, 146, 53
- Monet et al. (2003) Monet D. G., et al., 2003, AJ, 125, 984
- Poretti (2001) Poretti E., 2001, A&A, 371, 986
- Ramsay et al. (1999) Ramsay G., Buckley D. A. H., Cropper M., Harrop-Allin M. K., 1999, MNRAS, 303, 96
- Röser et al. (2008a) Röser S., Schilbach E., Schwan H., Kharchenko N. V., Piskunov A. E., Scholz R.-D., 2008, yCat, 1312, 0
- Röser et al. (2008b) Röser S., Schilbach E., Schwan H., Kharchenko N. V., Piskunov A. E., Scholz R.-D., 2008, A&A, 488, 401
- Schwope et al. (1997) Schwope A. D., Buckley D. A. H., O’Donoghue D., Hasinger G., Truemper J., Voges W., 1997, A&A, 326, 195
- Zacharias et al. (2003) Zacharias N., Urban S. E., Zacharias M. I., Wycoff G. L., Hall D. M., Germain M. E., Holdenried E. R., Winter L., 2003, yCat, 1289, 0
- Zacharias et al. (2004) Zacharias N., Urban S. E., Zacharias M. I., Wycoff G. L., Hall D. M., Monet D. G., Rafferty T. J., 2004, AJ, 127, 3043