Influence of gravitational microlensing on broad absorption lines of QSOs: The case of the Fe K line
Abstract
Here we give a brief overview of some investigations of the gravitational microlensing influence on broad absorption spectral lines of lensed QSOs. Especially, we consider the microlensing influence on the Fe K broad absorption lines using a model of an accretion disk covered by an absorption region. Gravitational microlensing is modeled by ray shooting method which enables us to obtain realistic microlensing patterns. We obtain that microlensing can affect both emission and absorption component of line that depends on dimensions on emission and absorption line regions. Here we give detailed analysis of emission and absorption line shape variations due to gravitational microlensing.
keywords:
quasars; active or peculiar galaxies, objects, and systems , gravitational lenses and luminous arcs , black holes , accretion and accretion disks , X-ray absorption spectraPACS:
98.54.-h , 98.62.Sb , 97.60.Lf , 97.10.Gz , 78.70.Dm1 Introduction
Around 10% of type I (broad emission line) Active Galactic Nuclei (AGN) show gas outflowing from their centers (Reichard et al., 2003) with velocities 103-4 km s-1 (obtained from blue-shifted absorption lines). Such outflows are probably launched from the central engine of quasars (Elvis, 2000). The broad absorption lines (BALs) can be detected mainly in the UV part of spectra, but also in Fe K line (Chartas et al., 2004, 2007; Done et al., 2007).
Gravitational microlensing has proven to be a powerful probe of the structure at the heart of quasars and therefore microlensing of Broad Line Absorption Regions (BALR) can be used to study the BALR structure (see e.g. Lewis and Belle, 1998; Chelouche, 2003; Lewis and Ibata, 2003; Chelouche, 2005, etc.).
The X-ray emission of AGN could be significantly absorbed by an outflowing wind, especially in the case of so-called Low Ionization Broad Absorption Line (LoBAL) quasars. Presence of such X-ray absorbers is confirmed in gravitationally lensed LoBAL quasar H1413+117 (Cloverleaf) at z = 2.56 (Chartas et al., 2007). Chartas et al. (2007) found that spectra of this quasar show emission features redward of the Fe K line rest-frame energy and broad absorption features blueward of this energy. The line is only significant in the brighter image and a microlensing event could explain its energy-dependent magnification. A cluster of galaxies at redshift contributes to the lensing of this system, but the absorption from the lens does not have any significant effect on spectral properties of H1413+117 while, at the same time, its intrinsic absorption is much larger and it could significantly affect the X-ray emission of this quasar (Chartas et al., 2004).
In several previous papers (Popović et al., 2001, 2003; Popović et al., 2006a, b; , 2007, 2008; Jovanović and Popović, 2009) we have shown that the effect of strong gravitational lensing can have influence on the intensity and shape of Fe K line. Consequently, this effect can be used as a probe for the structure of the innermost part of lensed quasars.
The focus of this work is to study how much the combined influence of intrinsic absorption and gravitational microlensing could change the Fe K spectral line profile, emitted from X-ray emitting region of LoBAL QSOs. The paper is organized as following: in §2 we describe how to model the X-ray emission of accretion disk of QSOs, in §3 and 4 the combined influence of intrinsic absorption and gravitational microlensing on this emission is given, in §5 we describe the adopted parameters of X-ray emitting and absorption regions, and also those which are used for generating the microlensing pattern for image of H1413+117. In §6 we present the main results of our numerical simulations and finally in §7 we outline our conclusions.
2 Modeling the X-ray emission of accretion disk
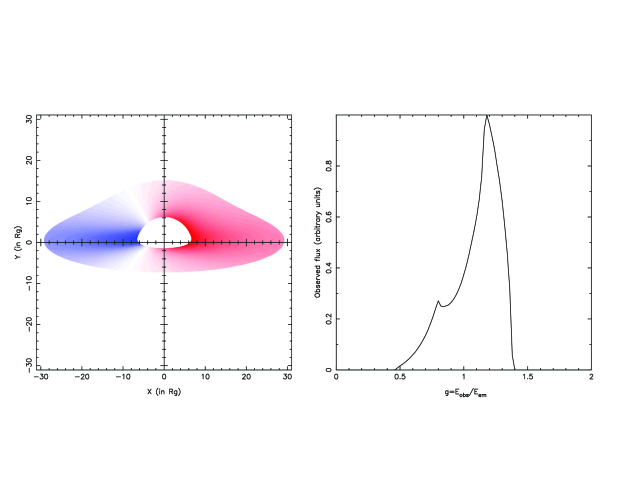
The X-ray radiation of AGN is originating from the innermost part of the accretion disk and the shape of the most prominent spectral line in this range, Fe K, strongly depends on emissivity law of the disk. It is usually accepted that surface emissivity of the disk varies with radius as a power law: where is emissivity constant and is emissivity index. We modeled the emission of an optically thick and geometrically thin accretion disk around a supermassive black hole (SMBH) using numerical simulations based on a ray-tracing method in Kerr metric, taking into account only photon trajectories reaching the observer’s sky plane in the infinity. In this method one divides the image of the disk on the observer’s sky into a number of small elements (pixels). For each pixel, the photon trajectory is traced backward from the observer by following the geodesics in Kerr space-time, until it crosses the plane of the disk. Then, flux density of radiation emitted by the disk at that point, as well as redshift factor of the photon are calculated. In that way, one can obtain color images of the accretion disk (see Fig. 1, left) which a distant observer would see by a high resolution telescope. The simulated line profiles can be calculated taking into account the intensities and received photon energies of all pixels of the corresponding disk image (see Fig. 1, right). For more details about this method see e.g. Jovanović and Popović (2009) and references therein.
3 A simple model of Fe K absorption region
There are different models of the X-ray absorbing/obscuring regions, like absorbing medium comprised of cold absorbing cloudlets by Fuerst and Wu (2004), but here we will focus on the model given by (2007). In this model, absorption region is considered to be composed of a number of individual spherical absorbing clouds with the same small radii, scattered in space so that projections of their centers to the observer’s sky plane have bivariate normal distribution . Here, and
where and are the means of and , and are their standard deviations and is the correlation between them. We use the following values of these parameters in our numerical simulations: , , and , where is the center and is the radius of projection of entire absorption region.
The absorption coefficient for every spherical cloud in the absorption region is given by (, 2007):
| (1) |
where absorption intensity coefficient describes the distribution of absorption over the whole region, is the central energy of absorption and is the width of absorption band (velocity dispersion).
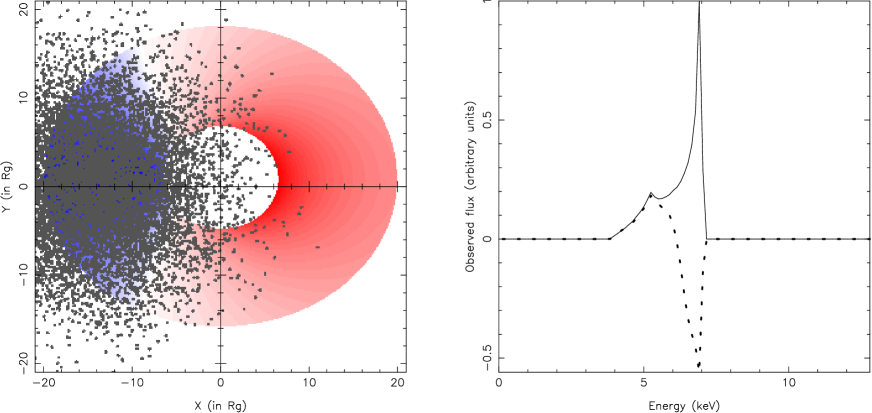
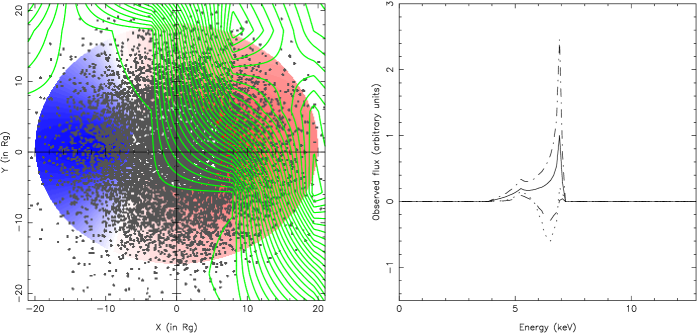
To compare (qualitatively) our simulated profiles (Fig. 2, right) with observations, let us recall the results obtained by Done et al. (2007). They found an evidence for so-called P Cygni profile of the Fe K line in narrow line Seyfert 1 galaxies. According to these authors, complex X-ray spectra of these objects show strong ”soft excess” below 2 keV and a sharp drop at keV which can be explained either by reflection or by absorption from relativistic, partially ionized material close to the black hole. They showed that a sharp feature at keV results from absorption/scattering/emission of iron K line in the wind. In the case of 1H 0707-495, this absorption feature can be satisfactorily fitted by the P Cygni profile, where emission component at keV is followed by a strong absorption component at keV (Done et al., 2007).
In our model, we are able to change density of absorbers, size of absorption region (or covering fraction of disk emission) and also position of absorption region in respect to disk center. As an example, in Fig. 2 (right) we show a deformation of the Fe K line profile due to absorption region that covers approaching side of the disk (Fig. 2 left). As one can see from Fig. 2, in that case a P Cygni profile of the Fe K is present, having an emission component at 5 keV and absorption one at 7 keV, as it was reported by Done et al. (2007).
4 Gravitational microlensing by a random star field in the lens plane
The most realistic approximation for gravitational microlensing amplification is so-called quadrupole microlens. This model is applied to obtain a spatial distribution of magnifications in the source plane (where an accretion disk of AGN is located), produced by a random star field placed in the lens plane (see e.g. Wambsganss, 1992). Such spatial distribution of magnifications is called microlensing map, microlensing pattern or caustic network. If we consider a set of compact objects (e.g. stars) which are characterized by their positions and their masses , then normalized lens equation is given by (Jovanović and Popović, 2009):
| (2) |
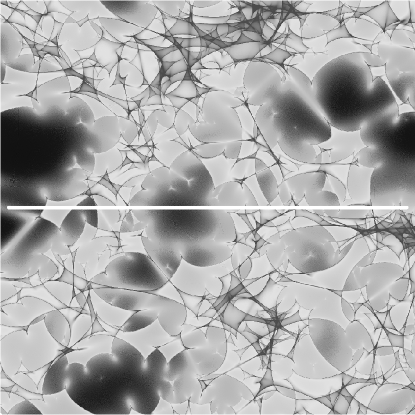
where and are normalized image and source positions, respectively. The sum describes light deflection by the stars and the last term is a quadrupole contribution from galaxy containing the stars, where is a smooth surface mass density and is an external shear. The total surface mass density or convergence can be written as , where represents the contribution from the compact microlenses. The corresponding microlensing map is then defined by two parameters: the convergence - , and the shear due to the external mass - . For some specific microlensing event one can model the corresponding magnification map using numerical simulations based on ray-shooting techniques (see e.g. Popović et al., 2006b; , 2008; Jovanović and Popović, 2009, and references therein), in which the rays are shot from the observer to the source, through a randomly generated star field in the lens plane. These light rays are then collected in pixels in the source plane, and the number of rays in one pixel is proportional to the magnification due to microlensing at this point in the source plane. As an example, the magnification map of Cloverleaf quasar image is shown in Fig. 3.
5 Combined influence of intrinsic absorption and gravitational microlensing on the Fe K emission of QSOs
To obtain modeled line profiles, it is necessary to define a number of parameters which describe the line emitting region in the disk, such as constraints for its size, the disk inclination angle and the angular momentum of the central BH. For that purpose we usually use the results from studies of the observed Fe K line profiles in AGN, such as e.g. Nandra et al. (1997, 2007). The inner radius of the disk cannot be smaller than the radius of the marginally stable orbit , that corresponds to (gravitational radius , where is the gravitational constant, is the mass of central BH, and is the speed of light) in Schwarzschild metric and to in the case of Kerr metric with angular momentum parameter . To select the outer radius of the disk, we take into account some recent investigations of the Fe K line profile showing that it should be emitted from the innermost part of the disk which outer radius is within several tens of Rg (see e.g. Popović et al., 2006a, and references therein). Therefore, in our numerical simulations we adopted the following disk parameters: inclination , inner and outer radii and , emissivity index and angular momentum of central BH (Schwarzschild metric).
In order to study the influence of intrinsic absorption of Cloverleaf quasar H1413+117 on its Fe K line profile, we modeled an X-ray absorption region using the following parameters: (and thus can be assumed as constant), central energy of absorption keV and velocity dispersion keV (that corresponds to random velocity of clouds of km/s). We assumed that the absorption region is located at the following positions: (i) , , (ii) , and (iii) , and that it consists of 10000 individual absorbing clouds.
Microlensing magnification pattern for the image of H1413+117 (see Fig. 3) with 16 Einstein Ring Radii () on a side (where ) is calculated using the following parameters: red shift of the lens: (Chartas et al., 2004), convergence , shear (Kayser et al., 1990) and the masses of individual deflectors (stars) . Microlensing time scales, which are necessary for obtaining the simulated light curves, are estimated from corresponding distance scales according to the formula (13) of (2008), in which is replaced by the distance from the center of accretion disk, assuming a flat cosmological model with and .
6 Results
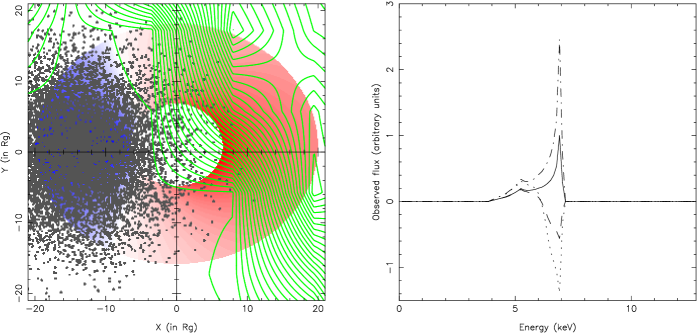
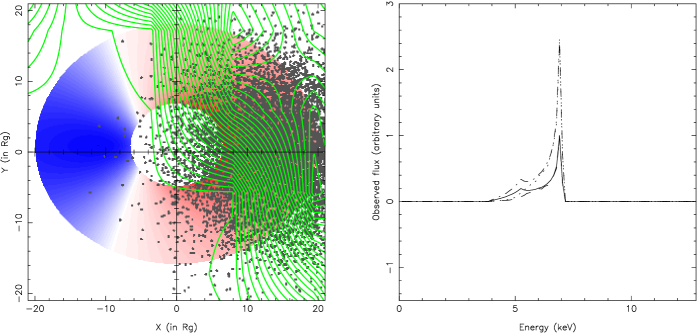
The results of numerical simulations of a relativistic accretion disk partially covered by an X-ray absorption region where the Fe K line radiation is magnified due to gravitation microlensing are presented in Fig. 4 (left) for three different positions of absorption region with respect to the accretion disk center. In all three panels of Fig. 4, this system consisting of accretion disk and absorption region is located at the same position on the microlensing map of H1413+117 image . The corresponding comparisons between the unabsorbed, absorbed, magnified and combined absorbed-magnified Fe K spectral line profiles are given in Fig. 4 (right). As one can see from Fig. 4, when X-ray radiation from approaching side of the disk is significantly absorbed there is a very strong absorption component of the iron line and in such case the emission Fe K component looks redshifted at keV and is followed by a strong absorption component at keV, indicating the P Cygni profile of the iron line (see also Fig. 2).
Gravitational microlensing affects both components, but the magnification of absorption component is much stronger (see dotted line on the top panel of Fig. 4).
When the absorption region is located over the central part of the disk, it also causes the occurrence of P Cygni profile of the iron line, but in this case the intensity of absorption component is much smaller, even when we take into account magnification due to microlensing (see the middle panel of Fig. 4).
Finally, in the third case, when the absorption region is located over the receding side of the disk, the absorption component of the iron line is missing and the line profile is just slightly changed due to intrinsic absorption. In the combination with gravitational microlensing influence, it causes significant deformations of the Fe K line profile, but also without any indication for the absorption component of the iron line (see the bottom panel of Fig. 4).
The corresponding simulated light curves, produced when the system consisting of the accretion disk absorbed emission crosses over a magnification pattern along the horizontal path in Fig. 3, are given in Fig. 5.
The three panels in Fig. 5 show the simulated light curves for three different positions of absorption region across the accretion disk. We compared simulated light curves in the case when the pure Fe K emission is magnified (solid line) and when absorbed emission of the Fe K line is magnified (dashed line). As it can be seen from Fig. 5 there is a global correlation between these two light curves. The greatest difference between the two light curves is in the case when absorption region covers the central part of the disk and the smallest one is when it covers the receding side of the disk. Such behavior of the light curves is a consequence of different absorption rate of the iron line for three different positions of absorption region.


From Fig. 5 we can also estimate the frequency of so-called high magnification events (HMEs - asymmetric peaks in the light curves which depend not only on microlens parameters, but also on parameters of the X-ray emitting region), i.e. the number of such events per unit time. According to the obtained results, in the case of image of H1413+117 one can expect one such event approximately every 15 years, along the specified path. But, there are also areas in the microlensing map of H1413+117A with a significantly higher number of caustics (see e.g. top part of Fig. 3), and therefore a source transit over these regions would produce HMEs with much higher frequency. In principle, it can be expected that the majority of HMEs should be detected in X-ray light curves, less of them in UV and the smallest number in optical light curves (, 2008). (2008) found that the typical microlensing time scales for the X-ray band are on order of several months, while for the UV/optical bands they are on order of several years.
7 Conclusions
In order to study how much the combined influence of absorption and gravitational microlensing could change the Fe K spectral line profile, emitted from the X-ray emitting region of LoBAL QSOs we developed a simple model of the X-ray absorbing/obscuring region that could explain the observed P Cygni profile of the Fe K line recently observed by Done et al. (2007). We found that the model can reproduce P Cygni profile only if at least a part of approaching side of the disk is covered by absorbing material (see Fig. 2). In particular case of 1H 0707-495, the observed sharp drop at keV and emission at 5 keV can be explained by absorption from relativistic, partially ionized material close to the black hole that meanly cover the approaching side of the relativistic accretion disk.
It is interesting that the width and depth of the absorption component strongly depends on the projection of this region on the accretion disk.
On the other side, this model (absorbed emission of the accretion disk) has been used for simulation of gravitational microlensing of such system by a random star field in the lens plane. We estimated the magnification of the line flux and calculated the simulated light curves produced when such source crosses over the H1413+117A microlensing magnification map. Our results show that combined influence of absorption and gravitational microlensing could explain the observed variations of the Fe K line profile in the case of H1413+117 (emission features redward of the line rest-frame energy and broad absorption features blueward of this energy) reported by Chartas et al. (2004).
Note here, that we made a net of models for variations of the Fe K absorption of H1413+117A due to microlensing which can be used for comparison with observed variations. We hope that these results (and model) will be used in order to probe both, absorption region and accretion disk characteristics in lensed QSOs with Fe K absorption component.
Acknowledgements. This work is a part of the project (146002) ”Astrophysical Spectroscopy of Extragalactic Objects” supported by the Ministry of Science of Serbia.
References
- Chartas et al. (2004) Chartas, G., Eracleous, M., Agol, E., Gallagher, S.C. (2004) ApJ, 606, pp. 78-84.
- Chartas et al. (2007) Chartas, G., Eracleous, M., Dai, X., Agol, E., Gallagher, S. (2007) ApJ, 661, pp. 678-692.
- Chelouche (2003) Chelouche, D. (2003) ApJ, 596, p. L43.
- Chelouche (2005) Chelouche, D. (2005) ApJ, 629, p. 667.
- Done et al. (2007) Done, C., Sobolewska, M.A., Gierliński, M., Schurch, N.J. (2007) MNRAS, 374, p. L15.
- Elvis (2000) Elvis, M. (2000) ApJ, 545, p. 63.
- Fuerst and Wu (2004) Fuerst, S. V., Wu, K. (2004) A&A, 424, p. 733.
- (8) Jovanović, P., Popović, L.Č. (2007) AIP Conf. Proc., 938, p. 76.
- (9) Jovanović, P., Zakharov, A.F., Popović, L.Č., Petrović, T. (2008) MNRAS, 386, pp. 397-406.
- Jovanović and Popović (2009) Jovanović, P., Popović, L.Č. (2009) arXiv:0903.0978v1 [astro-ph.GA] (to appear as a chapter in the book ”Black Holes and Galaxy Formation” by Nova Science Publishers, Inc.
- Kayser et al. (1990) Kayser, R., Surdej, J., Condon, J.J., Kellermann, K.I., Magain, P., Remy, M., Smette, A (1990) ApJ, 364, pp. 15-22.
- Lewis and Belle (1998) Lewis, G.F., Belle, K.E. (1998) MNRAS, 297, p. 69.
- Lewis and Ibata (2003) Lewis, G.F., Ibata, R.A. (2003) MNRAS, 340, p. 562.
- Nandra et al. (1997) Nandra, K., George, I.M., Mushotzky, R.F., Turner, T.J., Yaqoob, T. (1997) ApJ, 477, p. 602.
- Nandra et al. (2007) Nandra, K., O’Neill, P.M., George, I.M., Reeves, J.N. (2007) MNRAS, 382, p. 194.
- Popović et al. (2001) Popović, L. Č., Mediavilla, E.G., Muñoz, J.A., Dimitrijević, M.S., Jovanovic, P. (2001) Serb. AJ, 164, p. 53.
- Popović et al. (2003) Popović, L.Č., Mediavilla, E.G., Jovanović, P., Muñoz, J.A. (2003) A&A, 398, p. 975.
- Popović et al. (2006a) Popović, L.Č., Jovanović, P., Mediavilla, E.G., Zakharov, A.F., Abajas, C., Muñoz, J.A., Chartas, G. (2006a) ApJ, 637, p. 620.
- Popović et al. (2006b) Popović, L.Č., Jovanović, P., Petrović, T., Shalyapin, V.N. (2006b), AN, 327, p. 981.
- Reichard et al. (2003) Reichard, T.A., Richards, G.T. Hall, P.B., Schneider, D.P., Vanden Berk, D.E., Fan, X., York, D.G., Knapp, G.R., Brinkmann, J. (2003) AJ, 126, p. 2594.
- Wambsganss (1992) Wambsganss, J. (1992) ApJ, 386, p. 19.