Detection of the Central Star of the Planetary Nebula NGC 6302
Abstract
NGC 6302 is one of the highest ionization planetary nebulae known and shows emission from species with ionization potential 300eV. The temperature of the central star must be K to photoionize the nebula, and has been suggested to be up to K. On account of the dense dust and molecular disc, the central star has not convincingly been directly imaged until now. NGC 6302 was imaged in six narrow band filters by Wide Field Camera 3 on HST as part of the Servicing Mission 4 Early Release Observations. The central star is directly detected for the first time, and is situated at the nebula centre on the foreground side of the tilted equatorial disc. The magnitudes of the central star have been reliably measured in two filters (F469N and F673N). Assuming a hot black body, the reddening has been measured from the (4688-6766Å) colour and a value of c=3.1, Av=6.6 mag determined. A G-K main sequence binary companion can be excluded. The position of the star on the HR diagram suggests a fairly massive PN central star of about 0.64 M⊙ close to the white dwarf cooling track. A fit to the evolutionary tracks for () = (K, L⊙, yr), where is the nebular age, is obtained; however the luminosity and temperature remain uncertain. The model tracks predict that the star is rapidly evolving, and fading at a rate of almost 1% per year. Future observations could test this prediction.
1 Introduction
Planetary nebulae (PN) trace one of the fastest phases of stellar evolution. They form when an Asymptotic Giant Branch (AGB) star ejects its envelope in a massive wind, leaving only the remnant degenerate C/O core. After the ejection, the star heats up rapidly, reaching temperatures over K, within typically a few thousand years. The hydrogen burning ceases at this point, and the star quickly fades by a large factor, before entering the white dwarf cooling track. The hot star ionizes the previously ejected nebula: the bright ionized nebula combined with the very hot, optically faint star, can make the stellar emission difficult to detect. This is made worse if circumstellar extinction hides the star from direct view in the optical and ultra-violet domain.
The central star of NGC 6302 has proven to be one of the most elusive of all PN central stars. In spite of many attempts, it has not been detected so far. NGC 6302 shows a strongly bipolar morphology, with filamentary emission extending over 7′. Bipolar morphologies are thought to be associated with circumstellar discs and torii (Balick et al., 1987; Icke, 2003), which are commonly seen in post-AGB nebulae (Siódmiak et al., 2008). NGC 6302 provides an extreme case for such a massive, optically opaque torus (Matsuura et al., 2005; Peretto et al., 2007; Dinh-V-Trung et al., 2008).
The central star of NGC 6302 is believed to be extremely hot, as indicated by the optical spectrum (e.g. Tsamis et al., 2003) and observation of infrared coronal lines of highly ionized elements, of which the highest observed is Si+8 with an ionization potential of 303eV (Casassus et al., 2000). To produce such high ionization species various authors have suggested very hot stars: Ashley & Hyland (1988) proposed a black body of 430 000 K; Pottasch et al. (1996) K; and Casassus et al. (2000) K. Groves et al. (2002), based on the observed scattered continuum, estimated the temperature of the central source to be K. Most recently, Wright et al. (2007), based on 3D photo-ionization modeling, proposed a hydrogen deficient central star with a surface temperature of K.
These stellar temperatures are similar to those of NGC 7027, another very bright, compact PN at a similar distance. But whilst the star of NGC 7027 has been unambiguously identified in images (e.g. Wolff et al., 2000), the star of NGC 6302 has remained hidden even in previous HST and ground-based images. The only possible detection is from Matsuura et al. (2005), who located a compact source emitting at 3.94 m, possibly associated with the [Si IX] emission line. It is not known whether the star of NGC 6302 is fundamentally different from NGC 7027 (higher temperature or lower luminosity). We here present new HST observations with the newly-installed WFC3 instrument, which for the first time directly reveal the central star, and allow us to address these questions.
2 Observations
NGC 6302 was observed as part of the HST Early Release Observations (ERO) to demonstrate the scientific capabilities of the newly installed Wide Field Camera 3 (WFC3) on board the Hubble Space Telescope (HST). At optical wavelengths, the UVIS channel has two 2k4k CCDs, with a spatial scale of 39 mas/pixel and a field of view of 162 arcsec. Imaging programme 11504 (PI: K. Noll) was executed on 2009 July 27 using 9 orbits. Table 1 lists the observations in six narrow band filters that isolate emission lines from ionization potentials of 10eV ([S II] 6716 & 6731 Å) to 54eV (He II 4686Å).
3 Reduction and Results
The pipeline-reduced long-exposure images for all the filter bands (i.e. FLT files) were combined using multidrizzle (Fruchter et al., 2009) rebinning the output to 0.040′′/pixel. The images in different filters were matched using field stars in common. The alignment was verified by inspecting star positions in the final images. Comparison of the multidrizzled images with those in the public ERO release showed good agreement.
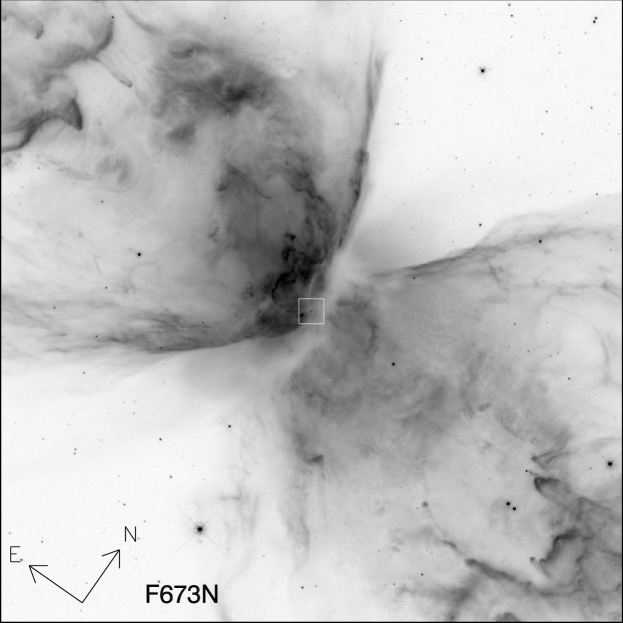
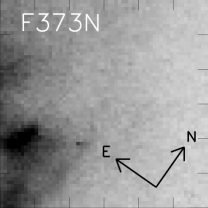
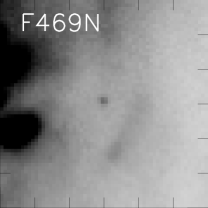
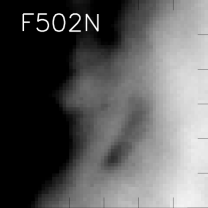
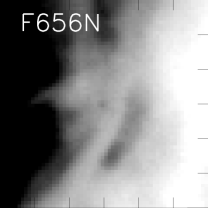
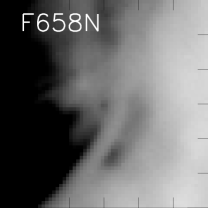
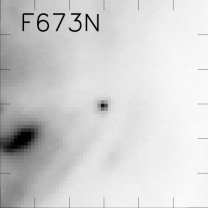
Figure 1 shows the F673N filter image of the central arcminute of NGC 6302 and the 2.42.4′′ area around the central star, for all the six HST WFC3 filter images in the ERO release. This star is well detected on the F469N and F673N filters at the position (J2000) and marginally detected on the F502N, F656N and F658N images. From the filter parameters summarized in Table 1 and the emission line spectrum of NGC 6302, as taken for example from Groves et al. (2002), the only emission line contribution to the F469N filter is He II 4686Å. The F673N filter contains weak lines of He I and C IV, in addition to the [S II]6730Å line; the [S II]6716Å line is just at the half power point. All the other filters contain strong emission lines. The ease of detection of the star in the F673N filter is accounted for by the lower emission line contribution to the band, producing a much higher star/background contrast. This also applies to the F469N filter, where the He II line is 10% of the strength of the [O III]5007Å line (in the F502N filter) and of the H line in F656N.
Photometry was then performed on the star at the centre of NGC 6302 in the six combined multidrizzled images. Robustness of the results depends on accurate determination of the high and structured background. We applied three different approaches. First, using a small aperture (2 pixels radius) and a 3 pixel wide ’sky’ (in reality nebula) annulus. Second, a surface fit to the local background, excluding a small annulus around the central star, was made in the same way for all images: this was subtracted from the image, and aperture photometry was performed on these images. As a third approach, Sextractor (Bertin & Arnouts, 1996) photometry was performed. For the F469N and F4673N filter images the results showed good consistency, but for the other images there is a larger scatter of typically 0.3mag. In Table 1, the 2.0 pixel radius photometry is listed, where an aperture correction was applied by performing photometry of uncrowded stars in the periphery of the nebula with increasing aperture size.
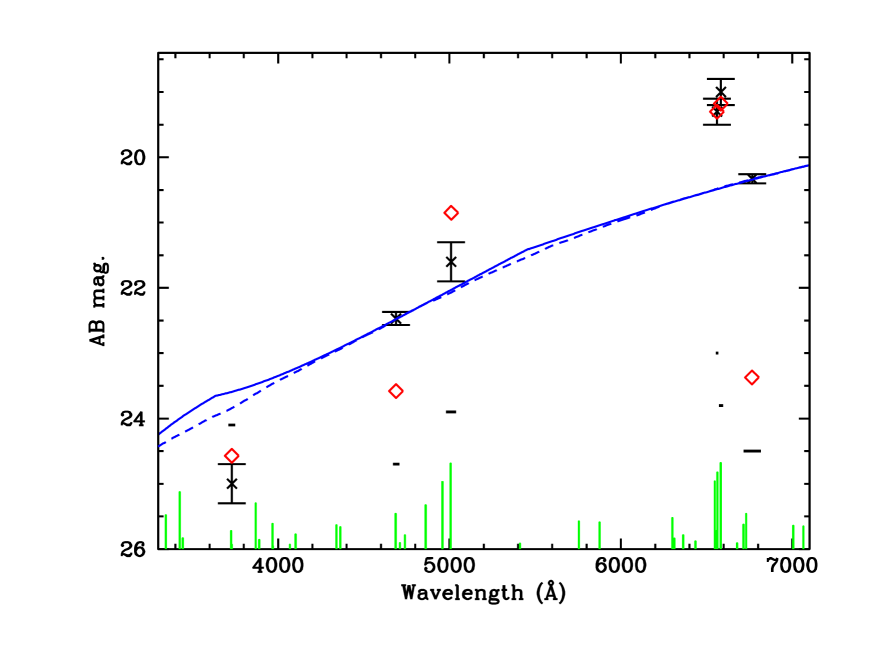
Figure 2 shows the photometric points (in AB magnitudes) plotted as a function of the wavelength. At the position of each point, a horizontal bar shows the width of the respective filter. Also plotted on the X-axis (in green) is a compressed log spectrum of NGC 6302 taken from Groves et al. (2002), applying a logarithmic extinction at H of . A nebular continuum (computed for K and He/H = 0.18) was added to this emission line spectrum and the result converted to WFC3 filter photometry using the STSDAS.synphot package. This allows comparison of the stellar photometry with the colours expected from the nebula spectrum, the latter shown as red diamonds on Figure 2 (with arbitrary absolute flux scaling tied to the F656N filter measurement of the stellar magnitude). From this comparison it is clear that the photometric points for the F469N and F673N filters are inconsistent with nebular emission. Although there appears to be a feature in the F373N, F502N, F656N and possibly F658N, filters, at the position of the star in the F469N and F673N images (see Figure 1), the heavy nebula contribution prevented reliable measurement of the stellar magnitudes and the results correspond more closely to that of (inadequately subtracted) nebula emission. The stellar magnitude is marginally measurable on the F502N image. Even though the stellar flux is higher in the F373N band, the high extinction prevents reliable detection in this filter.
Taking the two photometric points at 4690 and 6766Å (Table 1) as reliable detections of a putative central star of NGC 6302, the (4690–6766Å) colour was compared with that of a star of a given black body temperature subjected to line-of-sight extinction. Given the very high temperature estimates for the central star, a very large value of extinction must be applied to produce the observed (4690–6766Å) colour of 2.1 mag. Two extinction laws were used to determine the extinction - the standard Galactic law of Seaton (1979) with the ratio of total to selective extinction of and, on the basis of the good agreement of the observed and theoretical nebula continuum determined by Groves et al. (2002), the Whitford law (as tabulated by Kaler, 1976), for the three estimates of the stellar temperature, using a black body. For such high temperatures, a black body should be a good approximation to the optical colours. Table 2 lists the values of c determined in these three cases. The values of can be directly converted to by multiplying by 2.18 and are listed in Table 2.
For such high temperatures there is not sufficient sensitivity to determine the temperature of the central star, and the extinction only changes by 0.02 for black body temperatures from to K. From the unreddened flux, taking the F673N magnitude as the most reliable, assuming a black body, and the distance of 1.17 kpc (Meaburn et al., 2008), the derived stellar luminosity can be determined and is listed in Table 2.
4 Discussion
The HST point spread function and the excellent optical and CCD quality of WFC3 UVIS have allowed the central star of NGC 6302 to be unambiguously detected for the first time. The star is situated in the centre of the large-scale nebular outflows, as expected, and lies on the eastern edge of the thick dust lane. This location is also the expected one given that the eastern lobe is tilted to the foreground (Meaburn et al., 2008). However the central star is not at the expected position at the centre of the innermost torus as shown by the radio data (Matsuura et al., 2005). No optical emission counterpart was found at the position of the infrared source of Matsuura et al. (2005), which is approximately north from the proposed central star. Nor was a point source detected at the position of the 6cm radio continuum emission peak reported by Matsuura et al. (2005) (about from the star); only an upper limit of 23.8 (AB mag.) was measured for the F673N magnitude of a source at this position by aperture photometry. The (4688-6766Å) colour at this radio peak position resembles nebular emission. Thus if a star was present at this position, it would suffer much higher extinction than indicated by the Matsuura et al. (2005) extinction maps.
The very high extinction towards the central star derives mostly from the circumstellar torus. From the ratio map of H to radio flux, Matsuura et al. (2005) derive 5–7 for the central region, corresponding to 6–8. Field stars indicate a foreground extinction (Matsuura et al., 2005), leaving the remainder as circumstellar extinction. The Br image of Matsuura et al. (2005) shows that the peak extinction is considerably higher than derived from H, possibly as high as : H cannot be detected from such regions. The region of highest extinction is offset from the centre, consistent with the fact that the torus is seen with a small inclination of 18∘ (Meaburn et al., 2008; Peretto et al., 2007; Dinh-V-Trung et al., 2008).
The distance to NGC 6302 determined by Meaburn et al. (2008) as 1.17 kpc from expansion proper motions of filaments agrees fairly well with an assumed distance of 0.91 kpc from Kemper et al. (2002) and 1.0 kpc from Matsuura et al. (2005). Older values include Rodriguez et al. (1985) who argue for a distance of 1.7 kpc, with a possible association to the star formation region NGC 6334. Distances much larger than 1 kpc lead to very high masses for the shell and torus (e.g. Matsuura et al., 2005).
The nebular luminosity, scaled to a distance of 1.17 kpc, was determined as , based on infrared dust modeling (Matsuura et al., 2005). An almost identical value is derived from the radio flux of Rodriguez et al. (1985). Both measure the reprocessed stellar radiation, and, for an optically thick nebula, the nebula luminosity should track the luminosity of the star. To derive a stellar luminosity from the photometry, a temperature and a spectrum must be assumed. For a black body, Table 2 shows that the stellar and nebular luminosity agree well for a stellar temperature of around K.
Many central stars of PNe are expected to be binaries (de Marco, 2009). The central star of NGC 6302 has also been suggested to be binary: Feibelman (2001) claimed evidence for a G5V companion based on IUE spectra, although this has been disputed by Meaburn et al. (2005). A G5V star has , and for a distance of 1.17kpc and an extinction of , the observed V magnitude on the Vega system would be V=22.1. Interpolating the observed magnitudes in Fig. 2, the AB mag at V (very close to the Vega system) is 21.5, not incompatible with a G5V star. However, for a temperature of 5200K, suggested by Feibelman, with an extinction of 6.7 mag, the (4688–6766Å) colour would be 1.5 mag. larger than observed. A much lower extinction () could reproduce the (469–673) colour, but the absolute V mag would be around 8.1. corresponding to a K5 star. Thus, we can exclude a G5V star. A K5V star is in principle possible, but requires a much lower extinction than measured from H. In contrast, a hot star precisely fits the measured extinction and is the preferred interpretation. If we were detecting the companion, the true central star would be hotter and/or less luminous than derived here (Table 2).
Knowing an accurate luminosity and temperature allows one in principle to obtain the mass of the star, an important parameter for the stellar modeling. At this phase of evolution, the stellar mass is close to the mass of the degenerate C/O core, or the later white dwarf. Typically, this method does not provide accurate masses. The luminosity is typically too uncertain to allow for an accurate mass determination, because of distance errors. In the case of NGC 6302, the luminosity is accurate to 25 per cent (based on a distance error of 12% from Meaburn et al., 2008), however the star appears to be on the cooling track where tracks of different masses are closely clustered.
Instead, the evolutionary time scale can be used to improve on the mass accuracy: the speed of the evolution along the Bloecker (1995) track is a very strong function of stellar mass. The surrounding nebula acts as a clock, as its expansion dates from the time the star departed the AGB. This age, plus the stellar temperature and luminosity, can be used to derive an accurate stellar mass. This method is described in Gesicki & Zijlstra (2007) and references therein. The age of the nebula can be derived from the angular extent, distance, and de-projected expansion velocity. The CO observations of Peretto et al. (2007) show that the torus ejection ended 2900 yr ago. The bipolar lobes appear to be a little younger, with an age of 2200 yr (Meaburn et al., 2008). We will assume that 2200 yr represents the full post-AGB evolution age of the central star.
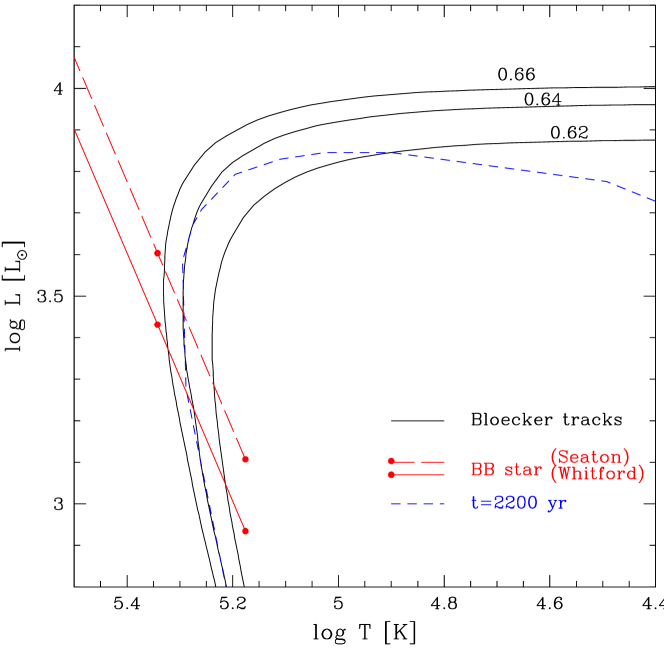
A luminosity of 4000 L⊙ puts the star at the upper end of the cooling track. We use interpolations of the Bloecker tracks to obtain a grid of models at a mass resolution of 0.02 M⊙, as described by (Frankowski, 2003). The 0.68M⊙ track passes through the point at (K, L=4000L⊙), however it does so at a post-AGB age of 1000 yr which is too young to fit NGC 6302. Higher mass tracks are hotter at this luminosity, and much younger, while lower mass stars are older and a little cooler. Again, the tracks run very close in the HR diagram, leaving the age as the important discriminant. Figure 3 shows the possible locations of the star (for both extinction laws in Table 2), the interpolated Bloecker tracks and the locus of tracks of different masses for an age of 2200 yr. The lines intersect at () = (K, L⊙), corresponding to a stellar mass of . This fit gives a temperature a little below that derived by Wright et al. (2007). The different extinction laws give essentially the same mass: this is because the evolution at this location in the HR diagram is very fast.
It should be noted that the fit is only as accurate as the models, and there is a considerable systematic uncertainty in the derived mass (Zijlstra et al., 2008). The Bloecker tracks are calculated for a sparse range of masses only, so that the interpolation is done over a relatively large mass range. The speed of evolution especially of the early post-AGB evolution, is uncertain, and this uncertainty feeds through to the time scales at later stages. However, the method is expected to give good constraints on relative masses. Thus, comparison with the results of Gesicki & Zijlstra (2007) shows that NGC 6302 has a high mass compared to typical PNe.
The result can also be compared to that of another high-mass PN, NGC 7027. Zijlstra et al. (2008) derive a mass of M⊙ using the same method. The star of NGC 7027 is still on the horizontal, high luminosity track, and the nebula is much younger. For an age of 2200 yr, the star of NGC 7027 will have evolved much farther down the cooling track: the interpolated Bloecker tracks predict . The comparison therefore suggests that the star of NGC 6302 is indeed a little less massive than that of NGC 7027.
The fit to the star of NGC 6302 suggests it is currently in a phase of very fast evolution. The model track shows a decline of the luminosity of per cent per year. Such fast evolution could leave the ionization of the nebula out of equilibrium.
In summary, this paper presents the first direct detection of the central star of NGC 6302, among the hottest stars of planetary nebulae. The photometry indicates a hot, significantly extincted star. The location in the HR diagram and age of the nebula indicates a massive star, with mass of about 0.64 M⊙. The models suggest that a star at this location would be in a phase of rapid fading, and it would be of interest to test this observationally.
References
- Ashley & Hyland (1988) Ashley, M. C. B., & Hyland, A. R. 1988, ApJ, 331, 532
- Balick et al. (1987) Balick, B., Preston, H. L., & Icke, V. 1987, AJ, 94, 1641
- Bertin & Arnouts (1996) Bertin, E., & Arnouts, S. 1996, A&AS, 117, 393
- Bloecker (1995) Bloecker, T. 1995, A&A, 299, 755
- Casassus et al. (2000) Casassus, S., Roche, P. F., & Barlow, M. J. 2000, MNRAS, 314, 657
- de Marco (2009) de Marco, O. 2009, PASP, 121, 316
- Dinh-V-Trung et al. (2008) Dinh-V-Trung, Bujarrabal, V., Castro-Carrizo, A., Lim, J., & Kwok, S. 2008, ApJ, 673, 934
- Feibelman (2001) Feibelman, W. A. 2001, ApJ, 550, 785
- Frankowski (2003) Frankowski, A. 2003, A&A, 406, 265
- Fruchter et al. (2009) Fruchter, A. S., Hack, W., Droetboom, M., Dencheva, N., Greenfield, P., & Hanley, C. 2009, in Bulletin of the American Astronomical Society, Vol. 41, Bulletin of the American Astronomical Society, 414–+
- Gesicki & Zijlstra (2007) Gesicki, K., & Zijlstra, A. A. 2007, A&A, 467, L29
- Groves et al. (2002) Groves, B., Dopita, M. A., Williams, R. E., & Hua, C.-T. 2002, Publications of the Astronomical Society of Australia, 19, 425
- Icke (2003) Icke, V. 2003, A&A, 405, L11
- Kaler (1976) Kaler, J. B. 1976, ApJS, 31, 517
- Kemper et al. (2002) Kemper, F., Molster, F. J., Jäger, C., & Waters, L. B. F. M. 2002, A&A, 394, 679
- Matsuura et al. (2005) Matsuura, M., Zijlstra, A. A., Molster, F. J., Waters, L. B. F. M., Nomura, H., Sahai, R., & Hoare, M. G. 2005, MNRAS, 359, 383
- Meaburn et al. (2008) Meaburn, J., Lloyd, M., Vaytet, N. M. H., & López, J. A. 2008, MNRAS, 385, 269
- Meaburn et al. (2005) Meaburn, J., López, J. A., Steffen, W., Graham, M. F., & Holloway, A. J. 2005, AJ, 130, 2303
- Peretto et al. (2007) Peretto, N., Fuller, G., Zijlstra, A., & Patel, N. 2007, A&A, 473, 207
- Pottasch et al. (1996) Pottasch, S. R., Beintema, D., Dominguez-Rodriguez, F. J., Schaeidt, S., Valentijn, E., & Vandenbussche, B. 1996, A&A, 315, L261
- Rodriguez et al. (1985) Rodriguez, L. F., et al. 1985, MNRAS, 215, 353
- Seaton (1979) Seaton, M. J. 1979, MNRAS, 187, 73P
- Siódmiak et al. (2008) Siódmiak, N., Meixner, M., Ueta, T., Sugerman, B. E. K., Van de Steene, G. C., & Szczerba, R. 2008, ApJ, 677, 382
- Tsamis et al. (2003) Tsamis, Y. G., Barlow, M. J., Liu, X.-W., Danziger, I. J., & Storey, P. J. 2003, MNRAS, 345, 186
- Wolff et al. (2000) Wolff, M. J., Code, A. D., & Groth, E. J. 2000, AJ, 119, 302
- Wright et al. (2007) Wright, N. J., Barlow, M. J., Ercolano, B., & Rauch, T. 2007, in: Asymmetric Planetary Nebulae IV, R. L. M. Corradi, A. Manchado, N. Soker eds, ArXiv e-prints 0709.2122
- Zijlstra et al. (2008) Zijlstra, A. A., van Hoof, P. A. M., & Perley, R. A. 2008, ApJ, 681, 1296
| Filter | FWHM | Emission | Exposures | AB | Error | Vega | ||
|---|---|---|---|---|---|---|---|---|
| [Å] | [Å] | Line | Long | Short | [mag] | [mag] | [mag] | |
| F373N | 3730.2 | 39.2 | [O II] | 41400s | 25.0 | 0.30 | 24.1 | |
| F469N | 4688.1 | 37.2 | He II | 41400s | 22.47 | 0.10 | 22.63 | |
| F502N | 5009.6 | 57.8 | [O III] | 6370s | 135s | 21.6 | 0.30 | 21.7 |
| F656N | 6561.4 | 13.9 | H | 6350s | 135s | 19.3 | 0.20 | 18.7 |
| F658N | 6584.0 | 23.6 | [N II] | 6370s | 135s | 19.0 | 0.20 | 18.6 |
| F673N | 6765.9 | 100.5 | [S II] | 41300s | 1100s | 20.33 | 0.07 | 20.08 |
| F(6765Å) | ||||
| [K] | [mag] | [erg cm-2 s-1] | [L⊙] | |
| Seaton law | ||||
| 150000 | 3.05 | 6.65 | 1.84E-15 | 1280 |
| 220000 | 3.06 | 6.67 | 1.86E-15 | 4010 |
| 400000 | 3.07 | 6.69 | 1.89E-15 | 24000 |
| Whitford law | ||||
| 150000 | 2.88 | 6.28 | 1.23E-15 | 860 |
| 220000 | 2.89 | 6.30 | 1.25E-15 | 2700 |
| 400000 | 2.90 | 6.32 | 1.27E-15 | 16100 |