fermiWork supported by the U.S. Department of Energy under contract No. DE-AC02-07CH11359.Work supported by the U.S. Department of Energy under contract No. DE-AC02-07CH11359.
Measurements of the Top Quark Mass at D0
Abstract
We present measurements of the top quark mass based on of data collected by the D0 experiment during Run II of the Fermilab Tevatron collider. We present results in the dilepton and lepton+jets final states. We also present the measurement of the mass difference between and quarks observed in lepton+jets final states of events in of data.
Keywords:
top quark mass, antitop quark mass, CPT tests:
11.30.Er, 12.15.Ff, 14.65.Ha1 Introduction
The unique place in the Standard Model filled by the top quark makes precise measurements of its mass of great interest. We report preliminary top quark mass measurements using of data from the D0 experiment d0 at the Fermilab Tevatron, as well a direct measurement of the mass difference between the top quark and its antiparticle.
2 Measurements of the top quark mass
The most precise top quark mass measurements at D0 are currently obtained by the matrix element method matrix-element . In this method, a likelihood is assigned to each event of the form
| (1) |
where represents the full set of measured kinematic quantities of the event, the top quark mass, and is the signal fraction in the sample. The signal likelihood is then
| (2) |
where is the set of parton-level kinematic variables defining the final state of the hard scatter, are the momenta of the incoming partons, is the parton distribution function, is the observable cross section (including the detector efficiency), is the matrix element for the hard scatter, taken from an analytic calculation mahlon-parke , and is the transfer function from a hard scatter to the measured variables. The sum is over flavors of incoming partons and assignments of jets to final-state partons; if -tagging is used, a weight is applied based on this assignment. is similar, except that there is no dependence on and is evaluated using vecbos vecbos . An estimate of and its uncertainty is then extracted from the joint likelihood of a data sample via maximum likelihood. Due to approximations present in and , the mass extracted by this procedure will be systematically biased. The analysis is carried out on many simulated experiments with various input ; the results are used to correct the extracted and its uncertainty. alpgen alpgen is used to model the signal.
This measurement has been carried out in the channel with of data emu36 . Events are selected with an isolated, high- electron and muon and two jets; there is also a requirement made on . This yields 154 candidate events. The expected background fraction is about and is predominantly due to . The fit to the final subset of the data is shown in Fig. 2.
![[Uncaptioned image]](/html/0909.5138/assets/x1.png)
Fit for to of data. (Uncalibrated.)
![[Uncaptioned image]](/html/0909.5138/assets/x2.png)
Fit for and JES to of data. (Uncalibrated.)
The result after calibration is . Combined with previous D0 results from channels in which both top quarks decay to leptons olddil , the result is .
The analysis has also been performed in the (“,” where ) channels with of data ljets36 . Events are required to have exactly one isolated, high- electron or muon, large , and exactly four jets, at least one of which must be identified as a -jet. This yields 615 events with a background fraction of about . Each signal event has a decay; by constraining this to the known mass of the boson, the jet energy scale uncertainty may be reduced. This is implemented with an additional fit parameter JES, which is a multiplicative scale factor on the jet energies. A prior probability distribution for JES is included, corresponding to the results of the standard jet energy calibration. Results for the final of data are shown in Fig. 2.
The result is . Combining all top quark mass measurements from D0 d0combination yields . The precision of this measurement is now better than ; also note that it is now systematics dominated.
Systematic uncertainties (in GeV) for the top quark mass measurements tevcombination . Source In-situ JES — Jet , -tag, recon. modeling JES control samples Lepton momentum scale Signal model Monte Carlo model diffs. Bkg. model (excl. QCD) Fit method + QCD bkg. Color reconnection Luminosity profile Total:
Systematic uncertainties (in GeV) for the top quark mass difference measurement. Source Physics modeling: Signal PDF uncertainty Other Detector modeling: Jet resolution Overall jet energy scale Wrong sign leptons response asymmetry Other Method: Total:
Systematic uncertainties are summarized in Table 2. The categories shown in this table are the result of a recent effort to make the evaluation of systematics consistent across all Tevatron measurements. Compared with previous analyses, two new systematics have now been evaluated. “Color reconnection” arises from variations in the description of color reconnection of final-state particles color-reconn . “Luminosity profile” quantifies the uncertainty due to mismodeling the number of collisions per bunch crossing.
When these results are combined with those from CDF, the new world average is tevcombination , for an overall precision of .
3 Top-antitop quark mass difference measurement
CPT is generally believed to be a good symmetry nature; by the CPT theorem CPT , it holds for any local Lorentz-invariant quantum field theory. Nevertheless, it is important to search for any violations. One implication of CPT invariance is that the mass of a particle and its antiparticle must be equal. While many precise such measurements have been made cptmeas , those for quarks have always been indirect. The top quark is, however, unique: due to its large mass, it decays before hadronization effects become important. Thus, the masses of the top and antitop quarks can be measured directly and separately.
D0 has now performed the first direct measurement of the mass difference between a quark and its antiquark mdiff . The measurement is performed in the channel using the 2002–2006 data set, comprising about .
The method is an extension of the matrix element method described earlier. The matrix element of (2) is modified so that the top and antitop quark masses are specified separately. For this analysis, the jet energy scale factor JES is fixed to that determined from the mass measurement. Thus, instead of , we now extract ; or equivalently . The leptonically-decaying top quark in each event is identified as either a quark or antiquark based on the sign of the lepton. A modified version of pythia pythia is used to simulate signal events with .
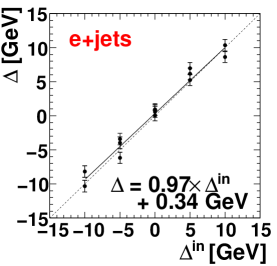
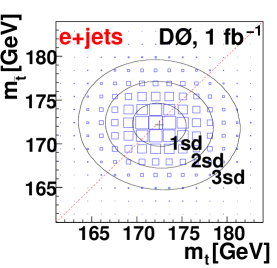
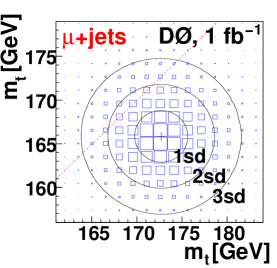
Fig. 1 shows the analysis calibration and fits to data. Combining the electron and muon channels yields and . The mass previously measured from this data sample was mass1a .
Systematic uncertainties are summarized in Table 2. Most are common with the mass measurement analysis; they tend, however, to cancel in the difference. Many systematics are dominated by the statistics of the samples used to evaluate them. Two sources of systematics are new for this analysis. First is the uncertainty due to mismeasurements of the sign of the electron. This is evaluated by increasing the mismeasurement rate in Monte Carlo to match that seen in data. Second is the asymmetry in the calorimeter response to jets from and quarks. This systematic is limited by statistics.
The total systematic uncertainty for the measurement is , giving a final result from of data of .
References
- (1) D0 Collaboration, Nucl. Instrum. Meth. A565, 463–537 (2006).
- (2) D0 Collaboration, Nature 429, 638–642 (2004).
- (3) G. Mahlon, and S. J. Parke, Phys. Lett. B411, 173–179 (1997).
- (4) F. A. Berends, H. Kuijf, B. Tausk, and W. T. Giele, Nucl. Phys. B357, 32–64 (1991).
- (5) M. L. Mangano, M. Moretti, F. Piccinini, R. Pittau, and A. D. Polosa, JHEP 07, 001 (2003).
- (6) D0 Collaboration, D0NOTE-5897-CONF (2009).
- (7) D0 Collaboration, FERMILAB-PUB-09/125-E (2009), arXiv.org:0904.3195.
- (8) D0 Collaboration, D0NOTE-5877-CONF (2009).
- (9) D0 Collaboration, D0NOTE-5900-CONF (2009).
- (10) Tevatron EW Working Group, FERMILAB-TM-2427-E (2009), arXiv.org:0903.2503.
- (11) D. Wicke, and P. Z. Skands, MCnet/08/06 (2008), arXiv.org:0807.3248.
- (12) J. S. Schwinger, Phys. Rev. 82, 914–927 (1951).
- (13) Particle Data Group, C. Amsler, et al., Phys. Lett. B 667, 93 (2008).
- (14) D0 Collaboration, Phys. Rev. Lett. 103, 132001 (2009).
- (15) T. Sjöstrand, et al., Comput. Phys. Commun. 135, 238–259 (2001).
- (16) D0 Collaboration, Phys. Rev. Lett. 101, 182001 (2008).