Spitzer IRS Spectra of Luminous 8 µm Sources in the Large Magellanic Cloud: Testing color-based classifications
Abstract
We present archival Spitzer IRS spectra of 19 luminous 8 µm selected sources in the Large Magellanic Cloud (LMC). The object classes derived from these spectra and from an additional 24 spectra in the literature are compared with classifications based on 2MASS/MSX (J, H, K, and 8 m) colors in order to test the “JHK8” classification scheme (Kastner et al., 2008). The IRS spectra confirm the classifications of 22 of the 31 sources that can be classified under the JHK8 system. The spectroscopic classification of 12 objects that were unclassifiable in the JHK8 scheme allow us to characterize regions of the color-color diagrams that previously lacked spectroscopic verification, enabling refinements to the JHK8 classification system. The results of these new classifications are consistent with previous results concerning the identification of the most infrared-luminous objects in the LMC. In particular, while the IRS spectra reveal several new examples of asymptotic giant branch (AGB) stars with O-rich envelopes, such objects are still far outnumbered by carbon stars (C-rich AGB stars). We show that Spitzer IRAC/MIPS color-color diagrams provide improved discrimination between red supergiants and oxygen-rich and carbon-rich asymptotic giant branch stars relative to those based on 2MASS/MSX colors. These diagrams will enable the most luminous IR sources in Local Group galaxies to be classified with high confidence based on their Spitzer colors. Such characterizations of stellar populations will continue to be possible during Spitzer’s warm mission, through the use of IRAC [3.6]-[4.5] and 2MASS colors.
1 INTRODUCTION
The infrared wavelength regime is key to understanding the early and late stages of stellar evolution, which are characterized by circumstellar dust. Objects in these phases should dominate the mid-infrared (MIR) point source populations of nearby galaxies. The Spitzer Space Telescope has enabled the detection of large numbers of mass-losing evolved stars and dust-enshrouded young stellar objects throughout the Local Group (e.g., Blum et al. 2006; Jackson et al. 2006, 2007; Cannon et al. 2006). Identification of these objects relies on their location in color-color and color-magnitude diagrams, and is often based on stellar evolution models (e.g., Blum et al. 2006). Reliable classification of objects based on photometry requires spectroscopic confirmation. Such confirmation is especially important when attempting to distinguish between the various classes of very highly obscured (and hence IR-luminous) mass-losing evolved stars, such as red supergiants vs. asymptotic giant branch (AGB) stars, and AGB stars with oxygen-rich vs. carbon-rich circumstellar envelopes. These determinations in turn provide key input for models of galactic chemical enrichment.
This paper is the third in our series discussing the classification of compact IR-luminous sources in the Large Magellanic Cloud (LMC). Our sample was selected from the sample of 1650 2MASS/MSX LMC sources compiled by Egan, Van Dyk & Price (2001) (hereafter EVP01), and comprises the 250 luminous 8 µm sources (F mJy) that are not already known to be main sequence stars or Galactic objects (Kastner et al. 2008; hereafter Paper II). In Buchanan et al. (2006, hereafter Paper I), we classified and analyzed the Spitzer IRS111The IRS was a collaborative venture between Cornell University and Ball Aerospace Corporation funded by NASA through the Jet Propulsion Laboratory and Ames Research Center. (Houck et al., 2004) spectra of 60 sources in our sample and derived spectroscopically verified color-color diagnostics using 2MASS and MSX A-band photometry. We refer to this 2MASS/MSX color-color classification system as the JHK8 scheme. In Paper II we classified 70% of the sample with high confidence, based on the JHK8 color-based classifications supplemented by data from the literature. In this paper, we use additional IRS spectra available from the Spitzer archive to further refine the JHK8 scheme and discuss classifications based on Spitzer photometry.
Of the sample of 250 luminous 8 µm sources in the LMC, IRS spectra are available for 123 objects. Classifications for 60 of these were presented in Paper I. This paper presents classifications for 44 of the remaining 63 objects, which are listed in Table 1. The final 19 archival sources, which were not yet public at the time of submission of this paper, will be considered in a future paper. In §2, we discuss the data reduction for 20 of the 44 sources. The remaining 24 sources have spectra that are previously published in Speck et al. (2006), Zijlstra et al. (2006), and Sloan et al. (2008). We use the published spectra to do our own independent classification. In §3, we provide spectral classifications for these 44 sources (Table 2), which break down into the following categories and subcategories: 17 O-rich objects (3 AGB stars, 3 OH/IR stars, 4 B[e] stars, and 7 RSGs), 19 C-rich objects (all AGB stars), 4 H II regions, 3 Young Stellar Objects (YSOs) or candidate YSOs, and 1 unclassified source (spectrum too weak). We present the spectra for 9 new O-rich sources, 4 new C-rich sources, 4 new H II regions, and 2 candidate YSOs. In §4, we use these 44 sources to test and refine the JHK8 scheme. We find that 22 were classified correctly, 9 were not classified correctly, 12 could not be classified with the JHK8 scheme, and 1 source had a spectrum too weak to classify. We describe revisions to this classification scheme based on these results, and extend the classifications to Spitzer IRAC/MIPS colors. We conclude with a summary in §5.
2 SAMPLE AND DATA REDUCTION
The selection of the sample is described briefly in §1 and more fully in Paper II. Table 1 lists the archival sample objects and the properties of the data. We note whether the data are publicly available as of the time of submission of this paper and list references where the data have appeared in the literature.
| MSX LMCaaMSX LMC identifier (EVP01). | SIMBAD NamebbObject name in SIMBAD (simbad.u-strasbg.fr/sim-fid.pl). | RA (J2000)ccMSX LMC source position from SIMBAD | Dec (J2000)ccMSX LMC source position from SIMBAD | Target NameddObject name as given in the headers of the data. | PIDeeSpitzer program identifier. | AORKEYffUnique identifier for the astronomical observation request (AOR). | Public? | Ref.ggReferences. – S08: Sloan et al. 2008; S06: Speck et al. 2006; Z06: Zijlstra et al. 2006. |
|---|---|---|---|---|---|---|---|---|
| 21 | IRAS 05053-6659 | 05 05 20.35 | -66 55 06.6 | Cluster-013 | 40650 | 23893504 | N | |
| 43 | HV 888 | 05 04 14.11 | -67 16 14.5 | HV 888 | 200 | 6015488 | Y | S08 |
| 44 | IRAS 05112-6755 | 05 11 10.42 | -67 52 10.6 | TRM4 | 3505 | 12939008 | Y | Z06 |
| 46 | LHA 120-N 17A | 05 03 54.53 | -67 18 48.6 | SSTISAGE1C J050354.56-671848.5 | 40159 | 24317696 | Y | |
| 47 | MXS LMC 47 | 05 11 13.85 | -67 36 16.2 | TRM24 | 3505 | 12937984 | Y | Z06 |
| 80 | EQ 051005.7-685634 | 05 09 51.70 | -68 53 05.6 | lmc-hii-86 | 40159 | 22470400 | N | |
| 134 | HD 269006 | 05 02 07.39 | -71 20 13.1 | HD269006 | 1404 | 9108736 | Y | |
| 196 | IRAS 05125-7035 | 05 12 00.82 | -70 32 24.0 | LI-LMC 0603 | 1094 | 6078464 | Y | |
| 198 | HD 269211 | 05 12 30.17 | -70 24 22.3 | HD 269211 | 30869 | 19151360 | Y | |
| 215 | LHA 120-N 113A | 05 13 21.74 | -69 22 39.4 | Cluster-005 | 40650 | 23883008 | N | |
| 219 | MSX LMC 219 | 05 11 19.46 | -68 42 27.7 | MSX051119.5-684227 | 3505 | 12939264 | Y | Z06 |
| 223 | LI-LMC 623 | 05 12 51.05 | -69 37 50.5 | MSX051250.8-693749 | 3505 | 12938752 | Y | Z06 |
| 262 | HD 34664 | 05 13 52.99 | -67 26 54.6 | HD 34664 | 30869 | 19149056 | Y | |
| 283 | IRAS 05128-6455 | 05 13 04.56 | -64 51 40.3 | 05128-6455 | 200 | 6024192 | Y | S08 |
| 307 | IRAS 05190-6748 | 05 18 56.28 | -67 45 04.7 | TRM20 | 3505 | 12938496 | Y | Z06 |
| 318 | IRAS 05195-6911 | 05 19 12.31 | -69 09 06.5 | Cluster-002 | 40650 | 23884288 | N | |
| 323 | ARDB 184 | 05 16 31.80 | -68 22 09.1 | LHA 120-S 93 | 30869 | 19149312 | Y | |
| 341 | MSX LMC 341 | 05 21 00.43 | -69 20 55.3 | MSX052100.5-692054 | 3505 | 12937728 | Y | Z06 |
| 349 | MSX LMC 349 | 05 17 26.98 | -68 54 58.7 | MSX051726.9-685458 | 3505 | 12938240 | Y | Z06 |
| 356 | 2MASS J05190229-6938033 | 05 19 02.28 | -69 38 03.5 | Cluster-017 | 40650 | 23891456 | N | |
| 398 | IRAS 05182-7117 | 05 17 34.61 | -71 14 57.5 | Cluster-016 | 40650 | 23891968 | N | |
| 441 | MSX LMC 441 | 05 24 38.71 | -70 23 56.8 | MSX052438.7-702357 | 3505 | 12936448 | Y | Z06 |
| 461 | LHA 120-N 132E | 05 24 19.30 | -69 38 49.6 | IRAS 05247-6941hhFor these objects, the target name does not match the position observed, possibly due to misidentification or peakup failure. In all cases, the position observed matches the position of the MSX LMC source. | 1094 | 6076928 | Y | |
| 464 | [HS66] 272 | 05 24 13.37 | -68 29 58.9 | HS 272 | 40159 | 22425088 | N | |
| 468 | BSDL 1469 | 05 22 53.28 | -69 51 10.4 | Cluster-024 | 40650 | 23887872 | N | |
| 500 | LI-LMC 861 | 05 21 29.69 | -67 51 07.2 | IRAS 05216-6753 | 1094 | 6076160 | Y | |
| 501 | NGC 1936 | 05 22 12.55 | -67 58 31.8 | Cluster-006 | 40650 | 23882496 | N | |
| 560 | IRAS 05300-6651 | 05 30 03.86 | -66 49 24.2 | 05300-6651 | 200 | 6024704 | Y | S08 |
| 581 | MSX LMC 581 | 05 26 46.63 | -68 48 46.8 | Cluster-002 | 40650 | 23884288 | N | |
| 596 | IRAS 05311-6836 | 05 30 54.36 | -68 34 27.8 | Cluster-006 | 40650 | 23882496 | N | |
| 601 | OGLE J052650.96-693136.8 | 05 26 50.83 | -69 31 36.8 | MSX052650.9-693136 | 3505 | 12935424 | Y | Z06 |
| 635 | IRAS 05278-6942 | 05 27 24.12 | -69 39 45.0 | MSX052724.3-693944 | 3505 | 12932864 | Y | Z06 |
| 640 | LHA 120-N 129 | 05 22 24.94 | -69 42 32.4 | Cluster-010 | 40650 | 23895040 | N | |
| 646 | [MLD95] LMC 1-289 | 05 30 47.88 | -71 07 55.2 | LMC 1-289 | 30869 | 19150336 | Y | |
| 651 | IRAS 05310-7110 | 05 30 20.16 | -71 07 48.4 | Cluster-042 | 40650 | 23894784 | N | |
| 690 | MSX LMC 690 | 05 32 14.54 | -71 13 28.2 | Cluster-026 | 40650 | 23886848 | N | |
| 692 | MSX LMC 692 | 05 28 46.63 | -71 19 12.7 | IRAS 05295-7121 | 3505 | 12929024 | Y | Z06 |
| 733 | IRAS 05348-7024 | 05 34 15.98 | -70 22 52.7 | 05348-7024 | 200 | 6024448 | Y | S08 |
| 766 | LHA 120-N 150 | 05 33 42.22 | -68 46 00.8 | Cluster-014 | 40650 | 23892992 | N | |
| 771 | MSX LMC 771 | 05 32 38.59 | -68 25 22.1 | MSX053238.7-682522 | 3505 | 12931328 | Y | |
| 805 | LI-LMC 1163 | 05 32 35.62 | -67 55 08.8 | HV 996 | 200 | 6015744 | Y | S08 |
| 811 | MSX LMC 811 | 05 32 51.34 | -67 06 51.8 | 05329-6708 | 200 | 6023168 | Y | S08 |
| 886 | IRAS 05389-6922 | 05 38 33.96 | -69 20 31.6 | IRAS 05389-6922 | 1094 | 6076416 | Y | |
| 887 | IRAS 05406-6924 | 05 40 13.33 | -69 22 46.5 | HD 38489 | 30869 | 19149824 | Y | |
| 936 | IRAS 05402-6956 | 05 39 44.86 | -69 55 18.1 | 05402-6956 | 200 | 6020608 | Y | S08 |
| 1117 | IRAS 04498-6842 | 04 49 41.47 | -68 37 51.2 | IRAS 04498-6842 | 1094 | 6076672 | Y | |
| 1130 | IRAS 04496-6958 | 04 49 18.50 | -69 53 14.3 | IRAS 04496-6958 | 1094 | 9069312 | Y | S06 |
| 1171 | IRAS 04545-7000 | 04 54 10.08 | -69 55 58.4 | 04545-7000 | 200 | 6020352 | Y | S08 |
| 1183 | BSDL 126 | 04 51 53.66 | -69 23 28.3 | Cluster-003 | 40650 | 23883776 | N | |
| 1184 | IRAS 04530-6916 | 04 52 45.67 | -69 11 49.6 | 04530-6916 | 200 | 6023936 | Y | S08 |
| 1190 | IRAS 04516-6902 | 04 51 29.02 | -68 57 49.7 | 04516-6902 | 200 | 6020096 | Y | S08 |
| 1191 | WOH S 60 | 04 53 30.86 | -69 17 49.9 | GV 60 | 40159 | 22402560 | Y | |
| 1192 | IRAS 04509-6922 | 04 50 40.46 | -69 17 31.9 | 04509-6922 | 200 | 6022400 | Y | S08 |
| 1193 | MSX LMC 1193 | 04 50 23.40 | -69 37 56.6 | IRAS04506-6942 | 30788 | 19009792 | Y | |
| 1207 | LHA 12-N 89 | 04 55 06.58 | -69 17 08.5 | Cluster-022 | 40650 | 23888896 | N | |
| 1225 | MSX LMC 1225 | 04 57 47.98 | -66 28 44.8 | Cluster-007 | 40650 | 23881984 | N | |
| 1247 | PGMW 3123 | 04 56 47.04 | -66 24 31.3 | lmc-hii-34 | 40159 | 22469632 | Y | |
| 1278 | IRAS 05009-6616 | 05 01 04.42 | -66 12 40.3 | IRAS 05009-6616 | 3505 | 12929536 | Y | Z06 |
| 1296 | HD 32364 | 04 57 14.33 | -68 26 30.5 | HD 32364 | 30869 | 19150592 | Y | |
| 1302 | IRAS 04589-6825 | 04 58 46.27 | -68 20 42.7 | IRAS04589-6825 | 30788 | 19010304 | Y | |
| 1438 | HD 269997 | 05 41 21.19 | -69 04 38.6 | HD 269997 | 40159 | 22440704 | N | |
| 1453 | IRAS 05506-7053 | 05 49 56.54 | -70 53 11.8 | IRAS05506-7053 | 30788 | 19005952 | Y | |
| 1651 | MSX LMC 1651 | 06 02 45.10 | -67 22 43.3 | LI-LMC 1817hhFor these objects, the target name does not match the position observed, possibly due to misidentification or peakup failure. In all cases, the position observed matches the position of the MSX LMC source. | 1094 | 6078208 | Y |
All of the targets except MSX LMC 500 were observed with the low-resolution (SL and LL) modules of the IRS. They extend from 5.2 – 14 µm (SL) and 14 – 38 µm (LL), with resolving powers of 64 – 128. The SL module has a slit width of 3.6 – 3.7″, and the LL module a slit width of 10.5 – 10.7″. The raw data were processed through the Spitzer pipeline versions S15.3 or later. After pipeline processing, the basic calibrated data (BCDs) were cleaned for rogue pixels, using the IRSCLEAN software222IRSCLEAN was written by the IRS GTO team (G. Sloan, D. Devost, & B. Sargent). It is distributed by the Spitzer Science Center at Caltech.. For objects observed in staring mode (all except MSX LMC 1247), spectra were extracted using the SMART software333SMART was developed by the IRS Team at Cornell University and is available through the Spitzer Science Center at Caltech. (Higdon et al., 2004). Where multiple exposures were obtained, the two-dimensional spectral images (BCDs) of the multiple exposures were median-combined. Off-source regions of each spectral image served as sky background for the spectral image obtained with each module. Spectra were extracted and the fluxes were calibrated in SMART using the default point source extraction apertures. The modules at each nod position were merged and the edges and overlapping regions of the modules were trimmed. The spectra from the two nod positions were then averaged to produce the final spectrum. Uncertainty images are provided by the SSC pipeline and propagated through SMART to produce the uncertainties on the final spectra.
For 11 sources, a flux jump of 5% was observed between the SL and LL module spectra (14 µm). These were due to extended emission falling in the IRS slits and the differing widths of the SL and LL slits (see, e.g., Paper I). In most cases, the LL spectrum was scaled down to match the SL spectrum, but for the sources identified as H II regions the SL was scaled up to match the LL spectrum (§3).
One source, MSX LMC 1247, was observed in mapping mode. For each module and order (SL1, SL2, LL1, and LL2), a spectral cube was constructed using the Cubism software (Smith et al., 2007). Individual BCDs were background subtracted, using the corresponding off-source module, and corrected for bad pixels before the cubes were built. One-dimensional spectra were then extracted by integrating over a 10″ region around the source in each cube.
MSX LMC 500 was observed with the SL module and both high resolution modules (SH and LH) of the IRS. The high resolution modules produce spectra covering 10 – 19 µm (SH) and 19 – 37 µm (LH), with a resolving power of 600. The reduction of the high resolution modules was carried out in the same manner as for the low resolution data, except for the background subtraction and the extraction aperture. No separate sky observations were taken for these data, so the sky background as a function of wavelength was estimated using SPOT and subtracted from the spectra after extraction. The high resolution spectra were extracted and fluxes calibrated using the default full extraction aperture in SMART. There are mismatches in flux between the orders in the LH spectrum which are most likely due to poor sky subtraction. These were rectified by scaling the longer wavelength order to match the shorter wavelength order. No such mismatches are observed in the SH spectrum, though the SH spectrum was divided by a factor of 1.2 to match the SL spectrum.
3 SPECTRA AND CLASSIFICATIONS
In this section we present the previously unpublished spectra and classify them according to their spectral features. Table 2 lists the predicted JHK8 object classes from Paper II, the dominant spectral features and luminosity we determined from the IRS spectrum, and the ‘actual’ (most probable) object class based on the available information, for the 44 archival sample objects for which data are published or available (see §2 and Table 1). We note that, for the previously published spectra, our classifications agree with those of the publishing authors in all cases except two (MSX LMC 1190 and 1192; see §3.1.1), for which we adopt the classification of Sloan et al. (2008). Infrared (1 – 100 µm) luminosities were estimated from the IRS spectra and 2MASS photometry using the method outlined in Paper I. Typical uncertainties in the luminosity for the stellar sources are up to 15%, ignoring the effects of variability, but may be a factor of a few for the compact H II regions, where the bulk of the luminosity comes from wavelengths longer than the IRS spectral range. In the following subsections, we discuss the spectral classifications arranged according to object class.
| MSX LMC | JHK8aaPaper II color-color classification. | SpectralbbSpectral features refers to the dominant dust features in the IRS spectrum which are usually unambiguous. The object class refers to our classification of the object, based on its spectral features and other information, which is somewhat more uncertain. | Ref.ccS08: Sloan et al. 2008; S06: Speck et al. 2006; Z06: Zijlstra et al. 2006. | Fig. | LIR | ObjectbbSpectral features refers to the dominant dust features in the IRS spectrum which are usually unambiguous. The object class refers to our classification of the object, based on its spectral features and other information, which is somewhat more uncertain. |
|---|---|---|---|---|---|---|
| number | Class | Features | ( L⊙) | Class | ||
| 283 | - | O-RICH | S08 | O AGB | ||
| 1190 | - | O-RICH | S08 | O AGB | ||
| 1192 | GMV: | O-RICH | S08 | O AGB | ||
| 811 | C AGB: | O-RICHddThese objects show silicate self-absorption. | S08 | OH/IR | ||
| 936 | C AGB | O-RICHddThese objects show silicate self-absorption. | S08 | OH/IR | ||
| 1171 | C AGB: | O-RICHddThese objects show silicate self-absorption. | S08 | OH/IR | ||
| 43 | RSG | O-RICH | S08 | RSG | ||
| 461 | RSG/GMV | O-RICHeeThe LL spectrum is contaminated by emission from a nearby source blended with that of MSX LMC 461. See text for details. | this paper | 1 | 18: | RSG |
| 805 | RSG | O-RICH | S08 | RSG | ||
| 886 | - | O-RICH | this paper | 1 | 10 | RSG |
| 1117 | RSG/GMV | O-RICH | this paper | 1 | 11 | RSG |
| 1191 | RSG | O-RICHffSurrounded by H II region. | this paper | 1 | 7.0 | RSG |
| 500 | H ii | O-RICHffSurrounded by H II region. | this paper | 1 | 16 | RSG? |
| 262 | C/O AGB: | O-RICH | this paper | 1 | 8.3 | B[e] |
| 323 | - | O-RICH | this paper | 1 | 1.7 | B[e] |
| 887 | C/O AGB: | O-RICH | this paper | 1 | 2.6 | B[e] |
| 134 | - | PAH/O-RICH | this paper | 1 | 11 | B[e]? |
| 44 | C AGB | C-RICH | Z06 | C AGB | ||
| 47 | C AGB: | C-RICH | Z06 | C AGB | ||
| 196 | - | C-RICH | this paper | 2 | 2.3 | C AGB |
| 219 | H ii: | C-RICH | Z06 | C AGB | ||
| 223 | - | C-RICH | Z06 | C AGB | ||
| 307 | C AGB: | C-RICH | Z06 | C AGB | ||
| 341 | C AGB: | C-RICH | Z06 | C AGB | ||
| 349 | - | C-RICH | Z06 | C AGB | ||
| 441 | - | C-RICH | Z06 | C AGB | ||
| 560 | C AGB | C-RICH | S08 | C AGB | ||
| 601 | - | C-RICH | Z06 | C AGB | ||
| 635 | - | C-RICH | Z06 | C AGB | ||
| 692 | C AGB | C-RICH | Z06 | C AGB | ||
| 733 | C AGB: | C-RICH | S08 | C AGB | ||
| 1130 | C/O AGB | C-RICH | S06 | C AGB | ||
| 1278 | C AGB: | C-RICH | Z06 | C AGB | ||
| 1302 | H ii? | C-RICH? | this paper | 2 | 0.2: | C AGB? |
| 1453 | C AGB: | C-RICH | this paper | 2 | 1.7 | C AGB |
| 1651 | C AGB: | C-RICH | this paper | 2 | 1.2 | C AGB |
| 198 | H ii | PAH | this paper | 3 | 2.6 | H ii |
| 646 | H ii: | PAH | this paper | 3 | 1.7 | H ii |
| 1247 | H ii | PAH | this paper | 3 | 10 | H ii |
| 1296 | H ii | PAH | this paper | 3 | 5.4 | H ii |
| 46 | - | PAH | this paper | 4 | 1.6 | YSO? |
| 771 | C AGB | PAH? | this paper | 4 | 2.5 | YSO? |
| 1184 | C AGB | PAH | S08 | YSO | ||
| 1193ggThis object was not detected due to mispointing. | C AGB |
3.1 Oxygen-rich objects
We group the classes of object that have oxygen-rich dust chemistry together, and discuss them in the following subsubsections. Seventeen objects were identified as having oxygen-rich dust chemistry from their IRS spectra. Figure 1 shows the 9 spectra that have not previously been published. Stars with oxygen-rich circumstellar dust show broad silicate features at 9.7 and 18 µm, usually in emission. While oxygen-rich circumstellar dust is easy to identify on the basis of its mid-IR spectral features, classifying the nature of a visually obscured star with an O-rich circumstellar envelope as an AGB star or a red supergiant requires an assessment of its bolometric luminosity. The O-rich objects in this sample include 3 O-rich AGB stars, 3 OH/IR stars, 7 red supergiants (RSGs), one of which is a tentative classification, and 4 dusty, early-type stars. We now discuss each of these subcategories describing individual objects and spectra where appropriate.


3.1.1 O-rich asymptotic giant branch stars
Three of the O-rich stars listed in Table 2, MSX LMC 283, 1190, and 1192, were classified as AGB stars by Sloan et al. (2008). MSX LMC 283 has an IR luminosity 1.4 L⊙, and is clearly an AGB star. MSX LMC 1190 and 1192 both have IR luminosities L⊙, just above the classical limit for AGB stars, suggesting they are RSGs; however, we adopt the classification of Sloan et al. (2008), who class these two stars as O-rich AGB stars on the basis of their amplitudes of K-band variability.
3.1.2 OH/IR stars
Three oxygen-rich sources show silicate self-absorption at 9.7 µm. All three, MSX LMC 811, 936, and 1171, are classified as OH/IR stars — i.e., O-rich AGB stars with especially optically thick circumstellar envelopes and that display OH maser emission — by Sloan et al. (2008).
3.1.3 Red supergiants
Seven objects were classified as red supergiants (RSGs) on the basis of
their Spitzer spectral features and luminosity. These objects all
have estimated luminosities 7.0 L⊙.
MSX LMC 43 and MSX LMC 805: These
stars are classified as RSGs by Sloan et al. (2008).
MSX LMC 461: The rising SED of RSG MSX LMC 461 above
20 µm is likely due to a contaminating source in the LL
module slits. The 24 µm SAGE image shows that MSX LMC 461 is
in a cluster at the center of an H II region, with 3 bright
24 µm sources within 25″. The nearest of these is
separated by 11″ according to the SAGE 24 µm catalog. The
24 µm flux of the contaminating source is 347 mJy, making it
slightly brighter than MSX LMC 461 (335 mJy), but it does not appear
in the IRAC catalog or images, indicating it is very red. An overlay
of the observed slit positions on the 24 µm image indicates this
source fell in the LL slits. Examination of the LL1 and LL2 spectral
images reveals that two blended sources separated by 2 pixels
(5.1″/pixel) can be distinguished at the shorter wavelengths
(27 µm). As these sources are heavily blended, no
attempt was made to separate their spectra. In addition, the SAGE
70 µm image shows diffuse emission due to cold dust in the
surrounding H II region, which may also have contaminated the longer
wavelengths of the IRS spectrum. Therefore, the luminosity for
MSX LMC 461 was estimated using only the SL module spectra (5.2 –
14 µm). While the luminosity is therefore somewhat uncertain, it
is still sufficiently high (: L⊙) to confidently
classify it as an RSG. The LL spectrum was scaled by 0.94 to match the
SL spectrum.
MSX LMC 886: Although the JHK8 colors and magnitudes of
MSX LMC 886 are more similar to O-rich AGB stars than RSGs, we
estimate its IR luminosity to be 105 L⊙, and Wood et al. (1992)
identify it as a probable core He-burning supergiant as it shows no
large-amplitude variability.
MSX LMC 1117: This star has a luminosity of L⊙, placing it clearly in the RSG category.
MSX LMC 1191: We classify this star as a RSG due to its
luminosity of L⊙. This unusual spectrum, with a
flat mid-IR slope, is reminiscent of sources with dust disks (see
Kastner et al. 2006) and, since these are of special interest,
MSX LMC 1191 warrants further investigation. No contaminating source
is readily apparent in the spectral image of MSX LMC 1191. This
object appears point-like in the SAGE 24 µm image, although
there is faint [Ne II] 12.8 µm, [S III] 18.7 µm, and [S III] 33.5 µm emission off-source and a
small SL/LL jump suggests extended emission is associated with the
source. The LL spectrum was scaled by 0.90 to match the SL
spectrum.
MSX LMC 500: This star appears to be a mass-losing O-rich
evolved star within an H II region. The spectrum clearly shows
silicate features in emission, but also has a rising continuum, and
features typical of H II regions, including PAH features at
6.2 µm, 7.7 µm, and 11.2 µm, and emission lines [S IV] 10.5 µm,
[Ne II] 12.8 µm, [Ne III] 15.5 µm, [S III] 18.7 µm, [S III] 33.5 µm, [Si II] 34.8 µm, and [Ne III] 36.0 µm. Although it is
not included in the SAGE 24 micron point source catalog, SAGE IRAC and
MIPS images show a bright point source surrounded by strong nebulosity
at the position of MSX LMC 500. The contamination of this spectrum
by the H II region prevents certain identification of this object as
an O-rich evolved star as opposed to a massive YSO, but here we
tentatively classify it as a RSG (rather than an O-rich AGB star), on
the basis of its high luminosity ( L⊙). We note
that this classification is uncertain, as the luminosity includes a
significant contribution from the contaminating H II region.
3.1.4 Dusty, early-type stars
Three of the objects showing O-rich dust are known B[e] supergiants
(Paper II). These three, MSX LMC 262, 323, and 887, all show flat IRS
spectra with (relatively weak) silicate
features in emission (Figure 1). In addition, the source
MSX LMC 134 – which displays perhaps the most peculiar spectrum
among the IR sources considered here – is associated with a luminous
O/B star. These four sources will be discussed in more detail in a
forthcoming paper on Spitzer observations of dusty early-type stars
in the Magellanic Clouds (J. Kastner et al. 2009, in preparation).
MSX LMC 262: The spectrum of this star (HD 34664) has slowly
falling (blue) continuum and what appears to be weak silicate
features. This source is affected by contamination from diffuse line
emission, as is apparent in the spectral images, although this appears to
be effectively removed by the sky subtraction. The rising continuum
above 29 µm is attributable to a nearby contaminating
source, observed in IRAC and MIPS images, which is very red and
blended with MSX LMC 262. The LL spectrum was scaled by 0.96 to match the SL
spectrum.
MSX LMC 323: MSX LMC 323 (LHA 120-S 93) shows the strongest
silicate emission features among the 3 B[e] supergiants with spectra
in Figure 1. There is a small jump in flux density between the SL and
LL modules, consistent with faint diffuse emission in the LL module
spectral images; however no narrow emission lines are observed in the
sky or the stellar spectrum. The LL spectrum was scaled by 0.85 to
match the SL spectrum.
MSX LMC 887: In addition to the broad silicate features, this
star (HD 38489) shows narrow emission lines that we identify as
[Ne III] 15.5 µm and [S III] 18.7 µm. Examination of the spectral images indicates
that these lines arise from extended, diffuse emission and not from
the star itself. Also present in the images are emission lines of
[S IV] 10.5 µm, [Ne II] 12.8 µm, [S III] 33.5 µm, and [Si II] 34.8 µm, which are too weak to show up in the
extracted stellar spectrum. The spectrum of MSX LMC 887 also shows a
large jump in flux density (a factor of 5) between the SL and LL
modules, most likely due to extended emission apparent in the LL
module spectral images. The LL spectrum was scaled by 0.21 to match
the SL spectrum. SAGE 8 µm and 24 µm images show this
star to be a point source surrounded by nebulous emission associated
with a H II region, consistent with the presence of the ionized gas
seen in the spectral images.
MSX LMC 134: This star (HD 269006) shows a peculiar spectrum
with very strong silicate emission feature, strong PAH emission at
6.2 µm and 7.7 µm, and a steeply rising continuum that
flattens above 20 µm. This flattened spectral shape is
suggestive of a dust disk with a large central hole or gap.
3.2 Carbon-rich AGB stars
Nineteen of the objects in the archival sample are classified as carbon-rich on the basis of their Spitzer IRS spectra. They are characterized by an absorption feature at 8 µm due to C2H2 and HCN, a SiC dust emission feature at 11.3 µm, a narrow absorption feature at 13.7 µm due to C2H2 gas, and a broad emission feature around 26 – 30 µm attributed to MgS (Goebel & Moseley, 1985; Hony et al., 2002). Figure 2 shows the IRS spectra of the 4 objects for which IRS data have not previously been published (see Tables 1 and 2). The references for the remaining 15 are listed in Table 2. The LL spectrum of MSX LMC 1651 was scaled by 0.91 to match the SL spectrum.
The classification of MSX LMC 1302 is somewhat uncertain, due to the relatively low signal-to-noise of the spectrum and the presence of a large (factor 5) jump between the SL and LL modules. The LL spectrum was scaled by a factor 0.19 to match the SL spectrum. This jump is most likely due to diffuse extended emission that is due to cool dust, as seen in the SAGE 8.0 µm and 24 µm images as well as in the LL spectral images. The LL images also reveal [S III] 33.5 µm and [Si II] 34.8 µm emission surrounding the source, but this emission is too weak to be apparent in the spectrum.

3.3 Compact H II regions
Figure 3 shows the spectra of the 4 objects identified as compact H II regions or candidate compact H II regions on the basis of their IRS spectra. These sources are characterized by very red continua, strong PAH emission features at 6.2, 7.7, 8.6, 11.3, and 12.7 µm, silicate absorption at 9.7 µm, and the following lines of ionized species: [Ar III] 9.0 µm, [S IV] 10.5 µm, [Ne II] 12.8 µm, [Ne III] 15.5 µm, [S III] 18.7 µm, [S III] 33.5 µm, [Si II] 34.8 µm, and [Ne III] 36.0 µm. All these sources except MSX LMC 1247 also show a flux difference at 14 µm between the SL and LL modules, due to their extended nature; in Figure 3, the SL spectra have been scaled by factors 1.4 – 2.6 to match the LL fluxes. No flux jump is seen in MSX LMC 1247 as it was observed in mapping mode.

3.4 Young Stellar Objects and Candidates
One star in the sample, MSX LMC 1184, has been classified as a young
stellar object (YSO) based on its optical and IR properties
(Sloan et al., 2008). It shows a red continuum, similar to H II regions,
with PAH emission and silicate absorption features, but lacks the
narrow ionized line emission observed in H II regions. We find two
more objects in the sample with somewhat similar IR spectra, and group
them here with 1184, though we note their classification as candidate
YSOs is very tentative.
MSX LMC 46: The spectrum of this star resembles the spectrum
of YSO MSX LMC 1184 presented by Sloan et al. (2008), and shows much weaker
line emission and PAH features than the H II regions, which have
similar red continua (Figure 4). The LL spectrum was
scaled by 0.74 to match the SL spectrum. Figure 5 shows
the SL spectrum of MSX LMC 46, with a spline-fitted continuum
subtracted to highlight the PAH features and silicate absorption. It
is possible this object is a high-mass protostar in transition from
the embedded young stellar object (YSO) stage to the zero-age main
sequence.
MSX LMC 771: MSX LMC 771 shows a similar continuum shape to
MSX LMC 1184 (Figure 4), but the nature of this source
is uncertain. The only clear spectral feature in this spectrum is
silicate absorption at 9.7 µm. The silicate absorption profile is
more sharply peaked, and the PAH features are significantly weaker
than in MSX LMC 1184 and 46. This source may be a compact
H II region, though it lacks the lines of ionized species normally
observed in the spectra of H II regions. Weak emission lines
[Ne III] 15.5 µm, [S III] 18.7 µm, [S III] 33.5 µm, and [Si II] 34.8 µm, and lines at 16.4 µm and
17.1 µm, are apparent in the spectral images, but do not appear
in the extracted spectrum. SAGE 8 and 24 µm images show this
object to be a bright point source located within a nebulous region.
It is possible this source is an embedded YSO. The LL spectrum was
scaled by 0.94 to match the SL spectrum.
MSX LMC 1184: This star has been identified as a young stellar
object (YSO; Sloan et al. 2008; van Loon et al. 2005), based on its optical and IR
spectral features and its IR colors. This source shows a red
continuum, with PAH emission features and silicate absorption at
9.7 µm.


3.5 Unclassified sources
The observation of MSX LMC 1193 was mispointed; therefore this object was not detected and could not be classified.
4 CHECKING AND IMPROVING THE JHK8 CLASSIFICATIONS
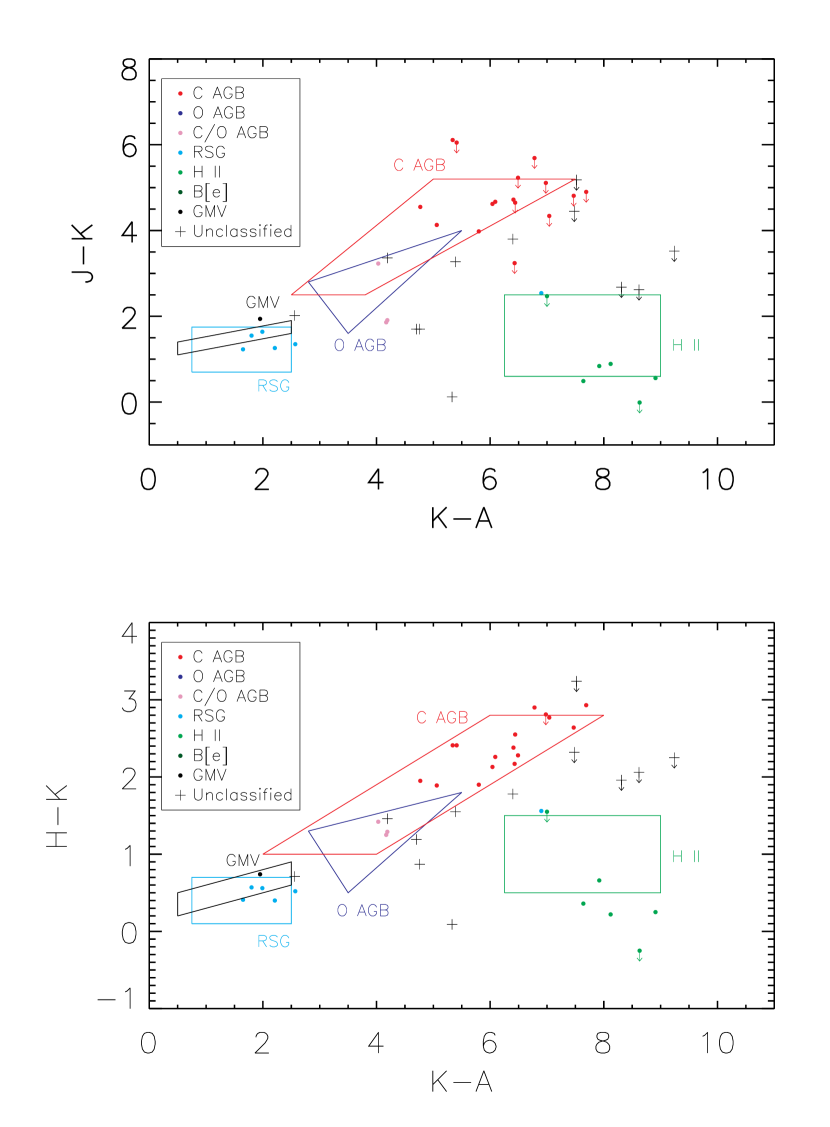
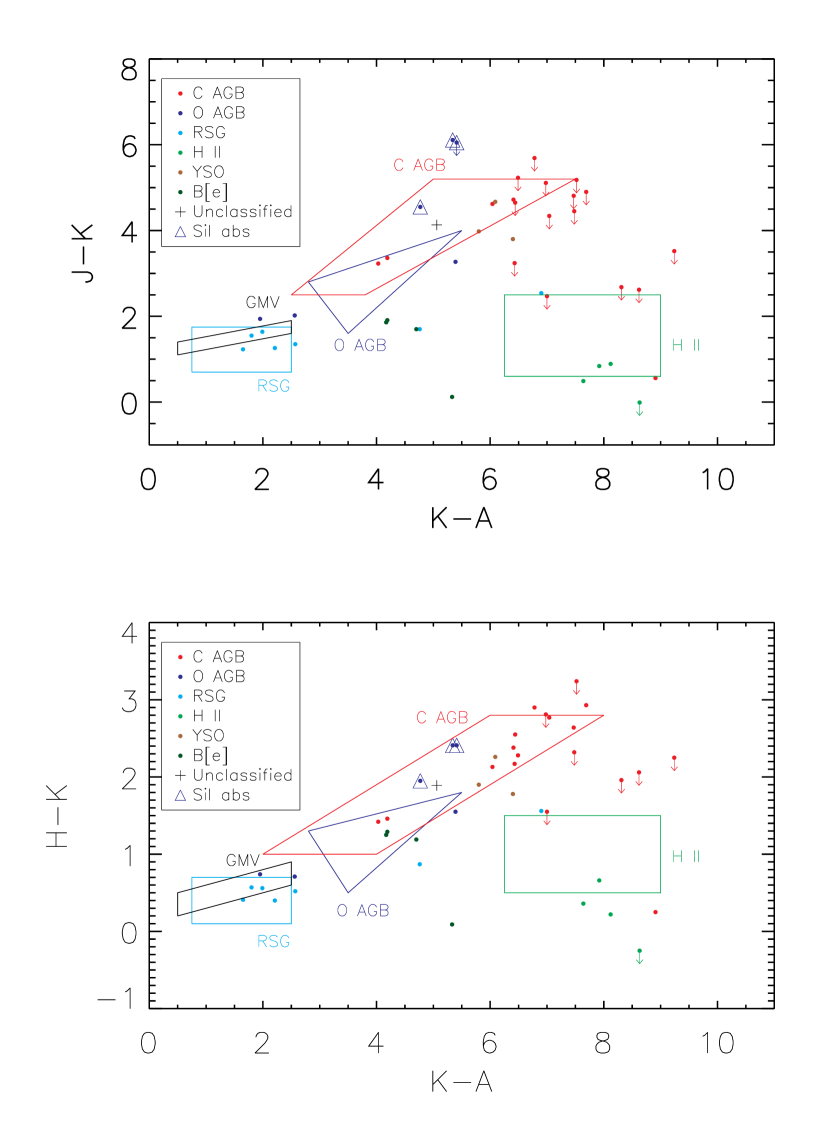
We now compare the spectral classifications described in §3 with the classifications of the same sources based on JHK8 scheme (Paper II). Where the JHK8 prediction (column 2 of Table 2) matches the actual classification (column 7), the prediction is considered correct. JHK8 classifications are considered incorrect where column 2 does not match column 7. For these purposes, uncertain JHK8 predictions (indicated by a colon in column 2) are considered the same as firm predictions. Where the JKH8 class was ambiguous due to overlaps in the classification boxes (e.g., RSG/GMV), we consider the prediction to be “correct but ambiguous” if one of the two classes in column 2 matches the classification in column 7. Objects for which no JHK8 classification was possible (due to their location outside the boxes in color-color plots) are considered neither correct nor incorrect. Figure 6 shows the locations and JHK8 classifications of the 44 objects with published or available archival spectra in the 2MASS/MSX color-color diagrams, along with the JHK8 diagnostic regions used previously to classify the object classes (Paper II). Figure 7 shows the IRS-based spectral classifications of the archival objects in the 2MASS/MSX color-color diagrams. 2MASS/MSX magnitudes of all sources are given in Paper II.
In summary, of the sample of 44 objects, the JHK8 scheme correctly prediction the classification for 17 sources, and a further 5 had correct but ambiguous classifications, where we have included C/O AGB as an ambiguous match for the dusty early-type stars. Nine sources had incorrect classifications. Twelve objects had no JHK8 classification and, as noted earlier, one source could not be classified on the basis of its IRS spectrum.
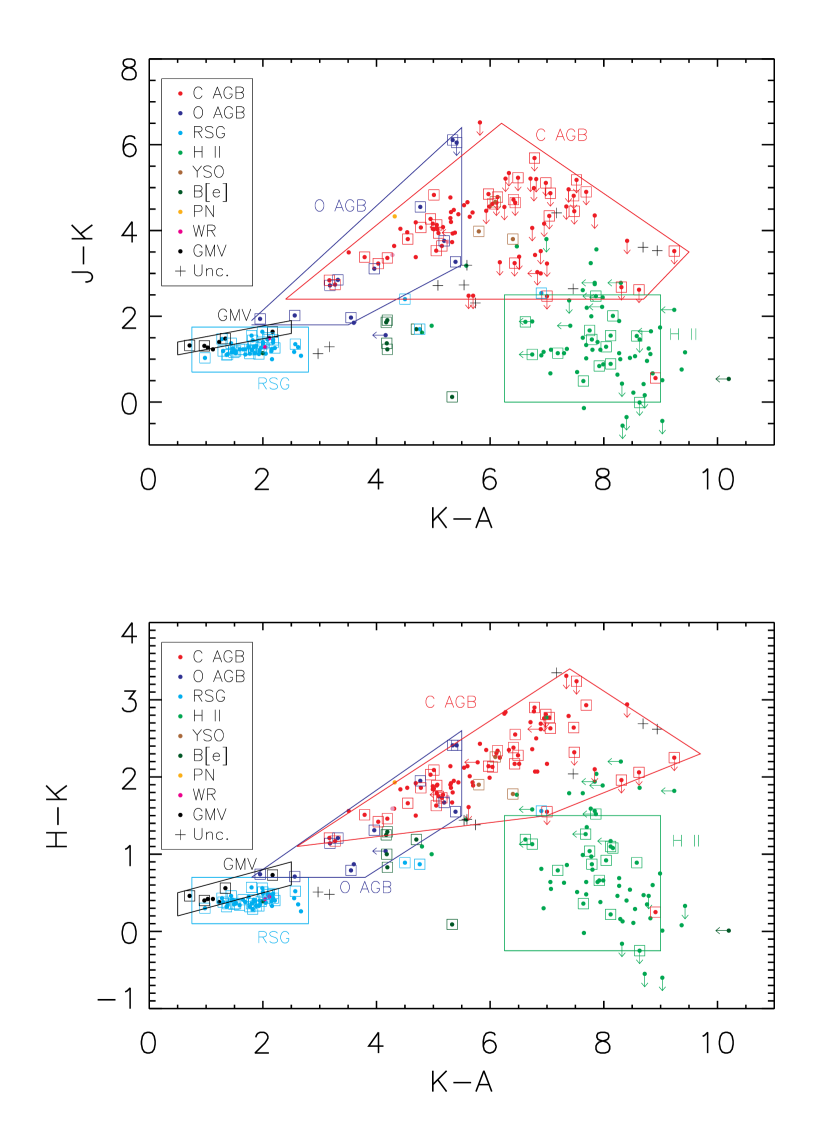
In the following subsections we discuss the JHK8 classifications of each object class in more detail. We combine the new IRS-based classification results with those obtained in Paper I so as to revise and expand the JHK8 classification boxes. The color-color diagrams of the whole sample of 250 objects are shown in Figure 8, with the expanded classification boxes. The revised classification criteria are listed in Table 3.
| Class | Criteria | |
|---|---|---|
| JK vs. KA colors | ||
| RSG | 0.75 (KA) 2.7 | 0.7 (JK) 1.75 |
| O AGB | 2.0 (JK); (KA) 5.5 | [0.7 (KA) - 0.65] (JK) [1.24 (KA) - 0.42] |
| C AGB | [0.93 (JK) + 0.16] (KA) [0.73 (JK) + 6.95] | 2.4 (JK) [0.91 (KA) +12.15] |
| H ii | 6.25 (KA) 9.0 | 0.0 (JK) 2.5 |
| Expanded H ii | 6.0 (KA) 9.5 | (JK) 3.0 |
| GMV | 0.5 (KA) 2.5 | [0.25 (KA) + 0.975] (JK) [0.25 (KA) + 1.275] |
| HK vs. KA colors | ||
| RSG | 0.75 (KA) 2.7 | 0.1 (HK) 0.7 |
| O AGB | 0.7 (HK); (KA) 5.5 | [0.47 (KA) - 1.09] (HK) [0.51 (KA) - 0.21] |
| C AGB | [2.08 (HK) + 0.31] (KA) [3.33 (HK) + 2.0] | [0.09 (KA) + 0.86] (HK) [0.48 (KA) +6.94] |
| H ii | 6.25 (KA) 9.0 | 0.25 (HK) 1.5 |
| Expanded H ii | 6.0 (KA) 9.5 | (HK) 2.0 |
| GMV | 0.5 (KA) 2.5 | [0.2 (KA) + 0.1] (HK) [0.2 (KA) + 0.4] |
| Class | Criteria | |
|---|---|---|
| [3.6][4.5] vs. [5.8][8.0] colors | ||
| RSG | [-1.00 ([3.6][4.5]) + 0.20] [5.8][8.0] [-1.00 ([3.6][4.5]) + 1.00] | [1.29 ([5.8][8.0]) - 0.95] [3.6][4.5] [1.29 ([5.8][8.0]) - 0.37] |
| O AGB | [-1.00 ([3.6][4.5]) + 1.40] [5.8][8.0] [-1.25 ([3.6][4.5]) + 2.06] | [9.00 ([5.8][8.0]) - 10.6] [3.6][4.5] [1.25 ([5.8][8.0]) - 0.40] |
| C AGB | [-0.50 ([3.6][4.5]) + 0.73] [5.8][8.0] [-0.43 ([3.6][4.5]) + 2.14] | [1.39 ([5.8][8.0]) - 0.42] [3.6][4.5] [1.44 ([5.8][8.0]) - 0.08] |
| [5.8][8.0] vs. [8.0][24] colors | ||
| RSG | [-2.12 ([5.8][8.0]) + 2.33] [8.0][24] [-2.67 ([5.8][8.0]) + 4.59] | [0.38 ([8.0][24]) -0.43] [5.8][8.0] [0.55 ([8.0][24]) -0.18] |
| O AGB | [-5.94 ([5.8][8.0]) + 8.15] [8.0][24] [-1.11 ([5.8][8.0]) + 4.14] | [5.8][8.0] [0.53 ([8.0][24]) -0.13] |
| C AGB | 0.42 ([5.8][8.0]) ; [8.0][24] [-0.45 ([5.8][8.0]) + 3.04] | [0.56 ([8.0][24]) -0.20] [5.8][8.0] [0.41 ([8.0][24]) +0.44] |
| JK vs. [3.6][4.5] colors | ||
| RSG | [-0.08 (JK) - 0.09] [3.6][4.5] [-0.06 (JK) + 0.41] | [0.40 ([3.6][4.5]) + 0.86] JK [0.39 ([3.6][4.5]) + 1.68] |
| O AGB | [0.10 (JK) - 0.05] [3.6][4.5] [0.15 (JK) + 0.17] | 1.9 JK 6.2 |
| C AGB | [0.50 (JK)] [3.6][4.5] [0.18 (JK) - 0.05] | [-0.75 ([3.6][4.5]) + 3.02] JK [4.27 ([3.6][4.5]) + 12.54] |
4.1 Oxygen-rich objects
Of the 17 objects with O-rich dust chemistry, 12 had JHK8 classifications (Table 2). Of these, 3 classifications were correct and a further 4 were ambiguously correct, while 5 were incorrect. The classes of O-rich object are discussed in the following subsubsections.
4.1.1 O-rich asymptotic giant branch stars
Of the three sources classified as O-rich AGB stars on the basis of IRS spectra (Table 2), MSX LMC 1192 had a tentative JHK8 classification of GMV, while MSX LMC 283 and 1190 were previously unclassified by the JHK8 scheme. Thus none of these three sources lies in the previous (Paper II) O AGB classification box.
The IR colors of MSX LMC 283 (see Table 1 of Paper II) place it redward (in K-A) of the ambigous overlap region of the O-rich and C-rich AGB stars. On the basis of the location of MSX LMC 283, we extend the O AGB box to the right in K-A (Figure 8). As the overlap area between O-rich and C-rich AGB stars now covers a large fraction of the region occupied by O-rich AGB stars, the classification of the majority of the O-rich AGB stars in a IR-luminous stellar population solely on the basis of their JHK8 colors will be ambiguous. However, the increased overlap is largely due to the location of the OH/IR stars (§4.1.2) and many of the O-rich AGB stars lie outside the overlap region. In addition, as discussed in Paper II, the O-rich and C-rich stars seem to be well-distinguished by their [8]-[24] µm SAGE colors (see §4.5).
MSX LMX 1190 and 1192 lie near the RSG classification box in the JHK8 scheme, bluer in K-A than the O-rich AGB box by 1 mag. On the basis of the colors of MSX LMC 1190 and 1192, we extend the O AGB box to bluer K-A, covering the region between the previous O-rich AGB star and RSG classification boxes, and leading to a small overlap between the O AGB and GMV boxes. For objects in this region, additional information, such as the K magnitude, is necessary to determine the nature of the object.
4.1.2 OH/IR stars
The three OH/IR stars, MSX LMC 811, 936, and 1171, were all incorrectly classified by the JHK8 scheme as carbon-rich AGB stars. These stars show silicate self-absorption indicative of optically-thick dust shells due to high mass-loss rates. Their locations in the color-color diagrams (Figure 7) are indicative of increasingly strong self-absorption due to high mass-loss rates.
These objects lie above most carbon stars in the 2MASS/MSX color-color diagrams (i.e., for a given K-A color, the three OH/IR stars are generally redder in J-K and H-K than carbon stars) but are nevertheless within or above the JHK8 diagnostic box for C-rich AGB stars, suggesting that for modestly self-absorbed objects, spectroscopy or additional photometry may be necessary to distinguish OH/IR stars from carbon stars. The O-rich AGB classification box has been expanded to include these objects, increasing the ambiguous overlap region between carbon-rich and oxygen-rich objects (Fig. 8).
4.1.3 Red Supergiants
Of the 7 RSGs, three were correctly classified as RSGs on the basis of JHK8 colors and two (MSX LMC 461 and 1117) had correct but ambiguous classifications of RSG/GMV. One object, MSX LMC 500, was incorrectly classified as an H II region and one object, MSX LMC 886, was not classifiable via JHK8 colors.
MSX LMC 500 was most likely misclassified due to the surrounding nebulous dust emission contaminating the JHK8 colors (see §3.1.3), as it lies close to the H II region classification box, 5 magnitudes redder in K-A than typical RSGs. MSX LMC 886 lies 2 magnitudes redder in K-A than typical RSGs, quite close to the O-rich AGB classification box. The Paper II RSG classification box covers the region of color-color space occupied by most of the RSGs and was not expanded or altered on the basis of the position of MSX LMC 500 or 886.
4.1.4 Dusty, early-type stars
Of the four dusty, early-type stars, two had correct but ambiguous JHK8 classifications, and two were unclassifiable via the JHK8 scheme. The former two, MSX LMC 262 and 887, lie within the O-rich AGB and C-rich AGB classification boxes in H-K vs. K-A but not J-K vs K-A (Fig. 8). The latter two objects, MSX LMC 323 and 134, have similar colors to 262 and 887 but lie outside the classification boxes. No dusty, early-type star classification box is defined, due to the small number of objects.
4.2 Carbon-rich AGB stars
Of the 19 C-rich sources, 10 were correctly classified as carbon-rich on the basis of their JHK8 colors, and one (MSX LMC 1130) was correctly but ambiguously classified as either C- or O-rich. Six objects lay outside the classification boxes in Figure 6 and so had no JHK8 classification, while two sources (MSX LMC 219 and 1302) were incorrectly classified as H II regions on the basis of their JHK8 colors.
The 6 C-rich AGB stars which could not be classified under the JHK8 system lie near the C-rich AGB diagnostic box (Figure 7) but have redder JKH8 colors. This region of color space was not covered by our Paper I observations but, on the basis of the new spectral data, we may now extend the C-rich AGB star classification region to include objects with K-A6.5, J-K2.5, and H-K1.5. The revised C AGB box covers the space between the Paper II C AGB box and the H II region classification box and results in a small overlap between the boxes (Figure 8). For objects with colors in the overlap region, imaging aimed at distinguishing between diffuse vs. point-like emission would be essential in the absence of spectroscopy to determine unambiguous classifications.
One of the two C-rich AGB stars which was incorrectly classified as an H II region (MSX LMX 219) lies in the overlap region between the C AGB and H II region boxes. The other star, MSX LMC 1302, lies well within the H II region classification box and away from the other C-rich AGB stars. The C AGB box was not extended to include 1302, due to the uncertainty of its classification and, in particular, the possibility that it may be a pre-planetary nebula.
4.3 Compact H II regions
For the four confidently classified H II regions, the JHK8 color scheme correctly predicted the spectral classification. The location of these objects expands the H II region classification box to bluer J-K and H-K colors (Fig. 8).
4.4 Young Stellar Objects and Candidates
Of the three YSO or YSO candidates in the sample, two were incorrectly classified as C-rich AGB stars by the JHK8 scheme and the other had no JHK8 classification. Although they resemble H II regions in their mid-IR spectra, MSX LMC 46, 771, and 1184 have redder J-K and H-K colors than H II regions. All three objects lie near each other and within the revised C AGB classification box. No YSO classification box is defined due to the small number of objects and the uncertain nature of their classifications.
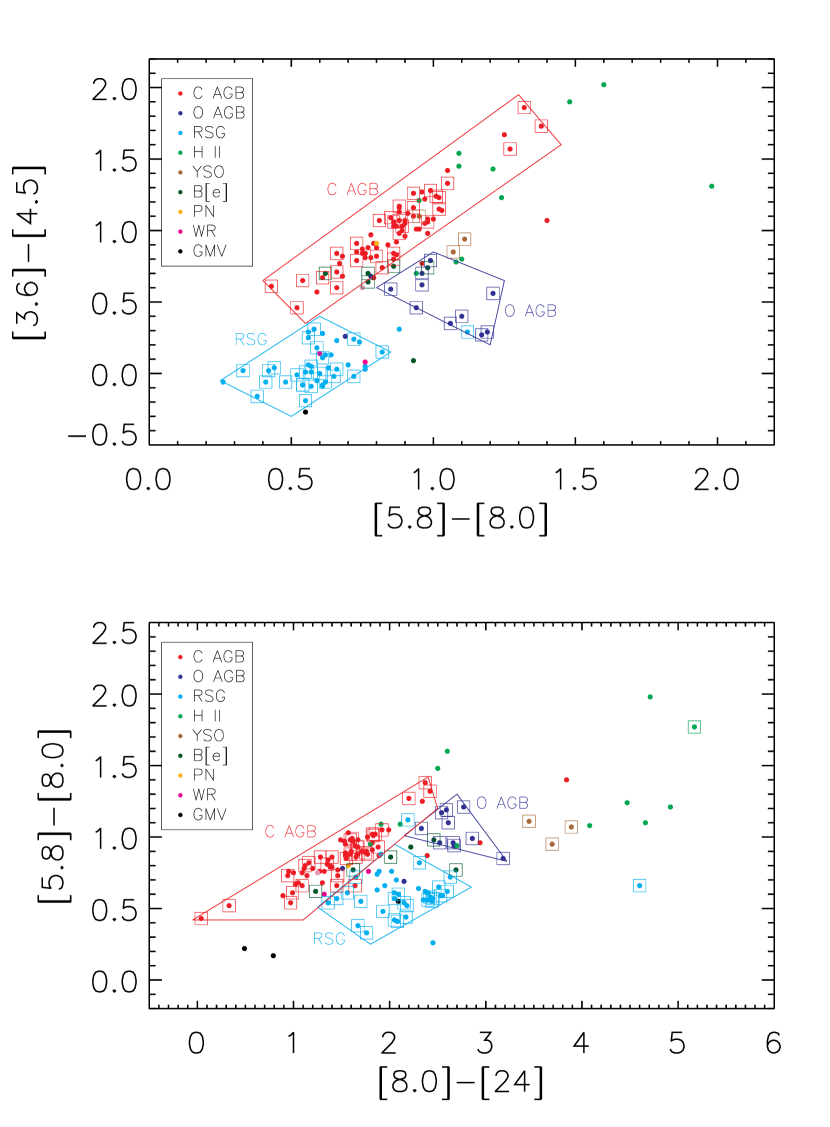
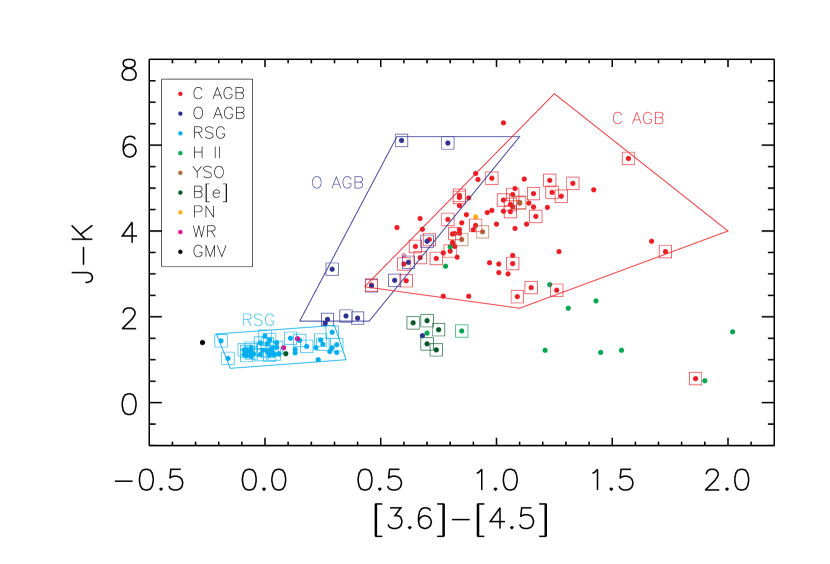
4.5 Spitzer IRAC/MIPS classification of IR-luminous point sources
Figure 10 shows Spitzer IRAC/MIPS color-color diagrams for the sources in the whole sample of 250 objects with SAGE counterparts (see Paper II). Diagnostic regions defined by the spectroscopically classified objects are shown in Figure 10 and the corresponding IRAC/MIPS classification criteria for luminous IR sources, revised according to the IRS spectral classification results reported here, are listed in Table 4. As noted in Paper II, Spitzer IRAC and IRAC/MIPS color-color diagrams such as those in Fig. 9 provide better discrimination between carbon-rich and oxygen-rich AGB stars than do JHK8 color-color diagrams. This discrimination has been further improved by the IRS spectral classifications, which resulted in the reclassification of several apparent C-rich AGB stars as OH/IR stars (Table 2). Figure 10 shows the Spitzer IRAC [3.6]-[4.5] color plotted against 2MASS J-K. While this diagram shows somewhat more overlap between the C-rich and O-rich AGB stars than do the Spitzer IRAC and IRAC/MIPS diagrams (Fig. 9), the J-K vs. [3.6]-[4.5] diagram will remain useful even after Spitzer enters its warm mission, in which only the 3.6 and 4.5 µm channels will operate. We note that the outlying C-rich AGB star in the bottom right corner of the diagram (MSX LMC 1302) is excluded from the ‘C AGB’ region as its colors may be affected by extended emission. Finally, we note that the two O-rich sources with J-K6 in this diagram are OH/IR stars that show silicate self-absorption.
5 SUMMARY AND CONCLUSIONS
We have used archival and published IRS spectra to classify 43 IR-luminous sources in the LMC. Of the 31 objects of these 43 that have a previous (Paper II) JHK8 classification, we find that the JHK8 classifications were correct for 22 objects (71%). Of the nine objects with incorrect JHK8 classifications, four had tentative classifications.
Spectroscopic classifications of the 12 objects which were previously unclassifiable with the JHK8 diagnostics allow us to characterize new regions of the 2MASS/MSX color-color diagrams. In addition, analysis of the IRS spectra obtained for the 9 objects which were previously incorrectly classified under the JHK8 scheme allows us to revise the classification boxes so as to make JHK8 color-based classifications more reliable. The area of color space occupied by C-rich AGB stars is extended to redder K-A colors, towards the location of H II regions. Similarly — as a consequence of the reclassification of 3 objects from C-rich AGB (Paper II) to OH/IR stars (Sloan et al. 2008) — the region of color space occupied by O-rich stars has been extended, increasing the overlap area between carbon-rich and oxygen-rich stars. The H II region area has also been expanded, to bluer J-K and K-A colors. The RSG region has been extended to redder K-A colors.
Those sources whose classifications were incorrect under the Paper II JHK8 system offer insight into the use of color-based diagnostics to identify the nature of objects. Many of these objects lie in overlap regions between diagnostic boxes or towards the edges of boxes. In particular, the revised JHK8 scheme presented here reveals larger overlap in color space between AGB stars of different dust chemistries (C-rich vs. O-rich), due to the inclusion of a handful of previously misclassified OH/IR stars. In the LMC, this overlap region is dominated by carbon stars (Fig. 8) as a consequence of the LMC’s low metallicity (Paper II), resulting in a relatively low JHK8 misclassification rate overall (20%). However, in the Milky Way and external galaxies of similar metallicity, more caution must be exercised in identifying the nature of sources as C-rich vs. O-rich AGB stars based on their JHKA colors alone. Furthermore, “contamination” of photometry or spectra due to crowded fields or surrounding H II regions confuses the classification of sources located in or near star-forming regions.
However, with the important exception of O-rich AGB stars with high mass loss rates (OH/IR stars) – which are likely to be present in larger proportion (relative to high mass loss rate carbon stars) in external galaxies with higher metallicity than that of the LMC – the results presented here indicate that the revised JHK8 color classification criteria can be used to classify the most luminous IR sources in nearby galaxies with % confidence. These results therefore reinforce both the utility of the JHK8 color diagnostics and the conclusions in Paper II as to the preponderance of C-rich AGB stars and H II regions among most luminous IR sources in the LMC. In addition, the spectroscopic identifications found in this paper further reinforce the results of Paper II that Spitzer IRAC/MIPS color-color diagrams and IRAC/2MASS color-color diagrams can be used to distinguish between object classes. In particular, color-color diagrams that make use of Spitzer photometry appear to be far more effective in discriminating between O-rich and C-rich AGB stars than diagrams based solely on JHK8 colors.
References
- Blum et al. (2006) Blum, R. D., et al. 2006, AJ, 132, 2034
- Buchanan et al. (2006) Buchanan, C. L., Kastner, J. H., Forrest, W. J., Hrivnak, B. J., Sahai, R., Egan, M., Frank, A., & Barnbaum, C. 2006, AJ, 132, 1890 (Paper I)
- Cannon et al. (2006) Cannon, J. M., et al. 2006, ApJ, 652, 1170
- Egan, Van Dyk & Price (2001) Egan, M. P., Van Dyk, S. D., & Price, S. D. 2001, AJ, 122, 1844 (EVP01)
- Goebel & Moseley (1985) Goebel, J. H., & Moseley, S. H. 1985, ApJ, 290, L35
- Higdon et al. (2004) Higdon, S. J. U. et al. 2004, PASP, 116, 975
- Hony et al. (2002) Hony, S., Waters, L. B. F. M., & Tielens, A. G. G. M. 2002, A&A, 390, 533
- Houck et al. (2004) Houck, J., et al. 2004, ApJS, 154, 18
- Jackson et al. (2006) Jackson, D. C., Cannon, J. M., Skillman, E. D., Lee, H., Gehrz, R. D., Woodward, C. E., & Polomski, E. 2006, ApJ, 646, 192
- Jackson et al. (2007) Jackson, D. C., Skillman, E. D., Gehrz, R. D., Polomski, E., & Woodward, C. E. 2007, ApJ, 667, 891
- Kastner et al. (2006) Kastner, J. H., Buchanan, C. L., Sargent, B., & Forrest, W. J. 2006, ApJ, 638, L29
- Kastner et al. (2008) Kastner, J. H., Thorndike, S. L., Romanczyk, P. A., Buchanan, C. L., Hrivnak, B. J., Sahai, R., & Egan, M. 2008, AJ, 136, 1221 (Paper II)
- Meixner et al. (2006) Meixner, M., et al. 2006, AJ, 132, 2268
- Sloan et al. (2008) Sloan, G. C., Kraemer, K. E., Wood, P. R., Zijlstra, A. A., Bernard-Salas, J., Devost, D., & Houck, J. R. 2008, ApJ, 686, 1056
- Smith et al. (2007) Smith, J. D. T., et al. 2007, PASP, 119, 1133
- Speck et al. (2006) Speck, A. K., Cami, J., Markwick-Kemper, C., Leisenring, J., Szczerba, R., Dijkstra, C., Van Dyk, S., & Meixner, M. 2006, ApJ, 650, 892
- van Loon et al. (1998) van Loon, J. T., et al. 1998, A&A, 329, 169
- van Loon et al. (2005) van Loon, J. T., et al. 2005, MNRAS, 364, L71
- Wood et al. (1992) Wood, P. R., Whiteoak, J. B., Hughes, S. M. G., Bessell, M. S., Gardner, F. F., & Hyland, A. R. 1992, ApJ, 397, 552
- Zijlstra et al. (2006) Zijlstra, A. A., et al. 2006, MNRAS, 370, 1961