11email: driebe@mpifr-bonn.mpg.de 22institutetext: Laboratoire Universitaire d’Astrophysique de Nice, UMR 6525, Université de Nice/CNRS, 06108 Nice Cedex 2, France 33institutetext: European Southern Observatory, Karl-Schwarzschild-Str. 2, D-85748 Garching bei München, Germany 44institutetext: European Southern Observatory, Alonso de Cordova 3107, Vitacura, Casilla 19001, Santiago 19, Chile 55institutetext: INAF-Osservatorio Astrofisico di Arcetri, Istituto Nazionale di Astrofisica, Largo E. Fermi 5, 50125 Firenze, Italy 66institutetext: Observatoire de la Côte d’Azur/CNRS, UMR 6525 H. Fizeau, Univ. Nice Sophia Antipolis, Avenue Copernic, 06130 Grasse, France 77institutetext: Laboratoire d’Astrophysique de Grenoble, UMR 5571, Université Joseph Fourier/CNRS, 38041 Grenoble Cedex 9, France
Resolving the asymmetric inner wind region of the yellow hypergiant IRC +10420 with VLTI/AMBER in low and high spectral resolution mode††thanks: The low-spectral resolution data have been obtained as part of the Guaranteed Time Programme for VLTI/AMBER (program ID: 079.D-0356(B)), while the high-spectral resolution data were obtained in the context of science verification observations (program ID: 60.A-9053(D)).
Abstract
Context. IRC +10420 is a massive evolved star belonging to the group of yellow hypergiants. Currently, this star is rapidly evolving through the Hertzprung-Russell diagram, crossing the so-called yellow void. IRC +10420 is suffering from intensive mass loss which led to the formation of an extended dust shell. Moreover, the dense stellar wind of IRC +10420 is subject to strong line emission.
Aims. Our goal was to probe the photosphere and the innermost circumstellar environment of IRC +10420, to measure the size of its continuum- as well as the Brline-emitting region on milliarcsecond scales, and to search for evidence of an asymmetric distribution of IRC +10420’s dense, circumstellar gas.
Methods. We obtained near-infrared long-baseline interferometry of IRC +10420 with the AMBER instrument of ESO’s Very Large Telescope Interferometer (VLTI). The measurements were carried out in May/June 2007 and May 2008 in low-spectral resolution mode in the bands using three Auxillary Telescopes (ATs) at projected baselines ranging from 30 to 96 m, and in October 2008 in high-spectral resolution mode in the band around the Bremission line using three Unit Telescopes (UTs) with projected baselines between 54 and 129 m. The high-spectral resolution mode observations were analyzed by means of radiative transfer modeling using CMFGEN and the 2-D Busche & Hillier codes.
Results. For the first time, we have been able to absolutely calibrate the - and -band data and, thus, to determine the angular size of IRC+10420’s continuum- and Br line-emitting regions. We found that both the low resolution differential and closure phases are zero within the uncertainty limits across all three bands. In the high-spectral resolution observations, the visibilities show a noticeable drop across the Br line on all three baselines. We found differential phases up to -25° in the redshifted part of the Br line and a non-zero closure phase close to the line center. The calibrated visibilities were corrected for AMBER’s limited field-of-view to appropriately account for the flux contribution of IRC +10420’s extended dust shell. From our low-spectral resolution AMBER data we derived FWHM Gaussian sizes of and mas for IRC +10420’s continuum-emitting region in the and bands, respectively. From the high-spectral resolution data, we obtained a FWHM Gaussian size of mas in the -band continuum. The Br-emitting region can be fitted with a geometric ring model with a diameter of mas, which is approximately 4 times the stellar size. The geometric model also provides some evidence that the Brline-emitting region is elongated towards a position angle of 36°, well aligned with the symmetry axis of the outer reflection nebula. Assuming an unclumped wind and a luminosity of , the spherical radiative transfer modeling with CMGFEN yields a current mass-loss rate of based on the Brequivalent width. However, the spherical CMFGEN model poorly reproduces the observed line shape, blueshift, and extension, definitively showing that the IRC +10420 outflow is asymmetric. Our 2-D radiative transfer modeling shows that the blueshifted Bremission and the shape of the visibility across the emission line can be explained with an asymmetric bipolar outflow with a high density contrast from pole to equator (8–16), where the redshifted light is substantially diminished.
Key Words.:
Techniques: high angular resolution — Techniques: interferometric — Circumstellar matter — Stars: individual: IRC +10 420 — Stars: mass–loss — Stars: supergiants — Stars: Wolf-Rayet1 Introduction
Due to its distance ( = 4-6 kpc; Jones et al., 1993), the relatively high wind velocity (40 ), and the remarkable photometric history, IRC +10 420 (= V 1302~Aql = IRAS 19244+1115) is most likely not a post-AGB star evolving through the proto-planetary nebula stage as suggested earlier (e.g. Fix & Cobb, 1987; Hrivnak et al., 1989; Bowers & Knapp, 1989; Trammell et al., 1994), but a yellow hypergiant (, see Jones et al., 1993; Oudmaijer et al., 1996). Such extremly luminous stars are extremely rare, and only a dozen are known in the Galaxy (Clark et al., 2005). Yellow hypergiants (YHG) have high mass-loss rates () and are in a short, transitional evolutionary stage, thereby rapidly crossing the so-called “yellow void” in the Hertzsprung-Russell diagram (Humphreys et al., 2002). Their link to other advanced evolutionary phases of massive stars such as Luminous Blue Variables and Wolf-Rayet stars is still an open issue in stellar evolution theory.
Because of its large number of remarkable observational features, IRC +10420 has been subject to extensive studies over the last 30 years. The spectral type of IRC +10420 has changed from F8 Ia+ in 1973 (Humphreys et al., 1973) through A5Ia in the mid 90s (Oudmaijer et al., 1996; Klochkova et al., 1997) to A2 in 2000 (Klochkova et al., 2002). Correspondingly, the effective temperature has changed by more than 3000 K in the last two and a half decades. This makes IRC +10420 a unique object for the study of stellar evolution since it is one of the very rare stars believed to be in the rapid transition from the Red-Supergiant stage to the Wolf-Rayet phase.
HST/WFPC2 images of IRC +10420’s surrounding nebula (Humphreys et al., 1997) revealed a variety of structures including condensations or knots, ray-like features, and several arcs or loops within from the star, plus one or more distant reflection shells. All these features suggest frequent episodes of high mass loss during the past centuries. Castro-Carrizo et al. (2001) found thermal SiO emission in a huge hollow shell around IRC +10420, with a typical radius of cm (=6680 AU=134 at a distance of 5 kpc), a shell width smaller than half of the radius, and an expansion velocity of 35 . Castro-Carrizo et al. (2007) mapped IRC +10420 ’s nebula in the J = 2-1 and 1-0 transitions and found that the nebula shows an approximately spherical, extended halo surrounding a bright inner region, with both components clearly presenting smaller aspherical features. The CO nebula expands isotropically with an expansion rate similar to the SiO shell.
The chemical composition of IRC +10420’s nebula is dominated by O-rich chemistry as suggested by several observations (e.g. the OH maser emission by Reid et al., 1979), and is similar to O-rich AGB stars as recently found by Quintana-Lacaci et al. (2007). IRC +10420 is also among the brightest IRAS objects and one of the warmest stellar OH maser sources known (Giguere et al., 1976; Mutel et al., 1979; Diamond et al., 1983; Bowers, 1984; Nedoluha & Bowers, 1992). Ammonia emission has been reported by McLaren & Betz (1980) and Menten & Alcolea (1995). From CO observations, high mass-loss rates of the order of several M (Knapp & Morris, 1985; Oudmaijer et al., 1996; Castro-Carrizo et al., 2007) have been derived.
As inferred by many studies, the structure of the inner circumstellar envelope (CSE; spatial scale of milliarcseconds) of IRC +10420 appears to be as complex as that of the outer nebula, and numerous scenarios have been proposed to explain its observed features. These models include a rotating equatorial disk (Jones et al., 1993), bipolar outflows (Oudmaijer et al., 1994), infall of circumstellar material (Oudmaijer, 1998), wind blowing in a preferential direction (Humphreys et al., 2002), and even the simultaneous presence of inflowing and outflowing matter (Humphreys et al., 2002).
Despite very intensive observing campaigns, the overall geometry of IRC +10420’s CSE is still a matter of debate. Humphreys et al. (2002) obtained HST/STIS spatially resolved spectroscopy of IRC +10420 and its reflection nebula. They suggested that given the stellar temperature and the high mass-loss rate, the strong stellar wind of IRC +10420 must be optically thick and, thus, the observed variations in the apparent spectral type and temperature are due to changes in the wind and do not reflect an interior evolution on short timescales. The detection of a nearly spherical CSE by Humphreys et al. (2002) is in marked contrast to other observations that reveal a rather axis-symmetric wind geometry in IRC +10420, such as the earlier HST images (Humphreys et al., 1997), integral-field spectroscopy (Davies et al., 2007), or recent spectropolarimetry (Patel et al., 2008). These latter observations suggest a symmetry axis at a position angle of .
Infrared interferometric and coronographic observations of IRC +10420 were reported by, e.g., Dyck et al. (1984), Ridgway et al. (1986), Cobb & Fix (1987), Christou et al. (1990), Kastner & Weintraub (1995), Blöcker et al. (1999), Sudol et al. (1999), Lipman et al. (2000), and Monnier et al. (2004). Blöcker et al. (1999) presented diffraction-limited 73 mas -band bispectrum speckle-interferometry observations of IRC +10420’s dust shell. They found that the -band visibility steeply drops to a plateau-like value of at 6 m baseline and, thus, concluded that 40% of the total -band flux comes from the extended dust shell. The best radiative transfer model found by Blöcker et al. (1999) to simultaneously explain the spectral energy distribution (SED) and -band visibility contains a two-component shell composed of silicate dust with an inner rim at 69 stellar radii where the dust temperature is 1000 K. Moreover, Blöcker et al. (1999) found that a phase of heavy mass loss with mass-loss rates approximately 40 times higher than the current must have ceased roughly 60 to 90 yrs ago.
Monnier et al. (2004) obtained both -band aperture-masking observations of IRC +10420 using the Keck I telescope and long-baseline interferometric observations with the beam-combiner instrument FLUOR at the IOTA interferometer (e.g. Traub, 1998). While the aperture masking observations basically confirmed the results of the speckle observations of Blöcker et al. (1999), i.e. a sharp visibility drop for baselines shorter than 2 m and a plateau-like visibility of 0.6 up to a 8 m baseline, from the IOTA measurements Monnier et al. (2004) found a -band visibility of 0.7, from which they concluded that the compact stellar component is not resolved at baselines as long as 35 m.
Recently, de Wit et al. (2008) presented the first near-infrared long-baseline interferometric observations of IRC +10420 obtained with the AMBER instrument at ESO’s Very Large Telescope Interferometer (VLTI). The observations presented by de Wit et al. (2008) were carried out in medium spectral resolution mode () around the Bremission line. de Wit et al. (2008) resolved the Brline-emitting region and derived a Gaussian FWHM size of 3.3 milliarcseconds (mas), but due to calibration problems, the size of the continuum-emitting region could not be constrained.
In this paper, we present the first VLTI/AMBER observations of IRC +10420 in the and bands in low-spectral resolution mode and the first AMBER measurements of its Br-emitting region with a spectral resolution of (high-spectral resolution mode of AMBER) and baselines up to 128 m. From these new AMBER observations, the size of the continuum-emitting region in several spectral channels across the and bands could be derived and, by comparison of the high-spectral resolution AMBER data with 2-D gas radiative transfer models, details on the size and geometry of the Brline-emitting region could be obtained.
The observations presented here are the first step of an observing campaign to better constrain the geometry of the inner wind region of IRC +10420 at a scale of a few stellar radii.
The paper is structured as follows. In Sect. 2 we will present the AMBER observations of IRC +10420 and discuss the data reduction. In Sect. 3.1 we discuss the implications of AMBER’s limited field-of-view for the observations of the very extended object IRC +10420. In Sect. 3.2 and 3.3, the absolute calibration, radiative transfer modeling, and interpretation of the AMBER data will be discussed. The paper closes with a summary and conclusions in Sect. 4.
2 Observations and data reduction
2.1 General remarks on the data reduction process
In the following two subsections we describe our VLTI/AMBER observations of IRC +10420 in low (LR) and high spectral resolution (HR) mode. AMBER is the near-infrared closure-phase beam combiner of ESO’s VLTI, simultaneously operating in the , , and bands. This instrument is capable of interfering the light of either three 1.8 m Auxiliary Telescopes (ATs) or three of the 8.2 m Unit Telescopes (UTs) located on Paranal. A detailed description of the AMBER instrument and its optical design is given in Petrov et al. (2007) and Robbe-Dubois et al. (2007). The AMBER data presented here were reduced using version 2.2 of the data reduction package amdlib 111This software package is kindly provided by the Jean-Marie Mariotti Center and publicly available from http://www.jmmc.fr/data_processing_amber.htm.. The reduction software is based on the so-called Pixel-to-Visibility-Matrix (P2VM) algorithm, which is described in Tatulli et al. (2007).
Following previous experiences with the reduction of low and high-spectral resolution AMBER data (e.g. Weigelt et al., 2007; Wittkowski et al., 2008), the data selection was carried as follows: As primary selection criteria we used the signal-to-noise ratio (SNR) of the fringe signal. For the LR data, we kept 20% of the data with the highest fringe SNR, while for the HR data taken with the fringe tracker FINITO (e.g. Gai et al., 2003; Le Bouquin et al., 2008) we kept 80% of the data with the highest fringe SNR. In both cases, the optimal fringe SNR selection value was found by increasing the fraction of discarded data frames from 0 to 80%. A stronger selection than given above only led to an increase of the noise; i.e., finally there was only a decrease of the data quality rather than a significant improvement. In addition to the fringe SNR selection, to ensure a proper deselection of all frames which are far from zero optical path difference, we also discarded in the low- as well as high-spectral resolution data all frames with a piston of more than m. For the high-spectral resolution data, this seems to be a too strong selection, since in this case the coherence length is of the order of cm, but due to the use of FINITO the piston variation is typically much small than 100 micron in the HR data. Since it turned out that the HR results do not show a strong variation with piston selection, we finally decided to use the same piston selection criteria for both the HR and LR data.
Concerning the error estimates of our AMBER measurements, we were facing the problem that for each observation only one suitable calibrator measurement was available. Thus, in addition to the statistical error of the observables calculated from the average over all frames of a given data set, it was problematic to address also any systematic error sources. Therefore, to account for systematic uncertainties of the absolute calibration process, we looked up previous AMBER measurements taken under similar weather conditions. From these comparisons, we concluded to add an absolute error of 0.03 to all visibility data and 3 degrees to all phases to account for the systematic uncertainties.
2.2 The low-spectral resolution data
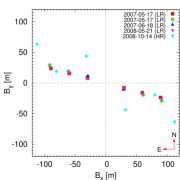
The low-spectral resolution (hereafter LR) AMBER observations of IRC +10420 were obtained with the Auxiliary Telescopes (ATs) in May/June 2007 and May 2008 using the linear baseline configurations E0-G0-H0 and A0-D0-H0. A summary of the LR observations is given in Table 1. As this table as well as the coverage in Fig. 1 shows, the total baseline and position angle ranges covered by the LR observations of IRC +10420 are 15 to 94 m and 69 to 75°, respectively, i.e. the observations were essentially carried out in the same direction on the sky. All measurements were made under sub-average to average seeing conditions (see Tabs. 1 and 2). For the calibration of all LR AMBER data on IRC +10420 we used the calibrator HD 190327. A record of the calibrator observations is also provided in Table 1.
-
a
Due to technical problems during the observations, visibilities could only be obtained for the intermediate baseline ( m).
Unfortunately, due to technical problems during the observations, from the measurements carried out in June 2007 reliable data could only be retrieved from one of the three baselines. Thus, in this case only one visibility instead of a triplet was obtained. Due to unfavorable weather conditions and limitations of the technical performance, reliable differential and closure phases from the LR observations could not be derived for any of the 2007 observations, but only for those from May 2008.
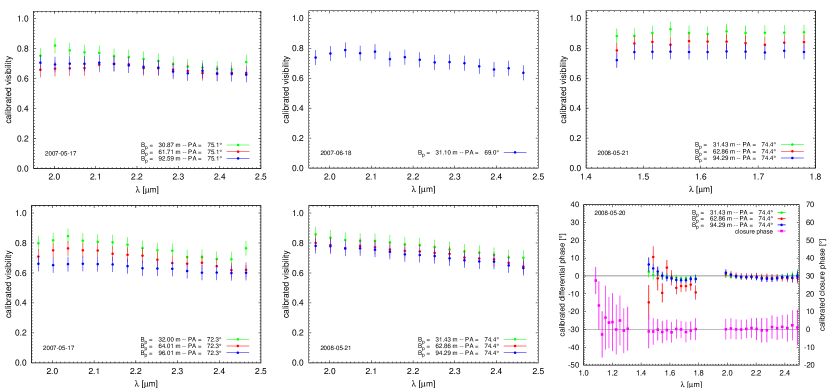
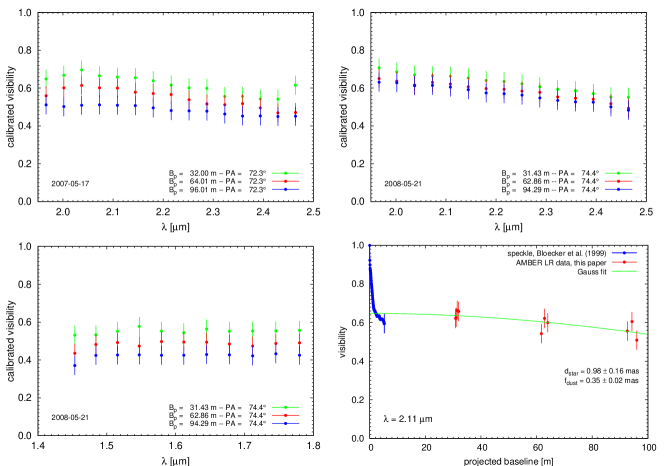
The results of the AMBER LR observations of IRC +10420 are shown in Fig. 2. The panels in the left and middle column show the AMBER -band visibilities as a function of wavelength for the three epochs covered by our study, the top right panel shows the the AMBER -band visibilities as a function of wavelength, and the bottom right panel illustrates the differential and closure phases in the , and bands obtained from the May 2008 observations of IRC +10420.
Two main results can be seen in Fig. 2. First, both the - and -band visibilities show only a weak wavelength dependence, and the visibility change with baseline for a given wavelength is only moderate. This corresponds to the fact that even with the shortest baselines of our AMBER observations, the extended dust shell of IRC +10420 is already fully resolved, and thus, AMBER probes the compact stellar component, i.e. the continuum emission from the central star and the dense circumstellar wind. The second result from the calibrated LR observables shown in Fig. 2 is that both the differential and closure phases show zero phase signals across all three near-infrared bands within the uncertaintly limits. Thus, in the LR AMBER data which mainly probe the continuum emission IRC +10420 does not show detectable deviations from point symmetry.
2.3 The high-spectral resolution data
In addition to the low-spectral resolution - and -band AMBER observations of IRC +10420 presented in the previous section, we also obtained the first AMBER measurement of IRC +10420 in high-spectral resolution mode (spectral resolution ). The observations were carried out in October 2008 under average seeing conditions as part of an AMBER science verification run in order to test the performance of AMBER using the UTs and the fringe tracker FINITO. In the context of this science verification run, a single measurement of IRC +10420 and the calibrator star HD 232078 was carried out in the band, centered around the Bremission line (m), with an exposure time of 3 s. Due to this long exposure time, a window covering 512 pixels, i.e. all spectral channels of the AMBER detector, could be read out, corresponding to a wavelength coverage between and m.
It should be noted that a second measurement of IRC +10420 with an exposure time of 1 s was discarded for two reasons. First of all, the data quality of this second measurement is lower than that with the longer detector integration time (DIT), simply because the SNR is lower. Second, there is no corresponding calibrator measurement with the same DIT close in time to the science target measurement. From the ESO data archive, we found two other calibrator measurements with DIT=s from different science programs in the same night, but these measurements of the calibrators HD 902 and HD 13692 were taken 1 and 2 hours after the observations of IRC +10420. Since current high-spectral resolution AMBER data suffer from a time-variable high-frequency beating introduced by the VLTI Infrared Image Sensor IRIS (Gitton et al., 2004), we decided to discard these additional measurements because a proper calibration of the science target data turned out to be impossible. This seems to be a general problem for observations in high-spectral resolution mode if the time span between the science target and calibrator measurement becomes longer than approximately 30-45 minutes. For the same reason, we also discarded two other calibrator data sets with the same exposure time (DIT=3 s) as the measurement of IRC +10420 presented here since these calibrator observations were carried out and 8 hours after the IRC +10420 observations. To further reduce the effect of the IRIS fringes in our data, we spectrally binned our final visibilities and phases with a bin size of 7 and a step size of 1. To avoid a loss of spectral resolution across the Brline, this binning was only performed in the continuum region, i.e. for wavelength channels with m or m. A summary of the HR observations discussed in this paper is given in Table 2.
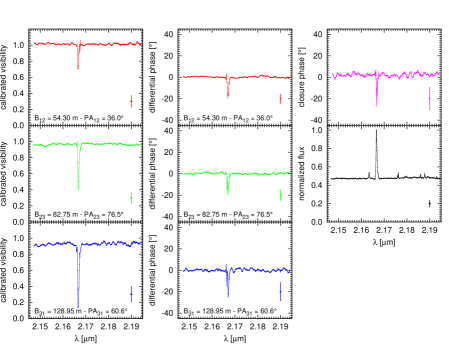
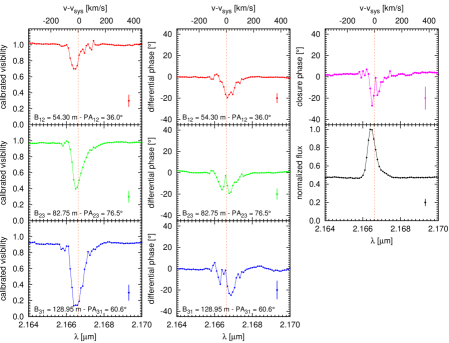
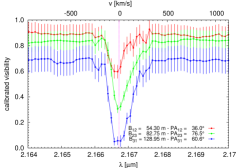
The calibrated observables of the AMBER high-spectral resolution measurements are presented in Fig. 3. The panels in the three left columns show (from left to right) the visibilities, differential phases, closure phases (top), and the spectrum (bottom) for the full wavelength range covered by the observations. All panels in the three columns on the right-hand side of Fig. 3 show the same quantities as the corresponding panels in the three left columns, but only for a small wavelength range close to the Bremission line. For the sake of clarity, in each panel, only a single averaged error bar is shown on the right-hand side.
The wavelength
calibration of the HR data was performed by comparison of the AMBER raw spectra of both IRC +10420 and the calibrator
HD 232078 with high-spectral resolution () telluric spectra kindly provided by
the Kitt Peak Observatory222The spectra are retrievable from
http://www.eso.org/sci/facilities/paranal/instruments/isaac/tools/spectroscopic_standards.html#Telluric..
The vertical dashed line shown in all panels on the right-hand side of Fig. 3 marks the zero velocity
with respect to earth, assuming a radial system velocity of 73 as given by
Humphreys et al. (2002), and a heliocentric correction of -26 for the time of the observations.
The spectrum shown in Fig. 3 is the average over the photometric beams
from the three single telescopes and the interferometric signal.
The calibration of the high-spectral resolution AMBER measurements is more uncertain compared to the low-spectral resolution data shown in Sect. 2.2 for two reasons. First of all, for the HR data, we had only one calibrator measurement instead of three as in the case of the LR data. Second, the HR data were recorded with the fringe tracker FINITO. Since the performance of FINITO depends on, e.g., a target’s correlated flux and the weather conditions at the time of the observations, the final calibrated observables obtained from AMBER+FINITO observations can be biased either due to a significant brightness difference between science target and calibrator and/or due to different weather conditions (seeing, coherence time, wind) during the science target and calibrator measurements.
In the case of the HR measurements of IRC +10420 presented in this paper, the calibration relies on only a single calibrator measurement of HD 23078 which is approximately 0.5 magnitudes fainter in the band than IRC +10420 (). From the weather data333Apart from the information provided by ESO with the raw data itself, the ambient weather conditions during an observation can be looked up at http://archive.eso.org/asm/ambient-server., we can see that at the time of the calibrator and science target measurements the seeing was varying between 085 and 115, and the wind speed on the ground was steadily declining from 9 to 7.5 . Thus, there is a noticeable, but not dramatic change in the weather conditions between the calibrator and IRC +10420 observation. Together with the 0.5 magnitude brightness difference, this might explain why, for instance, the calibrated visibility at the shortest baseline (see Fig. 3) is slightly larger than unity. In fact, when using data from other calibrators of the same night (HD 25680; HD 33833) which were taken several hours later and with a seeing of 14, the calibrated visibility of IRC +10420 reaches values .
While the weaker emission peaks seen in the full AMBER spectrum of IRC +10420 in Fig. 3 are telluric artifacts of the calibration process and therefore do not indicate real emission features, the spectrum clearly shows a strong Bremission line arising from IRC +10420 which contributes approximately 50% to the total flux at m. The Brline is clearly blueshifted with with respect to the systemic velocity, in agreement with previous findings by, e.g., Oudmaijer et al. (1994) () and Humphreys et al. (2002) (). From the -calibration process of our data, we estimate that the uncertainty of the wavelength calibration is of the order of . The equivalent width of the Brline in the AMBER spectrum is , in good agreement with the value found by de Wit et al. (2008) from medium-spectral resolution AMBER observations in June 2006. The Brline is slightly asymmetric in the sense that the redshifted tail of the line is more pronounced with velocities up to compared to on the blueshifted side.
At the wavelengths of the Bremission, the visibilities on all three baselines show a strong decrease, indicating that the line-emitting zone is clearly resolved by our AMBER observations and more extended than the continuum-emitting region. At the longest baseline, the visibility in the center of the Brline is as low as 0.14. It should be noted here that similar to the LR data presented in Sect. 2.2 the HR data also suffer from a strong field-of-view (FOV) effect as will be discussed in more detail in the next section.
The differential phases in the region of the Br-emission line show a clear non-zero signal within the uncertainty limits. On all three baselines, we obtained the strongest phase signal in the redshifted wing of the Br-emission line, with phases up to on the two shorter baselines and on the longest baseline. The closure phase , on the other hand, is in good agreement with the differential closure phase . also shows a strong signal in the redshifted wing of the Br-emission line () and the strongest non-zero signal () at the line center.
3 Results and discussion
3.1 The field-of-view effect
Since VLTI/AMBER is a single-mode fiber instrument, the field-of-view (FOV) is limited to the Airy disk of the telescope aperture. Therefore, for AMBER observations with the 1.8 m ATs of the VLTI, the FOV is 250 mas in the band, while for AMBER observations with the 8.2 m UTs, the FOV is only mas. Thus, when observing an object as extended as IRC +10420 with AMBER, it is of great importance to take AMBER’s limited FOV into account, since a non-negligible fraction of the total flux will be located well outside the FOV of the observations.
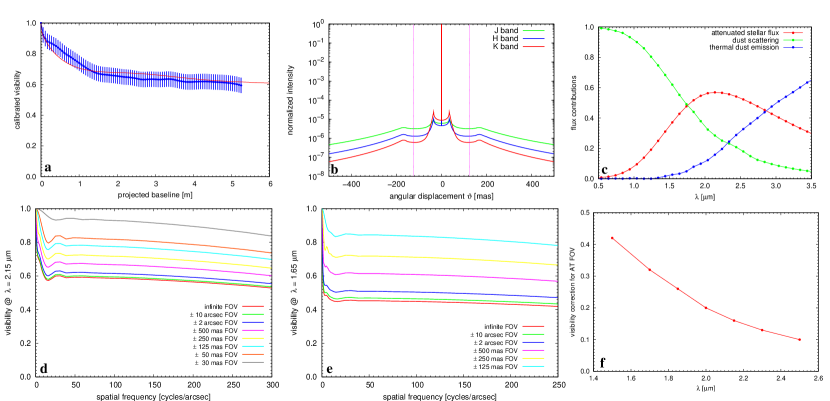
To account for the FOV effect in the AMBER data of IRC +10420, we used the dust radiative transfer model of Blöcker et al. (1999). This radiative transfer model was developed with the code DUSTY (Ivezic & Elitzur, 1997; Nenkova et al., 1999, 2000) to simultaneously explain the spectral energy distribution (SED) and -band speckle-interferometric observations obtained with the SAO 6 m telescope.
The azimuthally averaged -band visibility of Blöcker et al. (1999) is shown in the top-left panel of Fig. 4 as a function of baseline length. As one can see, the steep visibility drop ends in a plateau at a visibility level of 60%. The plateau itself is associated with the unresolved stellar component plus the dense stellar wind of IRC +10420, which can be probed by interferometry with baselines longward of approximately 10 m. On the other hand, the extended dust shell is fully resolved already with a few meter baseline. According to the best-fitting model of Blöcker et al., as a result of its heavy mass loss IRC +10420 is surrounded by an optically thick dust shell composed of silicate dust, which contributes approximately 40% to the total -band flux of IRC +10420. The inner boundary of the dust shell which marks the dust sublimation radius is located at mas and exhibits a dust temperature of 1000 K. Moreover, Blöcker et al. found that in addition to the steady stellar wind a phase of enhanced mass loss (superwind) that ceased roughly 60 to 90 yrs ago is required to explain both the -band visibility and the SED. In the intensity profiles shown in Fig. 4b, this temporal superwind phase results in the bump seen at an angular displacement of mas. Thus, according to Blöcker et al. IRC +10420 ’s dust shell comprises two components: An outer shell resulting from the previous superwind phase and, directly adjacent to this outer shell, an inner shell resulting from the present-day mass loss which followed the superwind phase. During the superwind phase, the mass-loss rate was approximately 40 times higher than the current mass-loss rate of .
Since the speckle data of Blöcker et al. were taken with a comparably large FOV (″), the infinite FOV of the DUSTY model was well suited for the speckle data analysis. In the context of our AMBER observations, we re-examined the final radiative transfer model of Blöcker et al. as follows. We used the radial - and -band intensity profiles of their final model (see the top-right panel in Fig. 4) and calculated the visibilities from the intensity profiles, which were truncated to match a given FOV. We note that it would have been more precise to convolve the intensity profiles with the corresponding telescope aperture before the truncation, but the effect of the convolution on the final result is only weak and, therefore, has been omitted here. The - and -band visibilities resulting from our FOV correction are shown in the middle panels of Fig. 4 for the FOVs given by the plot labels. As expected, the smaller the FOV, the higher the plateau value of the visibility, since an increasing fraction of the extended dust shell lies outside the FOV and will, therefore, no longer contribute to the flux and visibility, respectively.
In the bottom right panel of Fig. 4, the AMBER visibility correction for IRC +10420 is shown as a function of wavelength across the and bands. This wavelength-dependent correction has to be subtracted from the measured visibility in order to correct AMBER’s finite FOV when observing with the ATs. The figure reveals that the visibility correction decreases with increasing wavelength from approximately 0.42 at m to 0.1 at m. This decrease reflects the decreasing flux contribution of the dust shell (scattering + thermal emission) with increasing wavelength (see upper right panel in Fig. 4). For instance, at m the contribution of the attenuated stellar flux to the stellar flux is only 35%, while it is almost 60% at m. Correspondingly, the FOV correction is stronger in the band than in the band. At the center of the and bands the visibilities of the unresolved stellar component in the model with a 250 mas FOV are approximately higher by 0.18 and 0.35 compared to the DUSTY model with an infinite FOV. For a 60 mas FOV, the effect is even more dramatic. Here, almost the complete dust shell is truncated due to the small FOV, and the visibility approaches unity, since mainly the compact stellar component contributes to the total flux. According to Fig. 4, we can expect that only % instead of the originally 40% of flux from the extended dust shell remains, if the FOV is as small as 60 mas.
3.2 The low-spectral resolution data
As discussed in the previous section, the AMBER visibilities of IRC +10420 obtained with both ATs and UTs are highly affected by the limited FOV of the observations. From the radiative transfer model of Blöcker et al. (1999), we estimated the effect of AMBER’s limited FOV on the - and -band visibilities for baselines which start to resolve the stellar component and its dense wind. We lowered all LR - and -band visibilities shown in Fig. 2 according to the wavelength-dependent visibility correction shown in the bottom panel of Fig. 4. Figure 5 shows the rescaled -band AMBER visibilities from May 2007 and May 2008 (top panels) and the rescaled -band AMBER visibilities from May 2008 (bottom left panel) which would be obtained in the case of an infinite AMBER FOV.
As the bottom-right panel in Fig. 5 illustrates, the rescaled AMBER -band data at m (red bullets with error bars) are in good agreement with the visibilities from the speckle-interferometric observations by Blöcker et al. (1999) (blue bullets) within the uncertainties of both measurements. The solid green curve in Fig. 5 shows a Gaussian fit of the compact stellar component, assuming a fully resolved dust shell with an a priori unknown flux contribution. As indicated in the plot, a two-parameter fit with stellar diameter and the fractional flux contribution of the dust shell as free parameters gives a Gaussian FWHM diameter of mas and a dust shell flux contribution of . The fitted diameter is in agreement with the stellar diameter mas derived for a bolometric flux of , a distance of 5 kpc, and a central star effective temperature of 7000 K (see, e.g., Blöcker et al., 1999).
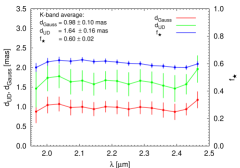
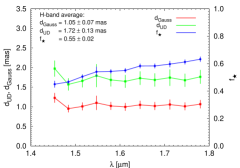
After rescaling all AMBER - and -band visibilities, we fitted all visibility points for a given wavelength with the simple two-component model described above (Gaussian stellar component + infinitely extended dust shell). The result of the fit procedure is shown in Fig. 6, where the fit parameters are displayed as a function of wavelength for the - (bottom panel) and -band data (top panel). As the figure reveals, within the error bars we essentially obtained both a wavelength-independent continuum diameter and a wavelength-independent flux contribution from the extended dust shell across the band. On the other hand, a slight decrease of the dust shell’s flux contribution is seen across the band from at the lower band edge to at the upper band edge. A comparison with the lower left panel in Fig. 4 shows that the wavelength dependence and the absolute level of the stellar flux contribution derived from the AMBER data is in basic agreement with the predictions from the DUSTY model of Blöcker et al. (1999). In this model, the attenuated stellar flux amount to approximately 0.58 in the band with only a moderate wavelength dependence, while the stellar flux contribution rises from approximately 0.32 to 0.5 across the band.
Averaged over all -band data, for IRC +10420 we derived a stellar continuum diameter of mas ( mas assuming a uniform disk) and a fractional flux contribution of from the dust shell. From the -band AMBER data, we found mas ( mas) and .
3.3 The high-spectral resolution data
3.3.1 FOV effect correction
To account for the larger uncertainties in the absolutely calibrated data, we used a slightly different strategy to correct the HR AMBER data for the FOV effect described in Sect. 3.1. Looking at Fig. 4e we see that for AMBER+UT observations with a FOV of mas, the fractional flux contribution of the dust shell in the band is only of the order of 6%. On the other hand, from the fit of our LR AMBER data, we found that IRC +10420’s -band continuum diameter is 0.98 mas. Therefore, we corrected our HR AMBER visibilities in the following way: For a given baseline, we first rescaled the visibility as a function of wavelength to match the value expected for a single, compact component with 0.98 mas diameter. Then, we globally lowered the rescaled visibilities by 6% to account for the diffuse, extended flux contribution of the dust shell.
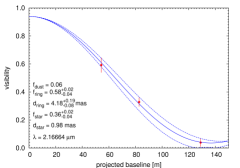
The final result of this rescaling process in order to take the FOV effect into account is shown in the upper panel of Fig. 7. Here, we show for a small wavelength range around the Brline the -band visibilities one would retrieve for IRC +10420 in the case of an infinite AMBER FOV. As the figure reveals, the continuum visibilities are now for the shortest baseline, 0.83 for the intermediate baseline, and 0.68 for the longest baseline.
3.3.2 Simple geometrical model
Attempting to get a first idea of the size of the Br line-emitting region and disregarding a possible deviation from spherical symmetry, we fitted a spherical Gaussian to all continuum data for a given wavelength with m and m, taking into account the 6% flux contribution from the extended dust shell. Averaged over all spectral channels (approximately 490 channels), we obtained a FWHM Gaussian size of mas for the continuum-emitting region. We note that the error given here includes not only the the pure fitting error, which is only of the order of 0.001 mas, but also reflects the uncertainties of the overall calibration process, including the FOV-related rescaling of the data.
To derive the size of the Brline-emitting zone, we fitted the visibilities in the spectral channels with noticeable Brline-emission in the spectrum, i.e. for m, with a three-component model. For the sake of simplicity, in this simple model, we neglect likely deviations from a spherical or even point-symmetric distribution of the Brline-emitting region. de Wit et al. (2008) convincingly argued that the Brline-emitting region cannot have a spherical shape, but is most likely elongated towards a position angle of 20°. Unfortunately, as in the case of the study of de Wit et al. (2008), also our single measurement with a position angle coverage of ° is only of limited use to put reliable constraints on the shape of the emission zone. Nevertheless, we studied the emission region also in the context of a 2-D radiative transfer model as will be shown in more detail in the next section. However, independent from a more sophisticated modeling, qualitatively we can conclude that the clear non-zero detection in the differential and closure phases across the Brline in our AMBER HR measurement shows that the geometry of the line-emitting region deviates from a point-symmtric configuration. On the other hand, in the center of the Brline the differential and closure phases are of the order of °. Thus, in order to determine the typical size of the Br-emitting zone with the simple model approach discussed here we decided to neglect the non-zero phases.
Our simple three-component model consists of the following components: (a) a fully resolved, infinitely large dust shell with a fixed fractional flux contribution of 6%, (b) the stellar continuum, approximated by a Gaussian with a fixed size of 0.98 mas according to our continuum fit, and (c) the Brline-emitting region, which is represented in our simple model by a ring with infinitely thin thickness (). The total visibility can then be written as
| (1) |
with
| (2) |
| (3) |
| (4) |
with mas (fixed) and
| (5) |
is the projected baseline, is the Bessel function of 0th order, and is the diameter of the infinitely thin ring representing the Brline-emitting region. As can be seen from the above equations, our fit procedure contains two free parameters: the ring diameter and the fractional flux contribution from the Brline-emitting region of IRC +10420’s optically thick stellar wind, . In principle, one could also fix and according to the spectrum shown in Fig. 3, if the continuum emission is interpolated across the Brline. For instance, a linear interpolation from the spectral channels measuring pure continuum emission would give and . But since it is not clear a priori to which extent photospheric absorption is present (which is probably not unlikely for an A-type star, see discussion in de Wit et al., 2008), we decided to keep the fractional flux contribution from the stellar wind component as a free parameter.
Our best-fit result for the central wavelength channel in the Brline is shown in the middle panel of Fig. 7. Here, the visibility according to Eqs. (1)-(5) is plotted as a function of baseline for m. The blue bullets with error bars are the three AMBER data points, and the three curves visualize the best fit model and its tolerance. We found that our AMBER data in the center of the Bremission line can be well fitted with a ring with a diameter of , whose fractional flux contribution is . We note that the size of the Brline-emitting region obtained from our fit is in general agreement, although slightly larger than the 3.3 mas found by de Wit et al. (2008) from a single-component Gaussian fit of the line data. From , we directly obtain ; i.e., from our best fit, we indeed find a photosperic absorption in the Brline of the order of .
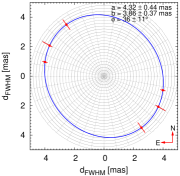
Despite the limited amount of data and the limited position angle coverage, we also briefly addressed the question of an aspherical shape of the Brline-emitting region in the context of our simple model fits. For this study, we used the three-component model described above and fixed to the value found from the 1-D fit () of the m data. Then, we first fitted all three data points with the three-component model with only as free parameter, and finally, we fitted an ellipse to the three ring diameters as a function of position angle. The result is shown in the bottom panel of Fig. 7, where the fitted ring diameters and the ellipse are displayed in a polar diagram. As the figure shows, the position-angle dependence of the ring diameter can be fitted with an ellipse with major and minor axes of mas and mas, respectively, and a position angle of the major axis of °. Interestingly, the major axis is nearly aligned with the elongation of the outer reflection nebula of IRC +10420 seen in the HST images of Humphreys et al. (1997, PA = 33°) and the symmetry axis of the H emission as inferred by Davies et al. (2007).
3.3.3 Radiative transfer modeling of the Br line emission
A simple geometrical model as presented in the previous section cannot explain the AMBER observations in detail. Thus, a more physical model is required to interpret, for instance, the blueshift of the Br emission, the visibility across the emission line, and the non-zero phases. Therefore, in a second step of our analysis we interpreted the AMBER data of IRC +10420 using the iterative, spherical symmetric, full line-blanketed, non-LTE radiative transfer code CMFGEN (Hillier & Miller, 1998).
The radiative transfer code
In CMFGEN, a spherically-symmetric outflow in steady-state is assumed, and line and continuum formation are calculated in a non-LTE regime. Each model is specified by its effective temperature , luminosity , effective gravity , mass-loss rate , wind terminal velocity , and chemical abundances of the included species. Moreover, a velocity law must be adopted, since the momentum equation of the wind is not solved. CMFGEN can only handle monotonically increasing velocity laws and, therefore, no inflows can be analyzed using this code. The velocity structure is parameterized by a beta-type law, which is modified at depth to smoothly match a hydrostatic structure at . We define the hydrostatic radius as the radius where the wind velocity is equal to one third of the sonic velocity (), in order to avoid any effect of the dense wind on the determination of . Close to and below , the hydrostatic equation is iterated in order to produce a quasi-hydrostatic structure which extends inwards to the inner model boundary (at a Rosseland optical depth of 100). The effective temperature is defined as the temperature where the Rosseland optical depth is 2/3, i.e., ).
While CMFGEN can handle the effects of clumping via a volume filling factor , we decided to assume a unclumped wind (i.e. ) since no strong electron scattering wings are present around the Brline. The strength of such electron scattering wings is sensitive to the amount of wind clumping (Hillier, 1991), and even assuming an unclumped wind model (which produces the maximum strength possible in the electron scattering wings), no detectable electron scattering wings are seen in Br.
Line blanketing affects the ionization structure of the wind and, consequently, the spectrum. CMFGEN employs the concept of super-levels to include thousands of spectral lines in non-LTE, making it feasible to solve the equations of statistical equilibrium and radiative transfer simultaneously. The atomic model used for IRC +10420 included lines of H, He, C, N, O, and Fe.
Although CMFGEN handles only spherical-symmetric outflows, the wind asymmetry was also analyzed using a recently developed modification in CMFGEN to compute the emerging spectrum in two-dimensional geometry (Busche & Hillier, 2005). We refer the reader to Busche & Hillier (2005) for further details about the code, and to that paper and Groh et al. (2006, 2008) for additional details about applications of the BH05 code. In the following, we briefly describe the main aspects of the code.
As input the BH05 code requires several quantities (energy-level populations, ionization structure, temperature structure, emissivities, opacities, and specific intensity ) calculated by the original, spherically-symmetric CMFGEN model in the co-moving frame. Latitude-dependencies of the wind density and wind terminal velocity can then be taken into account using any arbitrary latitude-dependent density/wind terminal velocity variation. Due to our very limited amount of data, we restricted the analysis to changes only in the wind density, using oblate and prolate density parameterizations as follows,
| (6) |
| (7) |
where is the latitude angle (0∘=pole, 90∘=equator). A scaling law is used to ensure that the 2-D model has the same mass-loss rate as an equivalent spherically symmetric model.
The scaling laws given above are applied only for distances greater than that where the wind velocity is equal to the sonic velocity. For smaller distances, no scaling was applied. The 2-D source function, emissivities, and opacities are then calculated, assuming that these quantities depend only on the new values of the scaled density. Appropriate scaling laws are used for different physical processes (e.g. density-squared scaling for free-free and bound-free transitions, and linear-density scaling for electron scattering). Finally, for a direct comparison with the AMBER observables the spectrum in the observer’s frame and intensity maps for all wavelengths of interest are computed. In our analysis, we first considered a spherically symmetric model and then a model with a prolate/oblate wind structure.
Spherical model
The stellar and wind parameters of our best-fitting spherically symmetric CMFGEN model are presented in Table 3. Our CMFGEN model has a luminosity of , in good agreement with previous determinations (e.g., , Jones et al., 1993) Together with an assumed mass of , we find . Since IRC +10420 has already lost about half of its initial mass (Humphreys et al., 1997), it is likely that the He content is enhanced on the surface compared to the solar value. Thus, apart from solar metallicity our model assumes a He abundance of He/H=0.4 (by number). Finally, we assumed a distance of 3.5 kpc.
The AMBER high-resolution -band spectrum covers only a short wavelength region around Br, and does not provide enough diagnostic lines to derive a precise value for the effective temperature of IRC +10420. However, the absence of He i m and He i m lines imply an upper limit for of about 10500 K. Since Klochkova et al. (2002) obtained for the observations of IRC +10420 in 2000 and an annual increase in of K, we assume in our models . We note that conclusions of the present paper such as the evidence for wind asymmetry in IRC +10420, are only weakly affected by reasonable changes in .
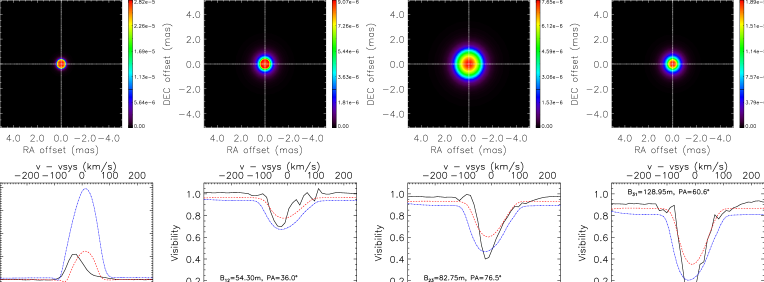
Our model requires a mass-loss rate of in order to reproduce the equivalent width of the observed Br line in IRC +10420 (, Fig. 8). A wind terminal velocity of and were used in order to roughly reproduce the Br line width. However, the Br-emitting region of such a model is rather compact, not reproducing the spatial extension of the Bremitting region as measured by AMBER. As a consequence, this model fails to reproduce the observed visibilities (see red curves in the lower panels of Fig. 8). Moreover, while the observed spectrum is blueshifted relative to the systemic velocity, the CMFGEN model spectrum is slightly redshifted (). The redshift in the model is caused by the turbulent velocity field of the wind (Catala et al., 1984; Hillier, 1987, 1989), which was parameterized using a microturbulent velocity of .
An additional model with the same parameters as the model described above, but with , was calculated in order to analyze the effects of a larger on the fit of the AMBER observables. As expected, the increase in results in a larger Br-emitting region, but while such a model with an increased mass-loss rate is now able to reasonably reproduce the observed visibilities (see blue curves in the lower panels of Fig. 8), it also predicts a much higher amount of Brline emission compared to the observations (lower left panel in Fig. 8). On the other hand, lower turbulent velocities provide slightly lower Brredshifts. However, as a general result we conclude that spherically symmetric wind models are intrinsically unable to reproduce the observed blueshifted Brline. Moreover, a reasonable simultaneous fit of both the observed Brspectrum and the corresponding visibilities with a spherical model could not be obtained.
| spherical model | ||||||
| log / | He/H | |||||
| (K) | () | () | (number) | |||
| 5.78 | 9600 | 0.8 | 70 | 1.5 | 0.4 | |
| two-dimensional model | ||||||
| Density distribution | i | PA | ||||
| () | () | () | ||||
| Prolate | 15 | 2 | 45 | 60 | ||
2-D modeling of the AMBER data around the Br line - evidence for wind asymmetry
In the previous paragraph we showed that spherical models are unable to simultaneously reproduce the observed AMBER visibilities and the Br spectrum of IRC +10420 and, in particular, the blueshift of the Br emission. Thus, one can conclude that a non-spherical outflow must be present. This is supported by the fact that non-zero differential and closure phases have been measured with AMBER. Thus, in order to obtain insights on the wind asymmetry of IRC +10420, we calculated 2-D axisymmetric radiative transfer models using the Busche & Hillier (2005) code described above.
Due to the limited amount of spatial frequencies and position angles sampled by our data, in our analysis we gave highest priority to the simultaneous reproduction of the observed amount of Br line emission compared to the continuum, the blueshift of this emission, and the wavelength dependence of the visibility. Given the limitations of our 2-D model and the likely three-dimensional nature of IRC +10420 ’s outflow, a full analysis of the wavelength dependencies of the differential and closure phases are deferred to a future paper. Nevertheless, we believe that the modeling results presented in the following are crucial for constraining the parameter space in future studies using more sophisticated 2-D radiative transfer models such as ASTAROTH (Zsargó et al., 2008).
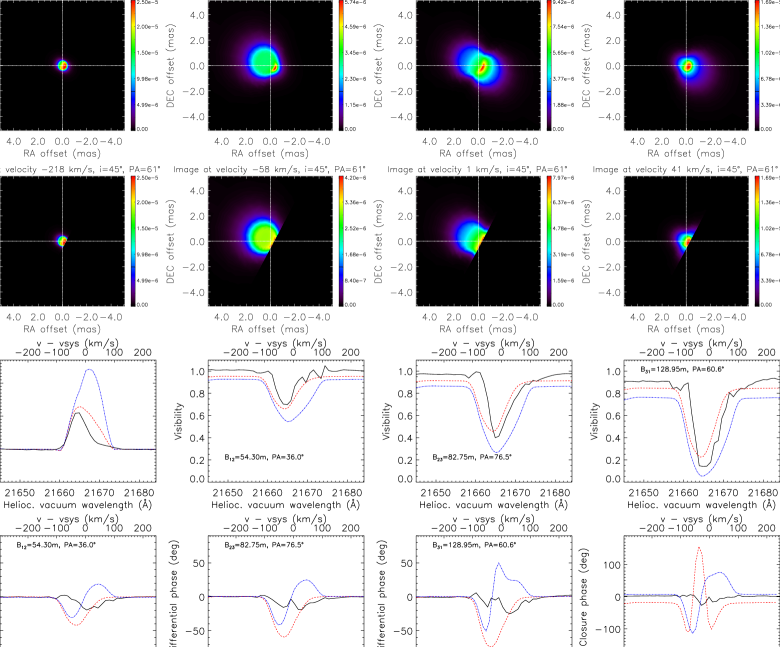
We analyzed both prolate and oblate density enhancements and found that, in general, both geometries require a remarkably large density contrast () in order to reproduce the low visibility detected within the Br line. Interestingly, the observed blueshift of the Bremission could only be reproduced by models in which the receding part of the wind, which is responsible for the major fraction of the redshifted Br emission, is blocked. For a given density contrast, oblate models provided less projected separation on the sky between the redshifted and blueshifted hemispheres than prolate models, making it challenging for oblate models to produce a blueshifted Br line with a similar strength and spatial extension as the observations. Therefore, the preferred geometry to fit the observations is prolate and the blocking of the redshifted hemisphere could possibly be caused either by an optically-thick disk, a putative binary companion, or by the wind being ejected by specific parts of the stellar surface.
The best fit to simultaneously reproduce the observed amount of Br line emission with respect to the continuum, the line blueshift, and the wavelength dependence of the visibility was obtained by using a prolate model with a density contrast of from pole to equator (see Fig. 9) oriented at . The optimal fit to the line’s blueshift was obtained by starting the blocking of the redshifted emission at a projected offset distance from the center of the star of RA=-0.3 mas and DEC=-0.3 mas (Fig. 9). As Fig. 9 reveals, while the 2-D models can basically resemble the AMBER spectrum and visibilities across the Brline and, in the the case of the blocked model, also the observed blueshift of the emission, neither the unblocked nor the blocked model is able to reproduce the observed wavelength dependence of the differential and closure phases. Both models predict much stronger phase signals across the line, especially in the blueshifted wing of the emission line. As noted above, a consistent fit of all AMBER observables including the phases is beyond the scope of this paper and will be subject to a more detailed analysis which also includes follow-up AMBER oberservations of IRC +10420 which will help to better constrain the 2-D model.
Compared to our spherical model presented before, the mass-loss rate of the 2-D model had to be increased to , since a fraction of the Bremission is blocked. Lower polar density enhancements did not provide enough extension of the Brline-emitting region, while higher mass-loss rates provided a stronger Bremission line than observed with AMBER. The value of is admittedly biased by the visibility measurement of the longest baseline, which had an orientation on the sky of . Different PAs provide a worse fit to the Brvisibilities and the differential and closure phases have less amplitude than the model with . Interferometric measurements using baselines oriented at different PAs on the sky are urgently needed to better constrain the position angle of IRC +10420 ’s prolate wind.
An intermediate inclination angle of is required in order to provide enough separation between the projected redshifted and blueshifted lobes and the star. In this case, the redshifted part of the line emission can be efficiently blocked and, thus, the observed blueshifted Bremission can be reproduced and yet produce sufficient spatial extension on the sky to also fit the AMBER visibilities. Models with provide too much redshifted emission even if one of the hemispheres is completely blocked, while even for a polar density enhancement of 16 models with do not provide enough spatial extension of the Bremission region on the sky due to projection effects. If the inclination angle of the line-of-sight to IRC +10420 is less than , we estimate that a very large density contrast between pole and equator of is required, which seems unlikely.
To summarize, from the 2-D modeling of our AMBER data we conclude that the wind of IRC +10420 has a significantly non-spherical geometry, and the viewing angle and the physical conditions must be such that a large fraction of the redshifted Br emission is blocked from our view.
4 Summary and conclusions
We presented the first VLTI/AMBER observations of the yellow hypergiant IRC +10420 in low-spectral resolution (LR) mode covering the , , and bands and the first AMBER observation of IRC +10420 around the Bremission line in high-spectral resolution (HR) mode with a spectral resolution of 12 000 and projected baselines between 54 and 129 m.
From the low-spectral resolution observations carried out with two linear AT arrays (baselines ranging from 15 to 96 m), we were able to extract - and -band visibilities at spatial scales which probe the stellar continuum emission. Differential and closure phases could be derived from the LR data for two near-infrared bands (differential phases) and all three near-infrared bands (closure phases) covered by AMBER. Within the error bars, all LR phases turn out to be zero. We corrected all visibilities for AMBER’s limited field-of-view (FOV = 250 mas for AT observations) to account for the truncation of IRC +10420’s extended dust shell. From the visibilities we derived FWHM Gaussian diameters of IRC +10420’s stellar component of mas and , averaged over all spectral channels in the - and -bands, respectively. The stellar flux contribution in the case of an infinite FOV was found to be in the band and in the band.
On the other hand, we carried out high-spectral resolution AMBER observations of IRC +10420 centered around the Bremission line and combining three UTs. We found that the Bremission is blueshifted with with respect to the systemic velocity and that the Bremitting-region of IRC +10420’s dense stellar wind contributes roughly 50% to the total flux at the peak wavelength of the nearly symmetric emission line. The equivalent width of the Brline is , in agreement with recent findings (e.g. de Wit et al., 2008). The HR visibilities of IRC +10420 show a strong decrease at the wavelength of the Br-line emission, indicating that the region in the wind of IRC +10420 where the Bremission arises is fully resolved by our observations and considerably more extended than the continuum-emitting region. In addition, the HR AMBER observation of IRC +10420 revealed non-zero differential and closure phases with absolute values up to for several spectral channels covering the central and redshifted wing of the Br-emission line. This finding indicates that the shape of the Brline-emitting region is not point-symmetric.
The HR data of IRC +10420 around the Bremission line have been analyzed by simple geometrical models as well as 1-D and 2-D gas radiative transfer models using the code CMFGEN. From simple geometrical models, we found a size of the stellar continuum-emitting region comparable to our LR observations ( mas). Approximating the line-emitting region with an infinitely thin ring, we found mas, i.e. . The size of the line-emitting region is in basic agreement, although slightly larger than the value 3.3 mas found by de Wit et al. (2008) from AMBER observations in medium-spectral resolution mode (). The difference between the two results can be explained by the differences in the details of the two modeling approaches and the different spectral resolution of the data, but probably mainly reflects the overall calibration uncertainties.
To get a first idea of the deviation from sphericity, we fitted an elliptical Gaussian ring to the 3 AMBER visibility data points at the central wavelength of the Bremission. From this fit, we find that the Brline-emitting region is elongated, with major and minor FWHM ring diameters of and mas, and an elongation towards a position angle of °, perfectly aligned with the elongation axis of the outer reflection seen from HST images. Follow-up observations with higher redundancy, a more robust calibration, and a better position angle coverage are indispensable to confirm this result.
Apart from simple geometrical models, we also analyzed the AMBER HR data of IRC +10420 around the Bremission line by comparison with 1-D and 2-D gas radiative transfer models obtained with the code CMFGEN. We found that spherical models definitely fail to reproduce the observed blueshift of the Bremission while they can well reproduce the amount of line emission. Spherical wind models also fail to reproduce, at the same time, the amount of line emission and the wavelength dependence of the visibility across the emission line and, hence, the extension of the Brline-emitting region. On the other hand, we found that 2-D models with a prolate wind structure can simultaneously reproduce the amount of Bremission, the wavelength dependence of the visibility across the line and, in addition, the observed blueshift of the Bremission, but only if a substantial fraction of the redshifted Bremission is blocked. A model without any diminishing of the redshifted emission cannot explain the blueshift of the emission while simultaneously reproducing the amount of line emission and the spatial extension of the line-emitting region. In our best-fitting model, the outflow exhibits a strong density enhancement towards the poles with a pole-to-equator density ratio of 16, and the outflow is oriented towards a PA of 60°and inclined by 45°. Since the uncertainty of the position angle of the best-fitting model is approximately 20°, we find that the orientation of the symmetry axis of our radiative transfer model is in rough agreement with the orientation of the elongation derived from our simple elliptical ring model (, see Sect. 3.3.2). Nevertheless, it should be noted that both results might be biased towards the derived values due to the sparse position angle coverage of our measurements.
Interestingly, our best-fitting model gives a temperature of 1500 K at a radial distance of 100 mas from the central star, assuming a distance of 5 kpc for direct comparison with the Blöcker et al. (1999) results. In their best model, based on speckle-interferometric observations from 1998, the inner dust shell boundary with a dust temperature of 1000 K is located at a radial distance of mas. Thus, our gas-radiative transfer model nicely fits the previously developed dust-shell model, especially if we believe that we indeed see an outward shift of the inner dust shell boundary which is driven by the noticeable increase of the stellar effective temperature within the last decades.
The signature of the differential- and closure-phase signal of IRC +10420 detected with AMBER is totally different from what would be expected, for instance, for a rotating circumstellar disk (e.g. Meilland et al., 2007). On the other hand, we find that the wavelength dependence of both differential and closure phases shows some qualitative similarities to measurements obtained for the Luminous Blue Variable Carinae (Weigelt et al., 2007). In the interpretation of the Car AMBER data, the phase signature was associated with enhanced mass loss of the rapidly rotating, massive primary star in polar direction, and the observer is basically looking towards the blueshifted part of the outflow. The qualitative similiarty of the phase signals between IRC +10420 and Brmotivates the assumption that also in the case of IRC +10420 rapid rotation drives a non-spherical and polar enhanced mass loss as inferred from theoretical considerations (e.g. Owocki et al., 1998). This would be in line with the fact that IRC +10420 is a massive star in a highly evolved evolutionary stage and would also qualitatively fit to the observed blueshift of the Brline. However, the major difference between the differential and closure phases of Car and IRC +10420 is that in IRC +10420 the phase signal in stronger in the redshifted wing of the Bremission and not in the blueshifted wing as in the case of Car. This makes the modeling of the IRC +10420 data more puzzling and probably indicates that the complexity of the overall structure of the innermost wind region IRC +10420 goes well beyond the capabilities of a 2-D modeling as carried out in this paper.
Nevertheless, our modeling indicates that a substantial fraction of the redshifted line emission does not reach the observer. Since our modeling is restricted to an axisymmetric outflow geometry, the fact that we were not able to reproduce all AMBER observables simultaneously (in particular the phases) might indicate the following:
-
The mass outflow from IRC +10420 is indeed intrinsically highly asymmetric. In this case, one of the hemispheres (which is pointing towards us and, thus, emitting blueshifted Br) has a much higher mass-loss rate than the other hemisphere (responsible for the redshifted light). We can only speculate on the reason for such a strong asymmetry in the outflow but, in principle, such asymmetries could be connected to large-scale asymmetries in the surface structure of the central star (e.g., hot spots) which lead to preferred directions of mass ejection (Humphreys et al., 2002). In this context, it is interesting to note that recent CO measurements (Castro-Carrizo et al., 2007; Dinh-V.-Trung et al., 2009) detected a flux deficit in the CO shells in the south-western direction. Thus, IRC +10420 seems to exhibit an asymmetry in the same direction as found in our study also on much larger spatial scales, indicating that this asymmetry might be of a long-term nature.
-
The wind of IRC +10420 is axisymmetric, but the redshifted light is blocked by an optically-thick disk which would also explain the strong phase signal in the redshifted part of the Bremission. Interestingly, such a disk has to be located very close to the star ( mas) in order to block the Bremission, and would have to be formed of mainly neutral+molecular gas in order to effectively absorb the redshifted light, since the presumed dust sublimation radius is located much farther out, at scales of mas. An yet undetected binary companion could also cause the presence of an equatorial disk.
-
IRC +10420 exhibits an inflow rather than an outflow, or maybe matter infall and outflow are present at the same time (Humphreys et al., 2002), for example in terms of an equatorial infall and a polar outflow. Such an equatorial infall could lead to the formation of an optically thick disk.
Of course, the above scenarios are not mutually exclusive, and both could contribute to explain the peculiar properties seen in IRC +10420 .
The study presented here has illustrated AMBER’s great potential to probe the innermost circumstellar gas environment of evolved stars with spectral resolutions up to 12 000. New observations of IRC +10420 covering more baselines and position angles, which are foreseen for forthcoming observing periods, will undoubtably provide a much clearer picture of the geometry of IRC +10420’s inner wind zone. For instance, new observations will help to support or disprove the model according to which IRC +10420 is exhibiting a prolate wind structure with a substantial shielding of the redshifted emission. Thus, further AMBER observations probing the inner wind zone of IRC +10420 will help to answer long-standing questions on the physical conditions and the mass-loss processes of this outstanding, rapidly evolving object and shed more light on the question of the mass-loss conditions in highly evolved massive stars.
Acknowledgements.
We thank the ESO VLTI team on Paranal and in Garching for carrying out the AMBER observations presented in this paper. The data presented here were reduced using the publicly available data reduction software package amdlib kindly provided by the Jean-Marie Mariotti Center (http://www.jmmc.fr/data_processing_amber.htm). We warmly thank John Hillier and Joe Busche for making CMFGEN and the Busche & Hillier (2005) codes available, and for continuous support with the codes. The high spectral resolution telluric spectra used in this work for spectral calibration of the AMBER data were created from data that was kindly made available by the NSO/Kitt Peak Observatory. Finally, we thank the anonymous referee for valuable comments which helped to considerably improve the manuscript.References
- Blöcker et al. (1999) Blöcker, T., Balega, Y., Hofmann, K.-H., et al. 1999, A&A, 348, 805
- Bowers (1984) Bowers, P. F. 1984, ApJ, 279, 350
- Bowers & Knapp (1989) Bowers, P. F. & Knapp, G. R. 1989, ApJ, 347, 325
- Busche & Hillier (2005) Busche, J. R. & Hillier, D. J. 2005, AJ, 129, 454
- Castro-Carrizo et al. (2001) Castro-Carrizo, A., Lucas, R., Bujarrabal, V., Colomer, F., & Alcolea, J. 2001, A&A, 368, L34
- Castro-Carrizo et al. (2007) Castro-Carrizo, A., Quintana-Lacaci, G., Bujarrabal, V., Neri, R., & Alcolea, J. 2007, A&A, 465, 457
- Catala et al. (1984) Catala, C., Kunasz, P. B., & Praderie, F. 1984, A&A, 134, 402
- Christou et al. (1990) Christou, J. C., Ridgway, S. T., Buscher, D. F., Haniff, C. A., & McCarthy, Jr., D. W. 1990, in Astronomical Society of the Pacific Conference Series, Vol. 14, Astrophysics with Infrared Arrays, ed. R. Elston, 133
- Clark et al. (2005) Clark, J. S., Larionov, V. M., & Arkharov, A. 2005, A&A, 435, 239
- Cobb & Fix (1987) Cobb, M. L. & Fix, J. D. 1987, ApJ, 315, 325
- Cutri et al. (2003) Cutri, R. M., Skrutskie, M. F., van Dyk, S., et al. 2003, 2MASS All Sky Catalog of point sources. (The IRSA 2MASS All-Sky Point Source Catalog, NASA/IPAC Infrared Science Archive. http://irsa.ipac.caltech.edu/applications/Gator/)
- Davies et al. (2007) Davies, B., Oudmaijer, R. D., & Sahu, K. C. 2007, ApJ, 671, 2059
- de Wit et al. (2008) de Wit, W. J., Oudmaijer, R. D., Groenewegen, M. A. T., Hoare, M. G., & Malbet, F. 2008, A&A, 480, 149
- Diamond et al. (1983) Diamond, P. J., Norris, R. P., & Booth, R. S. 1983, A&A, 124, L4
- Dinh-V.-Trung et al. (2009) Dinh-V.-Trung, Muller, S., Lim, J., Kwok, S., & Muthu, C. 2009, ApJ, 697, 409
- Dyck et al. (1984) Dyck, H. M., Zuckerman, B., Leinert, C., & Beckwith, S. 1984, ApJ, 287, 801
- Fix & Cobb (1987) Fix, J. D. & Cobb, M. L. 1987, ApJ, 312, 290
- Gai et al. (2003) Gai, M., Corcione, L., Lattanzi, M. G., et al. 2003, Memorie della Societa Astronomica Italiana, 74, 472
- Giguere et al. (1976) Giguere, P. T., Woolf, N. J., & Webber, J. C. 1976, ApJ, 207, L195
- Gitton et al. (2004) Gitton, P. B., Leveque, S. A., Avila, G., & Phan Duc, T. 2004, in Society of Photo-Optical Instrumentation Engineers (SPIE) Conference Series, Vol. 5491, Society of Photo-Optical Instrumentation Engineers (SPIE) Conference Series, ed. W. A. Traub, 944
- Groh et al. (2006) Groh, J. H., Hillier, D. J., & Damineli, A. 2006, ApJ, 638, L33
- Groh et al. (2008) Groh, J. H., Oliveira, A. S., & Steiner, J. E. 2008, A&A, 485, 245
- Hillier (1987) Hillier, D. J. 1987, ApJS, 63, 947
- Hillier (1989) Hillier, D. J. 1989, ApJ, 347, 392
- Hillier (1991) Hillier, D. J. 1991, A&A, 247, 455
- Hillier & Miller (1998) Hillier, D. J. & Miller, D. L. 1998, ApJ, 496, 407
- Hrivnak et al. (1989) Hrivnak, B. J., Kwok, S., & Volk, K. M. 1989, ApJ, 346, 265
- Humphreys et al. (2002) Humphreys, R. M., Davidson, K., & Smith, N. 2002, AJ, 124, 1026
- Humphreys et al. (1997) Humphreys, R. M., Smith, N., Davidson, K., et al. 1997, AJ, 114, 2778
- Humphreys et al. (1973) Humphreys, R. M., Strecker, D. W., Murdock, T. L., & Low, F. J. 1973, ApJ, 179, L49
- Ivezic & Elitzur (1997) Ivezic, Z. & Elitzur, M. 1997, MNRAS, 287, 799
- Jones et al. (1993) Jones, T. J., Humphreys, R. M., Gehrz, R. D., et al. 1993, ApJ, 411, 323
- Kastner & Weintraub (1995) Kastner, J. H. & Weintraub, D. A. 1995, ApJ, 452, 833
- Klochkova et al. (1997) Klochkova, V. G., Chentsov, E. L., & Panchuk, V. E. 1997, MNRAS, 292, 19
- Klochkova et al. (2002) Klochkova, V. G., Yushkin, M. V., Chentsov, E. L., & Panchuk, V. E. 2002, Astronomy Reports, 46, 139
- Knapp & Morris (1985) Knapp, G. R. & Morris, M. 1985, ApJ, 292, 640
- Le Bouquin et al. (2008) Le Bouquin, J.-B., Bauvir, B., Haguenauer, P., et al. 2008, A&A, 481, 553
- Lipman et al. (2000) Lipman, E. A., Hale, D. D. S., Monnier, J. D., et al. 2000, ApJ, 532, 467
- McLaren & Betz (1980) McLaren, R. A. & Betz, A. L. 1980, ApJ, 240, L159
- Meilland et al. (2007) Meilland, A., Millour, F., Stee, P., et al. 2007, A&A, 464, 73
- Menten & Alcolea (1995) Menten, K. M. & Alcolea, J. 1995, ApJ, 448, 416
- Monnier et al. (2004) Monnier, J. D., Millan-Gabet, R., Tuthill, P. G., et al. 2004, ApJ, 605, 436
- Mutel et al. (1979) Mutel, R. L., Fix, J. D., Benson, J. M., & Webber, J. C. 1979, ApJ, 228, 771
- Nedoluha & Bowers (1992) Nedoluha, G. E. & Bowers, P. F. 1992, ApJ, 392, 249
- Nenkova et al. (1999) Nenkova, M., Ivezic, Z., & Elitzur, M. 1999, LPI Contributions, 969, 20
- Nenkova et al. (2000) Nenkova, M., Ivezić, Ž., & Elitzur, M. 2000, Thermal Emission Spectroscopy and Analysis of Dust, Disks, and Regoliths, 196, 77
- Oudmaijer (1998) Oudmaijer, R. D. 1998, A&AS, 129, 541
- Oudmaijer et al. (1994) Oudmaijer, R. D., Geballe, T. R., Waters, L. B. F. M., & Sahu, K. C. 1994, A&A, 281, L33
- Oudmaijer et al. (1996) Oudmaijer, R. D., Groenewegen, M. A. T., Matthews, H. E., Blommaert, J. A. D. L., & Sahu, K. C. 1996, MNRAS, 280, 1062
- Owocki et al. (1998) Owocki, S. P., Cranmer, S. R., & Gayley, K. G. 1998, Ap&SS, 260, 149
- Patel et al. (2008) Patel, M., Oudmaijer, R. D., Vink, J. S., et al. 2008, MNRAS, 385, 967
- Petrov et al. (2007) Petrov, R. G., Malbet, F., Weigelt, G., et al. 2007, A&A, 464, 1
- Quintana-Lacaci et al. (2007) Quintana-Lacaci, G., Bujarrabal, V., Castro-Carrizo, A., & Alcolea, J. 2007, A&A, 471, 551
- Reid et al. (1979) Reid, M. J., Moran, J. M., Leach, R. W., et al. 1979, ApJ, 227, L89
- Richichi et al. (2005) Richichi, A., Percheron, I., & Khristoforova, M. 2005, A&A, 431, 773
- Ridgway et al. (1986) Ridgway, S. T., Joyce, R. R., Connors, D., Pipher, J. L., & Dainty, C. 1986, ApJ, 302, 662
- Robbe-Dubois et al. (2007) Robbe-Dubois, S., Lagarde, S., Petrov, R. G., et al. 2007, A&A, 464, 13
- Sudol et al. (1999) Sudol, J. J., Dyck, H. M., Stencel, R. E., Klebe, D. I., & Creech-Eakman, M. J. 1999, AJ, 117, 1609
- Tatulli et al. (2007) Tatulli, E., Millour, F., Chelli, A., et al. 2007, A&A, 464, 29
- Trammell et al. (1994) Trammell, S. R., Dinerstein, H. L., & Goodrich, R. W. 1994, AJ, 108, 984
- Traub (1998) Traub, W. A. 1998, in Presented at the Society of Photo-Optical Instrumentation Engineers (SPIE) Conference, Vol. 3350, Society of Photo-Optical Instrumentation Engineers (SPIE) Conference Series, ed. R. D. Reasenberg, 848
- Weigelt et al. (2007) Weigelt, G., Kraus, S., Driebe, T., et al. 2007, A&A, 464, 87
- Wittkowski et al. (2008) Wittkowski, M., Boboltz, D. A., Driebe, T., et al. 2008, A&A, 479, L21
- Zsargó et al. (2008) Zsargó, J., Hillier, D. J., & Georgiev, L. N. 2008, A&A, 478, 543