11email: bparise@mpifr-bonn.mpg.de 22institutetext: European Southern Observatory, Karl-Schwarzschild-Str. 2, 85748 Garching bei München, Germany 33institutetext: LUTH, Observatoire Paris-Meudon, 5 Place Jules Janssen, 92195 Meudon Cedex, France 44institutetext: California Institute of Technology, MC 301-17, Pasadena, CA 91125, USA
Deuterium chemistry in the Orion Bar PDR††thanks: Based on observations with the IRAM 30 m telescope at Pico Veleta (Spain) and the Atacama Pathfinder EXperiment (APEX) telescope. IRAM is funded by the INSU/CNRS (France), the MPG (Germany) and the IGN (Spain). APEX is a collaboration between the Max-Planck-Institut für Radioastronomie, the European Southern Observatory, and the Onsala Space Observatory.
Abstract
Context. High levels of deuterium fractionation in gas-phase molecules are usually associated with cold regions, such as prestellar cores. Significant fractionation ratios are also observed in hot environments such as hot cores or hot corinos, where they are believed to be produced by the evaporation of the icy mantles surrounding dust grains, and thus are remnants of a previous cold (either gas-phase or grain surface) chemistry. The recent detection of DCN towards the Orion Bar, in a clump at a characteristic temperature of 70 K, has shown that high deuterium fractionation can also be detected in PDRs. The Orion Bar clumps thus appear as a good environment for the observational study of deuterium fractionation in luke-warm gas, allowing to validate chemistry models in a different temperature range, where dominating fractionation processes are predicted to be different than in cold gas ( 20 K).
Aims. We aimed at studying observationally in detail the chemistry at work in the Orion Bar PDR, to understand if DCN is produced by ice mantle evaporation, or is the result of warm gas-phase chemistry, involving the CH2D+ precursor ion (which survives higher temperatures than the usual H2D+ precursor).
Methods. Using the APEX and the IRAM 30 m telescopes, we targetted selected deuterated species towards two clumps in the Orion Bar.
Results. We confirmed the detection of DCN and detected two new deuterated molecules (DCO+ and HDCO) towards one clump in the Orion Bar PDR. Significant deuterium fractionations are found for HCN and H2CO, but a low fractionation in HCO+. We also give upper limits for other molecules relevant for the deuterium chemistry.
Conclusions. We argue that grain evaporation in the clumps is rather unlikely to be dominant, and we find that the observed deuterium fractionation ratios are consistent with predictions of pure gas-phase chemistry models at warm temperatures (T 50 K). We show evidence that warm deuterium chemistry driven by CH2D+ is at work in the clumps.
Key Words.:
interstellar medium – astrochemistry – deuterium chemistry – gas/grain interaction1 Introduction
Despite the low deuterium abundance in the universe (D/H 10-5, Linsky, 2003), high abundances of deuterated molecules have been observed in dark clouds and star forming regions in the last few years, with detections of molecules containing up to three atoms of deuterium (ND3: Lis et al. 2002; van der Tak et al. 2002, and CD3OH: Parise et al. 2004), with noteworthy fractionation effects (CD3OH/CH3OH 1%, Parise et al., 2004).
Formation of such highly-deuterated molecules requires specific physical conditions, which makes them very interesting probes of the environments where they are observed. In molecular clouds, deuterium is mainly locked into molecular HD. Efficient transfer of deuterium from this reservoir at the low temperature of dark clouds has to occur through ion-molecule reactions, and it has long been known that only a few ions react fast enough with HD to compete against electron recombination: H, CH (Huntress, 1977) and C2H (Herbst et al., 1987). The deuterated isotopologues of these three ions are thus considered to be the precursors of deuterium fractionation in the gas phase. The transfer of deuterium from the HD reservoir to other molecules is initiated through the following exothermic reactions:
H2D+, CH2D+ and C2HD+ then transfer their deuterium to the other species through ion-molecule reactions. Exothermicities are 232 K (Gerlich et al., 2002) for reaction (1), 390 K (Asvany et al., 2004) for reaction (2) and 550 K (Herbst et al., 1987) for reaction (3), so that the reverse reactions are inhibited at low temperatures. Efficient transfer of deuterium to molecules has been widely observed in cold regions where high levels of CO depletion are present, such as dark clouds or prestellar cores. In these environments, H is predominantly responsible for the fractionation. Reaction (2) is thought to be predominant at slightly higher temperature (T 30-50 K), when (1) is not efficient anymore due to an increased importance of its reverse reaction. Although the chemistry involving H2D+ is now basically understood, thanks to the numerous detections of H2D+ in prestellar cores (e.g. Caselli et al., 2003, 2008) and the parallel development of chemical models (e.g. Roberts et al., 2003; Walmsley et al., 2004; Flower et al., 2004; Pagani et al., 2009), the contribution of the CH2D+ chemistry has so far not been observationally investigated, due to the lack of observations targetting intermediate temperature sources, warm enough so that the CH2D+ contribution becomes significant relative to H2D+, and cold enough for the chemistry not to be dominated by ice evaporation.
Recently, during an unbiased spectral survey of the Orion Bar using the APEX telescope, we detected a deuterated molecule (DCN) for the first time in a molecular clump in a Photon-Dominated Region (hereafter PDR, Leurini et al., 2006). This was however unexpected due to the high temperature (T 70 K) characteristic of this clump. The fractionation ratio deduced from these observations is 0.7 %, a value intermediate between the one observed in dark clouds (L134, 5%, Turner, 2001) and hot cores (Orion, 0.1%, Schilke et al. 1992; a sample of hot cores, 0.1-0.4%, Hatchell et al. 1998).
DCO+ was not detected in this survey, with an upper limit on the DCO+/HCO+ ratio of 0.1 % (see below), although observations in other environments point to similar fractionation ratios for the two species (dark cloud L134: Tiné et al. 2000, Turner 2001; low-mass protostar IRAS16293: van Dishoeck et al 1995). We proposed that this may be an indication that chemistry involving CH2D+ as precursor for deuterium transfer to molecules is at work in the Orion Bar, making it a reference environment to study in further detail reactions involving these routes. This possibility was confirmed by the theoretical modelling study of Roueff et al. (2007). Since the DCN detection by Leurini et al. (2006), DCO+ was detected towards the Horsehead PDR (Pety et al., 2007), in a cold (10-20 K) condensation shielded from the UV illumination. The observations we present in this paper are targetting warmer regions than the condensation observed by Pety et al. (2007).
We present here a detailed investigation on the deuterium chemistry at work in the dense clumps in the Orion Bar, based on observations with the APEX and IRAM 30m telescopes. Observations are described in section 2, the physical conditions in the clumps (temperature and H2 densities) are derived in section 3, the relative abundances and fractionations for targetted molecules are determined in section 4, and the chemistry is discussed in section 5.
2 Observations
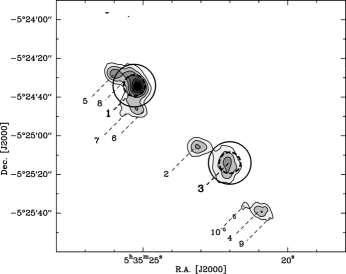
The Orion Bar, located in the Orion A molecular cloud, is a well studied PDR, mostly because of its nearly edge-on morphology. Its distance is estimated to 414 pc (Menten et al., 2007). It is illuminated by the young trapezium stars, located some 2′ to the north-west. Previous studies have shown that this PDR has a clumpy structure (see section 3). The interferometric observations of Lis & Schilke (2003) displayed a series of molecular clumps, as traced by the H13CN(1–0) transition, located in the cloud some 10′′ behind the H/H2 transition. In the present study we use the nomenclature defined by Lis & Schilke (2003) to refer to the clumps.
We present in this section the APEX and IRAM 30m observations of the Orion Bar, targetting particularly clump 1 and 3 of Lis & Schilke (2003). Unless otherwise stated, the transition frequencies of the molecules are taken from the Cologne Database for Molecular Spectroscopy (Müller et al., 2001, 2005). Table 1 summarizes the observations presented in this paper.
2.1 APEX observations
Using the APEX telescope on Chajnantor (Chile), we mapped the Orion Bar in the DCN(4–3) and H13CN(4–3) transitions. The double-sideband APEX2a receiver (Risacher et al., 2006) was tuned to 289.0000 GHz (DCN) and 345.3397 GHz (H13CN), and connected to the two units of the FFTS backend (Klein et al., 2006), each with 8192 channels, leading to a velocity resolution of 0.13 and 0.11 km/s respectively over the two times 1 GHz bandwidths. The APEX beamsize is 21′′ (respectively 18′′) at 289 GHz (respectively 345 GHz).
The (0′′, 0′′) position of the map is (2000)=05h35m25.3s, (2000)=05∘24′34.0′′, corresponding to the ”Orion Bar (HCN)” position of Schilke et al. (2001), the most massive clump seen in H13CN (Lis & Schilke, 2003), as well as the target of the spectral survey of Leurini et al. (2006). The maps were obtained using the on-the-fly mode, with a dump every 6′′. The reference position was taken at the (600′′, 0′′) offset position from the center of the map.
The observations were performed between July 19th and August 2nd, 2006, under very good to good weather conditions (with a precipitable water vapor ranging from 0.3 to 1.5 mm). The typical DSB system temperatures were 115 and 200 K at 289 and 345 GHz respectively.
Several CH3OH(6-5) transitions were also present in the DCN(4–3) setup. DCN(5–4) and HNC(4–3) were observed towards the two clumps on June 28th, 2007, with Tsys around 200 K.
Observed intensities were converted to Tmb using where = 0.73 (Güsten et al., 2006).
We focus here on the observations towards clumps 1 and 3, and analyze the spatial distribution across the Bar in a later paper (Parise et al. in prep).
2.2 IRAM 30m observations
We targetted the Orion Bar during three observing runs at the IRAM 30 m telescope. During the first run we made use of the ABCD receivers, targetting only the two clumps in the Bar. The second run consisted of mapping the Bar with the HERA receiver. Some complementary data on the two clumps were also acquired as part of a third run.
2.2.1 Single pixel receivers
Using the IRAM 30 m telescope, we observed different species toward the two brightest H13CN clumps of the Orion Bar —“clump 1” at offset position (0′′, 0′′) and “clump 3” at position (50′′, 40′′), as denoted by Lis & Schilke (2003). Besides observing different transitions of DCN to constrain the excitation, and looking for a lower excitation line of DCO+ than the one that was not detected with APEX, we selected for our search molecules that can be synthesized in the gas phase via channels involving the CH2D+ ion. Such molecules include HDCO and C2D (Turner, 2001). We also searched for CH2DOH and HDO, in order to constrain any possible ice chemistry contribution.
The observations were performed from September 29th to October 7th, 2006, under variable weather conditions. Four receivers were used simultaneously to observe two different frequency bands (either in the AB or CD setup). The observed lines are listed in Table 1. The receivers were connected to the VESPA correlator in parallel mode, leading to different velocity resolutions depending on the transition. Additionally, the Bonn Fourier Transform Spectrometer (Klein et al., 2006) was connected to two of the receivers, providing a 850 MHz bandwidth.
Some additional data (DCN(3–2) as well as integration on CH2DOH towards both clumps) were taken during a third observing run in May 2008, under poor (CH2DOH data) to moderate (DCN data) weather conditions.
2.2.2 HERA observations
The Orion Bar was mapped in selected methanol and formaldehyde transitions using the HERA receiver, a heterodyne array consisting of two arrays of 33 pixels with 24′′ spacing. The observations were performed during the winter 2007 HERA pool observing period. The full dataset is presented in Leurini et al. (2009). Here we analyse the methanol observations towards the two clumps to derive their physical properties.
All intensities of observations from the IRAM 30 m telescope were converted to Tmb using where is the main beam efficiency, and is the forward efficiency. The main beam efficiencies decrease from 78% to 50% between 87 and 241 GHz111See http://www.iram.es/IRAMES/telescope/telescopeSummary/ telescope_summary.html. Forward efficiency is 95% at 3 mm, 93% at 2 mm and 91% at 1.3 mm.
| Transition | Frequency | Telescope | Beamsize | Targetted |
| (GHz) | Clump | |||
| DCN(2–1) | 144.8280015 | IRAM 30 m | 17′′ | 1, 3 |
| DCN(3–2) | 217.2385378 | IRAM 30 m | 11′′ | 1, 3 |
| DCN(4–3) | 289.6449170 | APEX | 21′′ | map |
| DCN(5–4) | 362.0457535 | APEX | 17′′ | 1, 3 |
| DCO+(2–1) | 144.0772890 | IRAM 30 m | 17′′ | 1, 3 |
| HDCO(211-110) | 134.2848300 | IRAM 30 m | 18′′ | 3 |
| CH2DOH(2–1) | 89.3 (band) | IRAM 30 m | 28′′ | 1, 3 |
| HDO(21,1-21,2) | 241.56155001 | IRAM 30 m | 10′′ | 3 |
| C2D(2–1) | 144.3 (band) | IRAM 30 m | 17′′ | 3 |
| DNC(2–1) | 152.609774 | IRAM 30 m | 16′′ | 3 |
| H13CN(1–0) | 86.3399215 | IRAM 30 m | 28′′ | 1, 3 |
| H13CN(3–2) | 259.0117978 | IRAM 30 m | 9.5′′ | 1, 3 |
| H13CN(4–3) | 345.3397694 | APEX | 18′′ | map |
| H13CO+(1–0) | 86.7542884 | IRAM 30 m | 28′′ | 1, 3 |
| HCO+(1–0) | 89.1884957 | IRAM 30 m | 28′′ | 1, 3 |
| HCO(211-110) | 146.6356717 | IRAM 30 m | 17′′ | 3 |
| C17O(1–0) | 112.36 | IRAM 30 m | 22′′ | 3 |
| C17O(2–1) | 224.71 | IRAM 30 m | 11′′ | 3 |
| CH3OH(5–4)2 | 241.8 (band) | IRAM 30 m | 10′′ | map |
| CH3OH(6–5) | 290.1 (band) | APEX | 21′′ | 1, 3 |
| CH3OH(11–10 A) | 303.367 | APEX | 21′′ | 1, 3 |
| HNC(4–3) | 362.63 | APEX | 17′′ | 1,3 |
1 JPL database.
2 HERA observations (see Leurini et al. (subm) for more detail).
3 The clumpy morphology of the Orion Bar
The Orion Bar was shown to have an heterogeneous structure, with clumpy molecular cores embedded in an interclump gas. The two-component morphology was first inferred by Hogerheijde et al. (1995) and Jansen et al. (1995), because single-dish observations of CS, H2CO and HCO+ could not be fit with a single density component. The clumpy structure was later confirmed directly by interferometric observations (Young Owl et al., 2000). The clumps have a density of several 106 cm-3 while the density of the interclump gas is 104-105 cm-3 (Young Owl et al., 2000). Interferometric maps have shown that H13CN is mostly confined to the clumps (Lis & Schilke, 2003), which are relatively cold (70 K) compared to the interclump gas (of typical temperature of 150 K).
In the following, we discuss the physical parameters of the clumps, based on new observations. We first derive the H2 column density (Section 3.1), and then the temperature and H2 density based on methanol observations (Section 3.2).
3.1 The H2 column density of the clumps
In this section, we attempt to derive the H2 column density in the two clumps as accurately as possible, in order to be able to compute molecular abundances relative to H2 in the following sections. This will then allow us to compare the measured fractional abundances to predictions of chemical models.
3.1.1 Clump 1
An H2 column density of 9 1022 cm-2 averaged on the 18′′ beam was derived towards clump 1 by Leurini et al. (2006) from analysis of the C17O(3-2) emission line, assuming a rotational temperature of 70 K.
We can also get an estimate of the H2 column density in the clump from the analysis of the dust emission observed in the frame of a project targetting clump 1 with the Plateau de Bure interferometer in March, April and December 2004 (follow-up project of the work from Lis & Schilke, 2003). The observations were performed in the mosaic mode, with seven fields covering clump 1 in a hexagonal pattern with a central field. The 3 mm receivers were tuned at the 13CO(1–0) frequency (110 GHz), and the 1 mm receivers targetted H2CO at 218 GHz. The array configurations, UV coverage and 1 mm observations are discussed in detail in Leurini et al. (2009). The receiver temperatures at 3 mm were around 200 K or better.
Although continuum emission from clump 1 is not detected at 1 mm, weak emission is detected at 3mm. This suggests that the density profile of the clump is rather smooth, and that its emission is mostly filtered out by the interferometer at 1mm. The integrated intensity measured in a 10′′ diameter aperture centered on the clump is 0.043 Jy, and 0.12 Jy in a 20′′ diameter aperture. Assuming Tdust = 45 K (see section 3.2), = 2 and = 3.09 10-1 cm2 g-1 (Ossenkopf & Henning, 1994), we derive N = 1.6 1023 cm-2 (resp 1.1 1023 cm-2) averaged in a 10′′ (resp 20′′) area centered on the clump. These values are intermediate and consistent within a factor of 2 both with the column densities derived by Leurini et al. (2006), and by Lis & Schilke (2003) from H13CN observations (2.6 1023 cm-2). In the following, we will use our newly derived value N = 1.6 1023 cm-2.
3.1.2 Clump 3
Clump 3 was not targetted by the Plateau de Bure observations presented in sec. 3.1.1. No continuum was either detected at 3 mm in the study of Lis & Schilke (2003), which points to the fact that the density profile of the clump may be again rather smooth. From the H13CN observations of Lis & Schilke (2003), the H2 column density is 1.9 1023 cm-2.
Using the IRAM 30 m telescope, we targetted the 1–0 and 2–1 transitions of C17O towards this clump. The hyperfine structure of the 1–0 transition is clearly resolved. The two observed lines have a rotation temperature of 12 K, and lead to a N = 8 1022 cm-2, averaged on the extent of the clump (8′′, see below).
In the following, we therefore assume an intermediate value between the column density as measured from H13CN and C17O, N = 1.3 1023 cm-2, averaged on the 8′′ clump.
3.2 Physical conditions in the clumps : CH3OH analysis
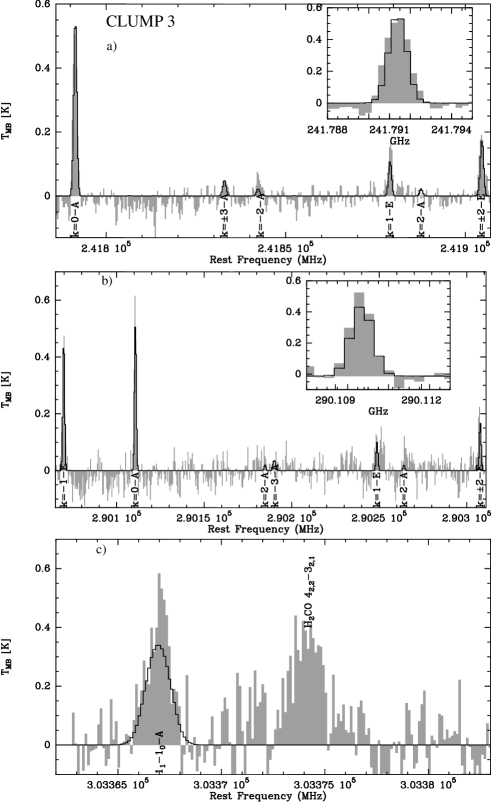
To determine the properties of the gas in the clumps, we analysed the methanol emission at 241 and 290 GHz. The beam of the APEX telescope at 290 GHz is almost twice as large as the one of the IRAM antenna, and therefore samples different gas volumes (see Fig. 1). We therefore smoothed the HERA data to the resolution of the APEX telescope at 290 GHz. For the analysis, we used the technique described by Leurini et al. (2004) for the study of multi-line CH3OH observations, which consists of modelling all the lines simultaneously with a synthetic spectrum computed using the Large Velocity Gradient approximation, and comparing it to the observations. Rest frequencies are from Xu & Lovas (1997), while the collisional rates were computed by Pottage et al. (2002, 2004). The parameters defining the synthetic spectrum are: source size, kinetic temperature, column density, velocity width and velocity offset (from the systematic velocity of the object). The line width and the velocity of the object are not free parameters, but are given as input values to the model. Finally, several velocity components, which are supposed to be non-interacting, can be introduced.
| Source | S | T | N | x | |
|---|---|---|---|---|---|
| [”] | [cm-3] | [K] | [cm-2] | ||
| clump 1 | 10 | 45 | 210-9 | ||
| clump 3 | 8 | 35 | 210-9 |
For our analysis, we modelled the emission towards each clump with a single component model, and neglected effects due to infrared pumping. We used as free parameters the column density of the two symmetry states of methanol, CH3OH- and CH3OH-, the kinetic temperature of the gas, and the H2 density. For clump 3, we used a source size of as derived from H13CN by Lis & Schilke (2003). For clump 1, the source size derived from the analysis of the H13CN emission is ; however, other clumps partially fall in the beam size of our observations (see Fig. 1). Therefore, we adopted a source size of which should take into account for the emission of the other clumps at the edge of the beam. This corresponds to the assumption that all clumps in the Bar have similar physical properties.
The methanol spectra from the two clumps are very similar, although clump 3 is shifted in velocity of 0.7 km s-1 with respect to clump 1 ( 10.0 km s-1 at clump 1, 10.7 km s-1 at clump 3). The spectra are characterised by narrow lines ( 1.2 km s-1), and no emission is detected in transitions with upper level energies corresponding to more than 85 K. As already discussed by Leurini et al. (2006), at the original velocity resolution of the APEX observations ( 0.12 km s-1), the CH3OH ground state lines toward clump 1 show a double-peaked profile, probably due to the different clumps sampled by the beam. Since no double-peaked profile is detected in the IRAM data ( 0.38 km s-1) towards the same position, we smoothed the APEX spectra towards clump 1 to the same velocity resolution as the IRAM data. No double-peaked profile is detected towards clump 3. However, given the low signal to noise ratio of the APEX observations, we smoothed these data to a resolution of km s-1. The main difference in the methanol spectra of the two clumps is in the - line at 303.4 GHz which is much stronger in clump 3. Since this line has a lower level energy of 2.3 K, this suggests that clump 3 is colder than clump 1.
In Table 2 we report the results of the best fit models for both clumps. For the column density, the total value of the column density for the two symmetry states is given. The high value for the spatial density suggests that the gas is close to thermal equilibrium, as verified by the results of our LVG calculations that show that most lines are partially sub-thermal. We carried out a analysis to derive the uncertainties on the kinetic temperature, density and column density. The values of the confidence levels of each parameters are reported in Table 2.
All lines are well fitted by the model, with the only exception of the - transition. The behaviour of this line remains unclear: in massive star forming regions (Leurini et al., 2007) the - is observed with an intensity roughly half of that of the blend of the - lines, as expected since the three transitions have very similar energies. On the other hand, the - transition in the Orion Bar shows the same intensity of the - lines blend, and cannot be fitted by our models.
For clump 3, the intensities of the ground state lines in the band, and in the - line at 303.4 GHz are understestimated. The - transition is very low in energy, and it is expected to be more intense in cold regions. This suggests that a two component model, with a layer of gas at a lower temperature, could be more appropriate for clump 3. However, the reduced for our model is 1.8, which is still reasonable for a simplified analysis.
The spectra for clump 1 and clump 3 are very similar. We therefore present in Figure 2 the synthetic spectra for the best fit model overplotted on the observed spectra for clump 3 only . The second feature in Fig. 2(c) is identified with (4) H2CO from the lower side band.
| clump 1 | clump 3 | |||||
| Position | (0′′, 0′′) | (50′′, 40′′) | ||||
| Transition | Tmb dv | FWHM | Vlsr | Tmb dv | FWHM | Vlsr |
| (K km s-1) | (km s-1) | (km s-1) | (K km s-1) | (km s-1) | (km s-1) | |
| DCN(2–1) | 2.200.04 | 1.9 (hfs) | 10.00.1 | 4.110.05 | 1.3 (hfs) | 10.70.1 |
| DCN(3–2) | 1.620.03 | 1.60.1 | 10.00.1 | 1.700.11 | 1.10.2 | 10.60.1 |
| DCN(4–3) | 1.150.07 | 1.30.1 | 10.10.1 | 1.750.23 | 1.40.3 | 10.80.1 |
| DCN(5–4) | 0.250.04∗ | 1.9∗ | – | 0.630.10 | 1.70.1 | 10.70.1 |
| H13CN(1–0) | 1.510.05 | 1.8 (hfs) | 10.10.1 | 1.720.05 | 1.6 (hfs) | 10.60.1 |
| H13CN(3–2) | 4.490.04 | 1.10.1 | 10.00.1 | 3.400.04 | 1.30.1 | 10.70.1 |
| H13CN(4–3) | 1.660.06 | 1.80.1 | 10.10.1 | 1.720.10 | 2.00.1 | 10.90.1 |
| DCO+(2–1) | 0.03 (3) | 1.8⋆ | – | 0.120.01 | 1.210.14 | 10.70.1 |
| H13CO+(1–0) | 0.400.02 | 1.750.12 | 10.10.1 | 0.500.02 | 2.200.11 | 10.50.1 |
| HCO+(1–0) | 27.8∗∗ | 2.080.26 | 9.90.3 | 35.3∗∗ | 2.170.03 | 10.50.1 |
| HDCO(211–110) | – | – | – | 0.0410.005 | 1.200.16 | 10.40.1 |
| HCO(211–110) | – | – | – | 0.2160.014 | 1.910.15 | 10.80.1 |
| C2D(2–1) | – | – | – | 0.042 (3) | 1.5⋆ | – |
| CH2DOH(2–1) | 0.008 (3) | 1.8⋆ | – | 0.011 (3) | 1.5⋆ | – |
| HDO | – | – | – | 0.093 (3) | 1.5⋆ | – |
| DNC(2–1) | – | – | – | 0.019 (3) | 1.5⋆ | – |
| HNC(4–3) | – | – | – | 3.030.06 | 2.10.1 | 10.80.1 |
∗Line blended with a line coming from the image sideband. Flux was computed with a two-component gaussian fit, keeping the linewidth fixed.
∗∗Integrated intensity computed without a Gaussian fit (the line is found to be non-Gaussian).
⋆Assumed width to compute the upper limit on the flux.
Uncertainties given on integrated intensities are just the errors given for a gaussian fit, and do not include the calibration uncertainties (assumed to be of the order of 15%).
All 3 upper limits are computed using the following relation: Tmb dv 3 rms
4 Deuterium fractionation in the clumps
Mapping of the DCN(4–3) emission across the Orion Bar with the APEX telescope shows that DCN emission originates in the H13CN clumps imaged by Lis & Schilke (2003). The overall distribution of DCN in the Bar will be the scope of a forthcoming paper (Parise et al. in prep). Here, we aim at studying the chemistry at work in the clumps, and therefore we target selected transitions of deuterated molecules towards clump 1 and 3.
In the following subsections we study the DCN excitation towards both clumps, present the detection of DCO+ and HDCO towards clump 3, and upper limits on the other molecules.
4.1 DCN and H13CN excitation
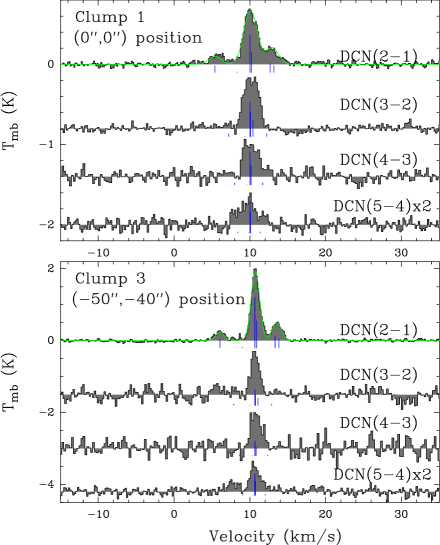
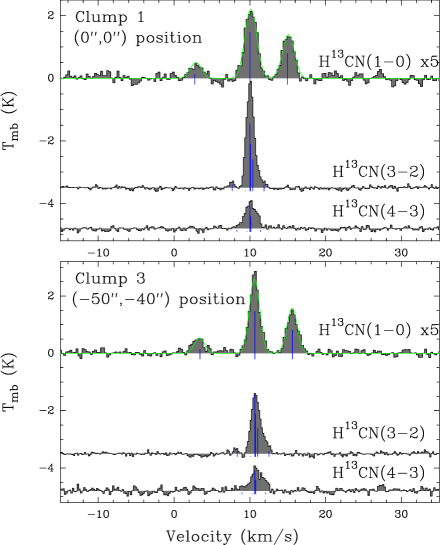
Figure 3 (resp. 4) shows the spectra of the several DCN (resp. H13CN) transitions observed towards the clumps with the IRAM 30m and the APEX telescopes. In the following subsections we study the excitation of these two molecules, using LTE and LVG methods.
4.1.1 LTE analysis
Although the critical densities of the DCN and H13CN levels are quite high, several 105 to several 106 cm-3, implying that the DCN and H13CN level populations may not be in LTE, it is instructive to draw rotational diagrams for the two groups of clumps. We corrected the observed line intensities for beam dilution effects by assuming a size of 7′′ for clump 1, and 8′′ for clump 3 (as derived by Lis & Schilke, 2003). The obtained rotational diagrams are presented in Figure 5, and the derived rotational temperatures and column densities are listed in Table 4.

| Rotational diagram | |||||
|---|---|---|---|---|---|
| Source | Trot(DCN) | NDCN | Trot(H13CN) | N | DCN/HCN∗ |
| (K) | (1013 cm-2) | (K) | (1013 cm-2) | (%) | |
| Clump 1 | 14.01.1 | 1.40.3 | 10.50.4 | 3.10.4 | 0.70.2 |
| Clump 3 | 11.90.5 | 1.90.3 | 9.90.4 | 2.50.3 | 1.10.2 |
| LVG analysis | |||||
| Source | Tkin DCN | NDCN | TkinH13CN | N | DCN/HCN∗ |
| (K) | (1013 cm-2) | (K) | (1013 cm-2) | (%) | |
| Clump 1 | 18 | 1.4 | 21 | 8.2 | 0.30.1 |
| Clump 3 | 32 | 1.0 | 26 | 1.9 | 0.80.3 |
Given error bars are 1. We note that the Tkin derived from LVG analysis of DCN and H13CN are consistent within the 3 uncertainty range with the Tkin values derived from methanol.
∗Assuming HCN/H13CN = 70 (Wilson, 1999).
Under the assumption that the lines are optically thin, which is confirmed by the hyperfine structure analysis (see section 4.1.2), the deviation from linearity in the rotational diagrams can be due either to the very different beam sizes of the different observations, or to non-LTE effects. The first effect is not completely taken out by correcting for beam dilution, because the source maybe be actually more extended than the smallest beam. This could explain in particular why the DCN(3-2) transition (observed in the smallest beam) is weaker than the other transitions. Although the clumps are very dense ( 5 106 cm-3), the critical density of the different levels of the molecules is so high that the levels are not populated in LTE. H13CN seems even further from LTE than DCN, which is consistent with the fact that critical densities for H13CN are around a factor two higher than for DCN. The departure from LTE increases with the increasing upper level energy. The DCN(5–4) transition in clump 1 is in particular subthermally excited compared to the three lower energy transitions. This line is however blended with an unidentified line coming from the image sideband (at 350.554 GHz). The unidentified line is shifted away from the DCN(5–4) lines towards clump 3 due to the slight velocity difference between the two clumps.
The square in Figure 5 represents the transition if all flux is considered to come from the DCN(5–4). This point is still too low compared to the three other transitions. It appears that the blending of the line cannot account for the low intensity of the DCN(5–4) emission, and that the J=5 level population is subthermal. After studying the hyperfine structure of the lower rotational transitions, we will model the line emission using a non-LTE method.
4.1.2 Hyperfine structure
DCN and H13CN rotational transitions have an hyperfine structure, caused by the interaction of the electric quadrupole moment of the N nucleus (I=1) with the molecular field gradient. This causes the transitions to be split into several components, reducing the opacity at the line center. This effect is most important for the lower transitions, DCN(2–1) and H13CN(1–0). From the relative intensity of the hyperfine components, it is possible to derive the opacity of the transition. This was done using the hfs method of the CLASS software (GILDAS package, http://www.iram.fr/IRAMFR/GILDAS/). This method fits the spectrum assuming the same excitation temperature for each hyperfine component. The results of the fits are shown in Table 5.
| Source | Line | vlsr | FWHM | T | Tex | ncr (50 K) | |
|---|---|---|---|---|---|---|---|
| (km s-1) | (km s-1) | (K) | (K) | (cm-3) | |||
| Clump 1 | DCN(2–1) | 10.010.02 | 1.900.04 | 1.20.1 | 0.70.2 | 5.01.8 | 9.1105 |
| H13CN(1–0) | 10.130.02 | 1.780.07 | 0.920.09 | 0.560.41 | 4.63.8 | 1.8105 | |
| Clump 3 | DCN(2–1) | 10.660.01 | 1.300.02 | 2.80.1 | 0.10.4 | 31.5127 | 9.1105 |
| H13CN(1–0) | 10.620.02 | 1.610.03 | 0.960.02 | 0.100.04 | 12.75.3 | 1.8105 |
The total opacity of the DCN(2–1) is found to be low. In the case where the opacity is well enough constrained so that the Tex can be accurately derived, the excitation temperature is rather low (Table 5). It should be however noted that the derived Tex value is a lower limit because of beam dilution. The excitation temperature provides a lower limit to the kinetic temperature, as the level populations might not be thermalized, due to the high critical densities of each transition. The same holds for H13CN(1–0). The transition is optically thin on both positions, and the excitation temperatures are also rather low.
4.1.3 DCN and H13CN column densities
In order to derive column densities, we used a standard LVG code. The hyperfine structure of the lower levels is not explicitely taken into account. However, to account for the reduced opacity due to the hyperfine splitting, we replaced the escape probability by a weighted mean of the escape probabilities of the hyperfine components: . For both isotopologues, we used collision coefficients calculated for HCN-He by Wernli & Faure (2009). These collision coefficients were uniformly scaled by a factor 1.37 (square root of the ratio of the reduced mass of the HCN-He and HCN-H2 systems) to approximate HCN-H2 collisions . This approximation is generally supposed by astronomers to be valid for HCN-pH2 collisions, as para-H2 has a spherical symmetry in its J=0 state. Theoretical computations have shown that the accuracy of this assumption is however limited, the discrepancy for individual rates reaching up to a factor of two for particular systems (H2O–H2/He, Phillips et al. 1996, CO–H2/He, Wernli et al. 2006; HC3N–H2/He, Wernli et al. 2007; SiS–H2/He, Lique et al. 2008), or even higher (NH3–H2/He, Maret et al. 2009). This is however the only solution as long as HCN–H2 collision rates are not available.
Input parameters for an LVG code are n, T and Nmol/v. Comparing modelled line temperatures with observations brings another parameter into play, the beam filling factor. On the observational side, we want to fit simultaneously for each molecule the observations of all available transitions and the opacity derived by the hfs method for the lower transition. There are thus 5 observables for DCN and 4 for H13CN. It is statistically rather meaningless to try to fit a sample of four/five observations with a 4-parameter model. We therefore use independently determined information for the source size (Lis & Schilke, 2003), and the H2 density as derived from methanol observations (see section 3.2), and only fit the temperature and the DCN and H13CN column densities.

Figure 6 shows as an example the analysis for fitting LVG models for the DCN molecule towards clump 1. The was computed using the 4 DCN transitions, weighted by uncertainties including a 15% calibration uncertainty of the integrated flux, as well as the opacity of the DCN(2-1) line as derived in 4.1.2. The derived kinetic temperature is consistent within the 3 uncertainty range with the one derived from the methanol analysis. The DCN column density compares also very well with the rotational diagram result. The 1 confidence interval for the two parameters is shown in Table 4. We analyzed in the same way the DCN emission towards clump 3 as well as the H13CN towards both clumps. The results are all shown in Table 4.
4.2 Low DCO+ emission
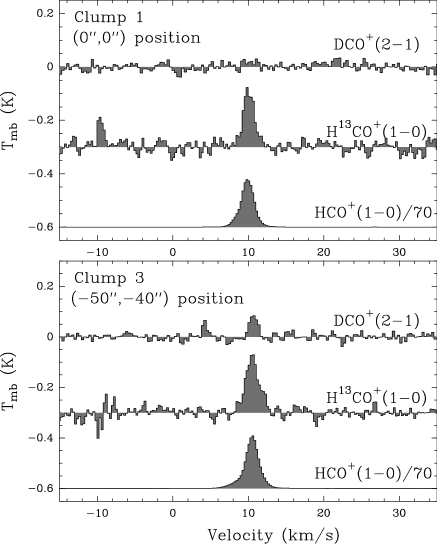
DCO+(2–1), H13CO+(1–0) and HCO+(1–0) were observed towards the two clumps. The spectra are presented in Figure 7. By comparison with H13CO+(1–0), HCO+(1–0) is found to be optically thin. The observed parameters are listed in Table 3. Note that toward clump 3 the linewidth of the H13CO+ and HCO+ lines are significantly larger than the HCN and DCN linewidths (as determined from the hyperfine structure fit). The thermal broadening expected for H13CO+ at 50 K is 0.27 km s-1, and 0.47 km s-1 at 150 K, the temperature characteristic of the interclump gas. This points to the fact that HCO+ and H13CO+ are also present in the warmer interclump gas, in agreement with the interferometric studies of Young Owl et al. (2000) and Lis & Schilke (2003), who claimed that a large fraction of the emission of H13CO+(1-0) is extended and thus filtered out by the interferometer.
On the other hand, we do not expect deuterated molecules to be at all present in the hot interclump gas in steady-state. The fact that the main isotopomers are likely to trace both the two gas components implies that the D/H ratio derived from the observations should be considered as a lower limit.
We estimate column densities towards the clumps (assuming resp. sizes of 7′′ and 8′′ for clump 1 and 3) for different rotational temperatures, assuming that all emission comes from the clumps. Although DCO+ and H13CO+ column densities vary by a factor of two to three for temperatures between 20 and 70 K, the abundance ratio is less affected by the temperature uncertainty (less than a factor of 1.5, see Table 6)
| clump 1 | clump 3 | |||||
|---|---|---|---|---|---|---|
| Trot | N | N | N/N1 | N | N | N/N1 |
| (cm-2) | (cm-2) | (cm-2) | (cm-2) | |||
| 20 K | 1.61011 | 1.01013 | 2.310-4 | (5.00.8)1011 | (9.90.1)1012 | (7.31.4)10-4 |
| 30 K | 2.01011 | 1.41013 | 2.010-4 | (6.21.0)1011 | (1.40.2)1013 | (6.41.3)10-4 |
| 40 K | 2.41011 | 1.81013 | 1.910-4 | (7.51.2)1011 | (1.80.2)1013 | (6.01.1)10-4 |
| 50 K | 2.81011 | 2.21013 | 1.810-4 | (8.91.4)1011 | (2.20.2)1013 | (5.91.0)10-4 |
| 70 K | 3.71011 | 3.11013 | 1.710-4 | (1.20.2)1012 | (3.00.3)1013 | (5.71.1)10-4 |
1We assume HCO+/H13CO+ = 70 (Wilson, 1999).
Can we quantify how much of the HCO+ emission actually comes from the clumps? Hogerheijde et al. (1995) modelled multi-frequency transitions of several molecules with a two-phase (interclump + clump) model, and they concluded that 10% of the column density of the material is in the clumps. We can then get an estimate of the clump contribution to H13CO+ emission. Since the emission is likely dominated by the interclump gas, we estimate the column density of HCO+ assuming a temperature of 150 K. For clump 3, we then find a column density of H13CO+ of 6.21013 cm-2. If the clump represents 10% of the column density, then N(H13CO+) 61012 cm-2 in the clump, which is roughly a factor of two to three lower than what we estimated. We may thus underestimate the DCO+/ HCO+ by a factor up to three.
4.3 Detection of HDCO
In order to test the possibility that the deuteration in the clumps originates in chemistry involving CH2D+, we targetted HDCO, a molecule synthesized in the gas phase via the CH2D+ route, through the following reactions (Turner, 2001; Roueff et al., 2007):
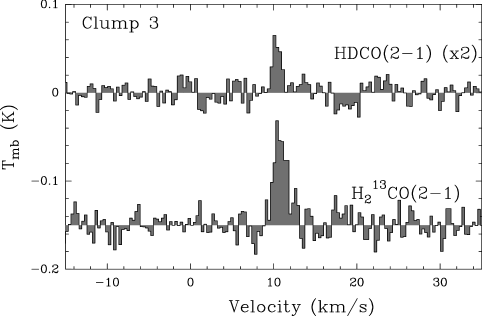
We detected the HDCO(2–1) transition towards clump 3 (Fig. 8). The line has a Vlsr of 10.4 km s-1, consistent with other lines detected towards this clump. The line width (1.2 km s-1) is also similar to those of other deuterated species (DCN, DCO+), making the detection of HDCO rather secure. We also detected the H213CO(2–1) line towards the same position.
We computed the column density of the two molecules using the LTE approximation. The column densities vary by a factor of three depending on the assumed temperature between 20 and 70 K. However, as the two observed lines have similar energies, the HDCO/H213CO ratio is less sensitive to the temperature, varying only by a factor of 1.2 over the whole temperature range, which lies within the error bar of the determined ratio. We give in Table 7 the column densities and D/H ratio for a fixed temperature of 35 K (as pointed by the analysis of the CH3OH emission). We assume again H213CO/H2CO = 70 (Wilson, 1999).
4.4 Upper limits on other interesting deuterated molecules
In the following, we derive upper limits on the fractional abundances of other deuterated molecules that were not detected. The discussion of the results is left to section 5.
4.4.1 C2D
C2D is another molecule believed to form in the gas phase from CH2D+. Roueff et al. (2007) predicted an D/H ratio for this molecule of 3.910-2, and an abundance of 6.610-11 with respect to H2, in their low metal model at 50 K.
The J = 2 – 1 band was observed towards clump 3. The VESPA correlator at the IRAM telescope showed unfortunately a lot of platforming. Using the 1MHz filter bank, the lines are not detected, and the rms is 8 mK (Tmb scale) at a resolution of 2.1 km s-1. Assuming a linewidth of 1.5 km s-1 (as found in HCN and DCN observations), we derive the flux upper limit listed in Table 3. Assuming a Trot of 35 K, this corresponds to an upper limit on the C2D column density of 2.5 1013 cm-2, and an upper limit for the fractional abundance of 2 10-10, compatible with the the prediction of Roueff et al. (2007).
4.4.2 DNC
DNC is synthesized in the gas phase, mainly from a route involving the H2D+ ion, as opposed to DCN which can be synthesized from CH2D+ (Turner, 2001; Roueff et al., 2007). We searched for the 2–1 transition of this species, to get constraints on the importance of the H2D+ chemistry in clump 3. We did not detect it, at a rms noise level of 9 mK (Tmb scale) and a resolution of 0.31 km s-1. We derive the flux upper limit listed in Table 3. This corresponds to an upper limit of 1.51011 cm-3 for the DNC column density (assuming Trot = 35 K), and an upper limit on the abundance relative to H2 of 1.010-12. Assuming that the HNC(4–3) line is optically thin, we find NHNC = 1.051013 cm-2. This has to be considered as a lower limit if HNC(4–3) is not optically thin. This translates into an upper limit of DNC/HNC 1.410-2 (3). This upper limit is not very constraining compared to the deuteration ratios measured in HCN, because HNC is found to be more than three orders of magnitude less abundant than HCN. The very high HCN/HNC ratio in the clump is to our knowledge one of the highest observed so far.
4.4.3 CH2DOH
We searched for monodeuterated methanol, which is believed to trace the evaporation of highly deuterated ices (Parise et al., 2002, 2004, 2006). We looked for the 2K – 1K rotational band at 89 GHz, corresponding to low energy transitions. CH2DOH was not detected towards any of the two clumps. Rms levels of 4 mK toward clump 1 and 6 mK toward clump 3 (Tmb scale) were reached, at a 0.26 km/s resolution. Assuming a linewidth of 1.8 (resp. 1.5) km s-1 for clump 1 (resp. 3), we derive the upper limit for the integrated intensity listed in Table 3. This corresponds to an upper limit of 1.9 1014 cm-2 on the CH2DOH column density in clump 3, i.e. an upper limit on the fractional abundance of 1.5 10-9.
4.4.4 HDO
The HDO line at 241 GHz was searched for towards clump 3 but not detected, at a noise level of 47 mK (rms, Tmb scale), and a resolution of 0.3 km s-1. The associated upper limit for the integrated line intensity given in Table 3 corresponds to an upper limit of 4.4 1013 cm-2 for the HDO column density, i.e. an upper limit for the abundance of 3.410-10.
| clump 1 | clump 3 | |||||
| Molecule | N | x | XD/XH | N | x | XD/XH |
| (cm-2) | (cm-3) | (cm-2) | (cm-3) | |||
| H13CN | (3.10.4)1013 | 1.910-10 | (2.50.3)1013 | 1.910-10 | ||
| DCN | (1.40.3)1013 | 8.810-11 | 0.70.2 % | (1.90.3)1013 | 1.510-10 | 1.10.2 % |
| H13CO+ | (2.01.0)1013 | 1.310-10 | (1.60.2)1013 | 1.210-10 | ||
| DCO+ | 2.21011 | 1.410-12 | 210-4 | (6.91.1)1011 | 5.310-12 | (6.11.1) 10-4 |
| H213CO | – | – | – | (1.20.1)1013 | 9.210-11 | |
| HDCO | – | – | – | (4.80.8)1012 | 3.710-11 | 0.60.1 % |
| C2D | – | – | – | 2.51013 | 210-10 | – |
| HNC | – | – | – | 1.11013 | ||
| DNC | – | – | – | 1.51011 | 110-12 | 1.4 % |
| CH2DOH | 1.71014 | 1.110-9 | – | 1.91014 | 1.510-9 | – |
| HDO | – | – | – | 4.41013 | 3.410-10 | – |
5 Discussion
The main results of this study are the confirmation through multi-transition observations of the significant deuterium fractionation of HCN found by Leurini et al. (2006), as well as the detection of significant fractionation of HDCO in dense clumps in the Orion Bar PDR that are too warm for deuteration to be sustained by the H2D+ precursor. In the following, we consider the possible explanations for this high deuteration: products evaporated from ices surrounding dust grains, or gas-phase products. This study can also help understand the chemistry at work in PDRs.
5.1 Grain evaporation ?
One plausible origin for highly deuterated molecules is the evaporation of ices surrounding dust grains. Highly deuterated methanol, formaldehyde and water are observed in hot cores (e.g. Jacq et al., 1988; Comito et al., 2003) and hot corinos (Parise et al., 2002, 2004, 2005, 2006), and are thought to be remnants of the cold prestellar phase.
In particular methanol is believed to form primarily on dust grains, as the gas-phase production routes for this molecule are not efficient. The same may also be true for water, the main constituent of ices surrounding dust grains. Deuterated isotopologues of these molecules may thus trace surface chemistry processes that enhance the deuterium content of these species, because the accreting atomic D/H ratio is much higher than the elemental D/H ( 10-5). Atomic accretion on dust grains and surface reactions take place in cold environment, i.e. in conditions which are also favoring a large atomic D/H. Although it is not clear which thermal history the gas in the Orion Bar has undergone in the past (are the clumps remnants of high density clumps of the cold molecular cloud, which are still shielded from the PDR radiation?), it may be possible that we are witnessing in the clumps evaporation of ices that were formed during the cold molecular cloud phase. In this case, we would expect the composition of the ices to be comparable to the ones evaporated in hot corinos, i.e. with high CH2DOH/CH3OH ratios.
The temperature of the grains should follow closely the gas temperature (typically 50 K) in the clumps, due to the high density in the clumps (Kruegel & Walmsley, 1984). Although this temperature is high enough to sublimate CO ices (Tevap20 K), it is not high enough to sublimate polar ices dominated by H2O (Tevap100 K). Pure HCN ices are expected to sublimate in the ISM conditions at temperatures 65 K (extrapolation from the sublimation temperatures in comets from Prialnik, 2006). However, HCN is only a minor constituent of ices in objects where it was detected ( 3% of water in W33A, 0.25% of water in Hale Bopp, Ehrenfreund & Charnley, 2000). It will thus behave as small impurity in the water ice, and its sublimation will be dominated by the sublimation of H2O. It is thus rather unlikely that evaporation plays an important role in the warm clumps, except maybe on the clump surfaces.
The low relative abundance of methanol (210-9) compared to the abundance in hot corinos ( 10-7, Maret et al., 2005) may be a further sign that thermal evaporation is not the dominating chemical process, but rather that gas-phase chemistry is the most significant mechanism responsible for the enhanced deuteration levels. Note that grain chemistry models including non-thermal desorption of methanol are enough to explain these relatively low abundances of methanol (Garrod et al., 2007). Of course it is also possible that evaporated ices get photodissociated in the PDR, and this effect will be studied in more detail in a forthcoming paper (Parise et al. in prep). We focus here now on an alternative explanation, assuming that gas phase reactions are more predominant.
5.2 Gas-phase chemistry ?
The low temperature of the clumps with respect to the sublimation temperature of water ices points to the fact that thermal ice evaporation does not play a predominant role in the clumps. At the same time, the grain temperature (which, at these high densities, should follow the observed gas temperature) is too high for CO to stick efficiently on dust grains, preventing efficient grain chemistry to take place. The present chemistry is thus likely dominated by gas-phase processes, and the clumps may be in this sense remnants of the molecular cloud, which have been warmed up to temperatures higher than for typical molecular clouds, due to their location behind the photoionising front. The CH3OH abundance, in particular, is similar to that measured towards the TMC-1 dark cloud (310-9, Smith et al., 2004), and this molecule appears to be a remnant of grain chemistry happening during the colder era of the cloud, followed by non-thermal desorbing processes (Garrod et al., 2007). This possibility may be further tested by observing the D/H ratio in methanol. A formation of methanol during the cold molecular cloud phase is expected to lead to high CH2DOH/CH3OH ratios, as measured e.g. in prestellar cores (between 5% and 30% Bacmann et al., 2007). Unfortunately, the upper limit we derive here (CH2DOH/CH3OH 0.8) is not constraining enough, and further insight will require significantly deeper integrations, for which the sensitivity of ALMA will be needed.
For other molecules that can also form in the gas-phase, gas-phase processes are likely to be predominant. To test the hypothesis that gas-phase chemistry is the dominating process in the clumps, we compare in the remaining discussion the observed abundances and D/H ratios to the results of a pure steady-state gas-phase model. In particular, we are interested to see if high DCN/HCN ratio, low DCO+/HCO+ ratio and the detection of HDCO can be explained in the framework of a simple steady-state model.
5.3 Comparison to gas-phase model
We compare in the following the observed fractionation and relative abundances of molecules to the predictions of a pure gas-phase model, based on an updated version of the chemical model described by Roueff et al. (2007). The new model takes into account the new branching ratios of the N2H+ dissociative recombination (Molek et al., 2007), computes the pre-exponential factors of the reverse reactions involved in the deuterium fractionation of CH with the proper factors involved in the translational partition functions. In addition we have included the branching ratios of the electronic recombination of HCO+ from Amano (1990) where the channel towards CO is found to be predominant. The radiative association reactions of CH and deuterated substitues with H2 have been derived from the theoretical predictions of Bacchus-Montabonel et al. (2000) who display values at different temperatures.
The exothermicity of the CH + HD reaction and subsequent deuteration steps are not well constrained. These exothermicities were derived experimentally by Smith et al. (1982). However, theoretical assessments from zero-point energies lead to higher barriers. This has the effect to allow deuteration to remain efficient at even higher temperatures (up to 70 K). In the following, we will compare our observations to two models, calculated resp. by using the experimental values from Smith et al. (1982, saa model) and the exothermicities computed theoretically from zero-point energies (theo model). The respective exothermicities assumed in the models are listed in Tab. 8.
| Reaction | Exothermicity | Exothermicity |
|---|---|---|
| saa model | theo model | |
| 370 K | 670 K | |
| 369 K | 433 K | |
| 379 K | 443 K | |
| 713 K | 1005 K | |
| 319 K | 592 K | |
| 599 K | 564 K | |
| 317 K | 354 K | |
| 290 K | 151 K |
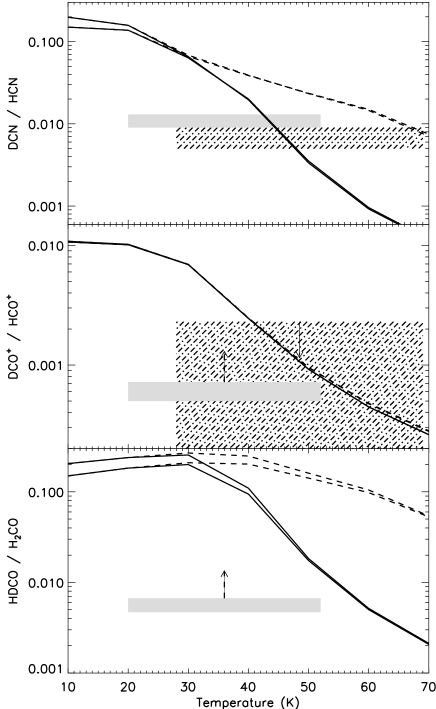
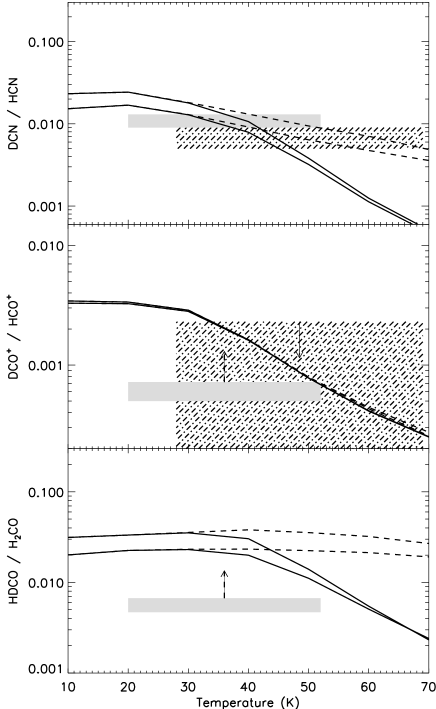
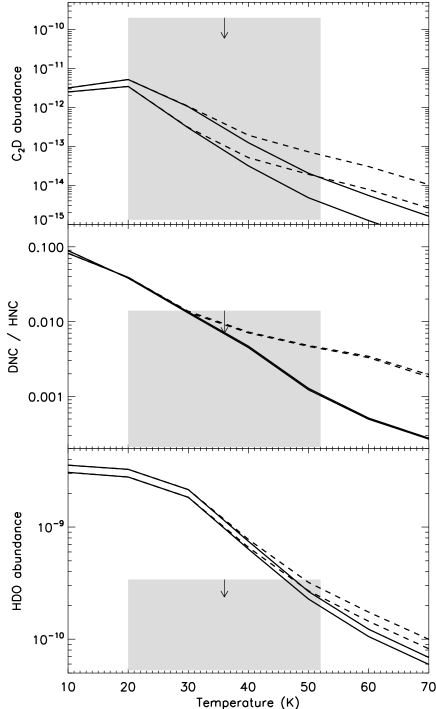
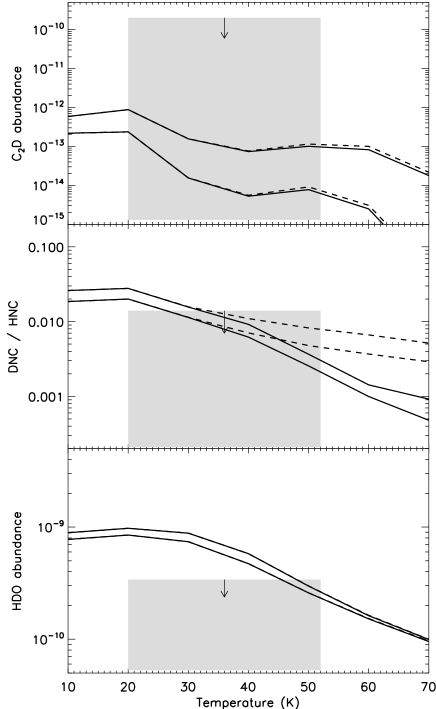
Figures LABEL:compare_obs_model_clump1 and 9 show the observed ratios towards clump 1 and 3 respectively, as well as the predicted ratios from the chemical models. The solid curves correspond to the saa model, and the dashed curves to the theo model. The two curves for each model correspond to the densities 3106 and 107 cm-3 (in order of increasing D/H ratio). The grey filling delimitates the observed values (1) or upper limits (3), and the temperature range (3) as derived from the CH3OH analysis. We computed the model predictions for the two different sets of elemental abundances used in Roueff et al. (2007). The “warm core” elemental abundances are representative of a mostly undepleted gas, while the “low metal” case, shown to lead to the best agreement to observations towards dense molecular clouds (Graedel et al., 1982), involves moderate depletions of C, N and O, and strong depletions of S and Fe.
The models all show a decreasing fractionation with increasing temperature. In the case of clump 1 (Figure LABEL:compare_obs_model_clump1), DCO+ was not detected, and thus we have only an upper limit for the observed DCO+/HCO+ ratio. The observed DCN/HCN ratio is consistent with the model prediction for a clump temperature of 45 K, for the saa model with low-metallicity elemental abundances. The theo model tends to overestimate the DCN/HCN ratio, requiring temperatures 70 K to reproduce the observed ratio, which are still consistent but rather at the high end of the uncertainty range of the temperature as determined from the methanol observations. Both models with warm core elemental abundances also qualitatively reproduce the DCN/HCN for a reasonable temperature range. The upper limit on the DCO+/HCO+ ratio is in the case of this clump not very constraining. Depending on the model, it points to T 33 K or T 40 K, which is consistent with the temperatures given by the DCN/HCN ratios.
In the case of clump 3 (Figure 9), both DCO+/HCO+ and HDCO/H2CO ratios have been observed. The derived fractionation ratios have been estimated assuming that the main isotopologue is only tracing the clump. However, there is some evidence that H2CO and HCO+ are also present in the interclump medium. The case for HCO+ was discussed in section 4.2, where we argued that we may have underestimated the DCO+/HCO+ ratio by up to a factor of three. H2CO has been shown to be roughly as abundant in the clumps as in the interclump gas (Leurini et al. submitted). They derive an H2CO column density of 61013 to 61014 cm-3 in the interclump gas, and of (2.8–5.4) 1014 cm-3 towards clump 1, which is up to a factor of three lower than our estimate from HCO towards clump 3. We may thus be overestimating the H2CO abundance in clump 3 by a factor of two to three. As a consequence, the ratios we have derived are in fact only to be considered as lower limits for the true ratios in the clumps (represented by the ascending arrows on Fig. 9). Note that this is not the case for the DCN/HCN ratio, because H13CN has been shown to trace only the clumps (Lis & Schilke, 2003). In the case of clump 3, the DCN/HCN ratio points to a temperature of 45 K (low-metal elemental abundances), or 20-50 K (warm core conditions). Both DCO+/HCO+ and HDCO/H2CO lower limits are in principle consistent with the model. However, in the case of the low-metal saa model, for a temperature of 45 K, agreement with the model would require that we increase the H2CO abundance in the clump by a factor of six, which seems not consistent with the study of Leurini et al. (submitted). For this clump, better qualitative agreement is found with the models with warm core elemental conditions. It is also instructive to see if the upper limits on other deuterated molecules (C2D, DNC, HDO) are consistent with the models (Figure 10). In the case of HDO and C2D, where we have no observations of the main isotopologue, we compare the abundances directly with the model predictions. C2D upper limits are not constraining —a two orders of magnitude increase in the sensitivity would be required to add interesting constraints. The DNC/HNC upper limits point to T 30 K. But the most constraining molecule is certainly HDO, which non-detection is consistent with the models only for T 40-50 K. The fact that the HDO abundance seems to be consistent and even rather on the lower side of the model predictions is certainly a good hint that thermal evaporation is not playing a dominant role in injecting water molecules into the gas-phase.
As a conclusion from this comparison, we find a good qualitative agreement between the observations and pure steady-state gas-phase models. Although such a comparison is obviously limited, because the physical structure (temperature and density gradient) of the clump is not taken into account, and because the chemistry is only computed at steady-state, it shows that the scenario of warm gas phase deuterium chemistry is viable for explaining the high deuteration ratios observed in DCN towards the Orion Bar clumps.
The comparison with the models is unfortunately limited by our poor handle on the clump temperature. Good probes of the temperature are usually the inversion lines of the NH3 molecule. NH3 was mapped in the Orion Bar by Batrla & Wilson (2003) with single-dish. Although they find that the NH3 emission comes mostly from the same regions as the HCN emission, they find high kinetic temperatures (T 100 K) and argue that ammonia is located in the surface layers of the clumps, where icy mantle around dust grains evaporate. The traced temperature is thus rather typical of that of the interclump gas, and NH3 is therefore not a good probe of the clump temperature. Deeper observations of several lines of CH3OH, including high-J transitions might allow to constrain the temperature better.
On the model side, a more detail treatment taking into account photodissociation in the PDR is the next step to take.
 |
 |
 |
 |
6 Conclusions
We have presented observations of deuterated molecules towards two dense clumps in the Orion Bar photodissociation region. These observations were aimed at confirming and understanding the origin of the DCN emission first detected in this region by Leurini et al. (2006). We confirmed through the observation of four transitions of DCN the detection of this molecule towards one clump, and detected it towards a second clump of the Orion Bar. We also detected DCO+ and HDCO towards this second clump, and provided upper limits for the abundance of other relevant deuterated molecules. From the observation of these several species, formed by chemistry induced either by H2D+ or CH2D+, we find evidence based on a pure gas-phase chemistry model that the main ion responsible for deuteron transfer in the Orion Bar is CH2D+, as opposed to previously observed cases of colder regions or hot cores where H2D+ was the main actor (in the case of hot cores, deuterium fractionation is believed to be a fossil of cold chemistry in the earlier cold evolutionary phase, preserved into ice mantles). The luke-warm conditions in the Orion Bar clumps thus allowed us to observationally test chemical models in a different temperature range than most previous studies dealing with deuterium fractionation. More refined understanding of the chemistry at work in the Orion Bar will require more detailed chemical modelling, coupling PDR models with gas-grain chemical networks.
Acknowledgements.
We are very grateful to the APEX staff, in particular P. Bergman and A. Lundgren, for performing part of the APEX observations presented here. B.P. thanks M. Wernli for providing the HCN-He collision rates before publication, and for enlightening discussions. B.P. acknowledges fruitful discussions with A.G.G.M. Tielens and R. Garrod, and enlightening comments on statistics from Edward Polehampton and Didier Pelat. This work was funded by a Alexander von Humboldt research fellowship and by a Deutsche Forschungsgemeinschaft Emmy Noether project. D.C. Lis is supported by the U.S. National Science Foundation, award AST-0540882 to the Caltech Submillimeter Observatory.References
- Amano (1990) Amano, T. 1990, J. Ch. Ph., 92, 6492
- Asvany et al. (2004) Asvany, O., Schlemmer, S., & Gerlich, D. 2004, ApJ, 617, 685
- Bacchus-Montabonel et al. (2000) Bacchus-Montabonel, M., Talbi, D., & Persico, M. 2000, J. Phys. B, 33, 955
- Bacmann et al. (2007) Bacmann, A., Lefloch, B., Parise, B., Ceccarelli, C., & Steinacker, J. 2007, in Molecules in Space and Laboratory
- Batrla & Wilson (2003) Batrla, W. & Wilson, T. L. 2003, A&A, 408, 231
- Caselli et al. (2003) Caselli, P., van der Tak, F. F. S., Ceccarelli, C., & Bacmann, A. 2003, A&A, 403, L37
- Caselli et al. (2008) Caselli, P., Vastel, C., Ceccarelli, C., et al. 2008, A&A, 492, 703
- Comito et al. (2003) Comito, C., Schilke, P., Gérin, M., et al. 2003, A&A, 402, 635
- Ehrenfreund & Charnley (2000) Ehrenfreund, P. & Charnley, S. B. 2000, ARA&A, 38, 427
- Flower et al. (2004) Flower, D. R., Pineau des Forêts, G., & Walmsley, C. M. 2004, A&A, 427, 887
- Garrod et al. (2007) Garrod, R. T., Wakelam, V., & Herbst, E. 2007, A&A, 467, 1103
- Gerlich et al. (2002) Gerlich, D., Herbst, E., & Roueff, E. 2002, Planet. Space Sci., 50, 1275
- Graedel et al. (1982) Graedel, T. E., Langer, W. D., & Frerking, M. A. 1982, ApJS, 48, 321
- Güsten et al. (2006) Güsten, R., Nyman, L. Å., Schilke, P., et al. 2006, A&A, 454, L13
- Hatchell et al. (1998) Hatchell, J., Millar, T. J., & Rodgers, S. D. 1998, A&A, 332, 695
- Herbst et al. (1987) Herbst, E., Adams, N. G., Smith, D., & Defrees, D. J. 1987, ApJ, 312, 351
- Hogerheijde et al. (1995) Hogerheijde, M. R., Jansen, D. J., & van Dishoeck, E. F. 1995, A&A, 294, 792
- Huntress (1977) Huntress, W. T. 1977, ApJS, 33, 495
- Jacq et al. (1988) Jacq, T., Henkel, C., Walmsley, C. M., Jewell, P. R., & Baudry, A. 1988, A&A, 199, L5
- Jansen et al. (1995) Jansen, D. J., Spaans, M., Hogerheijde, M. R., & van Dishoeck, E. F. 1995, A&A, 303, 541
- Klein et al. (2006) Klein, B., Philipp, S. D., Krämer, I., et al. 2006, A&A, 454, L29
- Kruegel & Walmsley (1984) Kruegel, E. & Walmsley, C. M. 1984, A&A, 130, 5
- Leurini et al. (2009) Leurini, S., Parise, B., Schilke, P., Pety, J., & Rolffs, R. 2009, A&A, subm.
- Leurini et al. (2006) Leurini, S., Rolffs, R., Thorwirth, S., et al. 2006, A&A, 454, L47
- Leurini et al. (2004) Leurini, S., Schilke, P., Menten, K. M., et al. 2004, A&A, 422, 573
- Leurini et al. (2007) Leurini, S., Schilke, P., Wyrowski, F., & Menten, K. M. 2007, A&A, 466, 215
- Linsky (2003) Linsky, J. L. 2003, Space Science Reviews, 106, 49
- Lique et al. (2008) Lique, F., Toboła, R., Kłos, J., et al. 2008, A&A, 478, 567
- Lis et al. (2002) Lis, D. C., Roueff, E., G rin, M., et al. 2002, ApJ, 571, L55
- Lis & Schilke (2003) Lis, D. C. & Schilke, P. 2003, ApJ, 597, L145
- Müller et al. (2001) Müller, H. S. P., Thorwirth, S., Roth, D. A., & Winnewisser, G. 2001, A&A, 370, L49
- Maret et al. (2005) Maret, S., Ceccarelli, C., Tielens, A. G. G. M., et al. 2005, A&A, 442, 527
- Maret et al. (2009) Maret, S., Faure, A., Scifoni, E., & Wiesenfeld, L. 2009, ArXiv e-prints
- Menten et al. (2007) Menten, K. M., Reid, M. J., Forbrich, J., & Brunthaler, A. 2007, A&A, 474, 515
- Molek et al. (2007) Molek, C., McLain, J., Poterya, V., & Adams, N. G. 2007, J. Phys. Chem. A, 111, 6760
- Müller et al. (2005) Müller, H. S. P., Schlöder, F., Stutzki, J., et al. 2005, in IAU Symposium, ed. D. C. Lis, G. A. Blake, & E. Herbst, 30–+
- Ossenkopf & Henning (1994) Ossenkopf, V. & Henning, T. 1994, A&A, 291, 943
- Pagani et al. (2009) Pagani, L., Vastel, C., Hugo, E., et al. 2009, A&A, 494, 623
- Parise et al. (2004) Parise, B., Castets, A., Herbst, E., et al. 2004, A&A, 416, 159
- Parise et al. (2005) Parise, B., Caux, E., Castets, A., et al. 2005, A&A, 431, 547
- Parise et al. (2006) Parise, B., Ceccarelli, C., Tielens, A. G. G. M., et al. 2006, A&A, 453, 949
- Parise et al. (2002) Parise, B., Ceccarelli, C., Tielens, A. G. G. M., et al. 2002, A&A, 393, L49
- Pety et al. (2007) Pety, J., Goicoechea, J. R., Hily-Blant, P., Gerin, M., & Teyssier, D. 2007, A&A, 464, L41
- Phillips et al. (1996) Phillips, T. R., Maluendes, S., & Green, S. 1996, ApJS, 107, 467
- Pottage et al. (2002) Pottage, J. T., Flower, D. R., & Davis, S. L. 2002, Journal of Physics B Atomic Molecular Physics, 35, 2541
- Pottage et al. (2004) Pottage, J. T., Flower, D. R., & Davis, S. L. 2004, Journal of Physics B Atomic Molecular Physics, 37, 165
- Prialnik (2006) Prialnik, D. 2006, in IAU Symposium, Vol. 229, Asteroids, Comets, Meteors, ed. L. Daniela, M. Sylvio Ferraz, & F. J. Angel, 153–170
- Risacher et al. (2006) Risacher, C., Vassilev, V., Monje, R., et al. 2006, A&A, 454, L17
- Roberts et al. (2003) Roberts, H., Herbst, E., & Millar, T. J. 2003, ApJ, 591, L41
- Roueff et al. (2007) Roueff, E., Parise, B., & Herbst, E. 2007, A&A, 464, 245
- Schilke et al. (2001) Schilke, P., Pineau des Forêts, G., Walmsley, C. M., & Martín-Pintado, J. 2001, A&A, 372, 291
- Schilke et al. (1992) Schilke, P., Walmsley, C. M., Pineau des Forêts, G., et al. 1992, A&A, 256, 595
- Smith et al. (1982) Smith, D., Adams, N. G., & Alge, E. 1982, J. Chem. Phys., 77, 1261
- Smith et al. (2004) Smith, I. W. M., Herbst, E., & Chang, Q. 2004, MNRAS, 350, 323
- Turner (2001) Turner, B. E. 2001, ApJS, 136, 579
- van der Tak et al. (2002) van der Tak, F. F. S., Schilke, P., Müller, H. S. P., et al. 2002, A&A, 388, L53
- Walmsley et al. (2004) Walmsley, C. M., Flower, D. R., & Pineau des Forêts, G. 2004, A&A, 418, 1035
- Wernli & Faure (2009) Wernli, M. & Faure, A. 2009, MNRAS, in prep
- Wernli et al. (2006) Wernli, M., Valiron, P., Faure, A., et al. 2006, A&A, 446, 367
- Wernli et al. (2007) Wernli, M., Wiesenfeld, L., Faure, A., & Valiron, P. 2007, A&A, 464, 1147
- Wilson (1999) Wilson, T. L. 1999, Reports of Progress in Physics, 62, 143
- Xu & Lovas (1997) Xu, L.-H. & Lovas, F. L. 1997, Journal of Physical and Chemical Reference Data, 26, 17
- Young Owl et al. (2000) Young Owl, R. C., Meixner, M. M., Wolfire, M., Tielens, A. G. G. M., & Tauber, J. 2000, ApJ, 540, 886