Contact and Friction of Nano-Asperities: Effects of Adsorbed Monolayers
Abstract
Molecular dynamics simulations are used to study contact between a rigid, nonadhesive, spherical tip with radius of order nm and a flat elastic substrate covered with a fluid monolayer of adsorbed chain molecules. Previous studies of bare surfaces showed that the atomic scale deviations from a sphere that are present on any tip constructed from discrete atoms lead to significant deviations from continuum theory and dramatic variability in friction forces. Introducing an adsorbed monolayer leads to larger deviations from continuum theory, but decreases the variations between tips with different atomic structure. Although the film is fluid, it remains in the contact and behaves qualitatively like a thin elastic coating except for certain tips at high loads. Measures of the contact area based on the moments or outer limits of the pressure distribution and on counting contacting atoms are compared. The number of tip atoms making contact in a time interval grows as a power of the interval when the film is present and logarithmically with the interval for bare surfaces. Friction is measured by displacing the tip at a constant velocity or pulling the tip with a spring. Both static and kinetic friction rise linearly with load at small loads. Transitions in the state of the film lead to nonlinear behavior at large loads. The friction is less clearly correlated with contact area than load.
pacs:
46.55.+d, 62.20.Qp, 81.40.PqI Introduction
Studies of the contact between a spherical tip and a flat substrate have played a central role in models of the mechanical and frictional response of surfaces. In continuum mechanics, this geometry can be mapped into contact between two peaks or asperities on opposing rough surfaces as they are pressed together Johnson (1985). The response of the entire system is then commonly represented as a sum over many independent contacts Greenwood and Williamson (1966); Johnson (1985); Bowden and Tabor (1986), although recent studies emphasize the importance of interactions between asperities Persson (2001); Hyun et al. (2004); Campañá et al. (2008); Persson (2008).
Ideal single asperity contacts are difficult to realize in experiments because both the tip and substrate are usually rough on scales smaller than the average radius of curvature. As a result, most experiments with micrometer and larger tips end up measuring the response of many smaller asperities. Notable exceptions are experiments on atomically flat mica surfaces in the Surface Force Apparatus Gee et al. (1990); Granick (1991); Klein and Kumacheva (1995). The main limitation of these experiments is that the contact pressure is typically only tens of megapascals, which is orders of magnitude smaller than estimates of the pressure between asperities on rough surfaces.
In the last twenty years there has been great interest in the study of single asperities at the nanometer scale using the atomic force microscope (AFM) and related scanning probes Carpick and Salmeron (1997); Kiely and Houston (1998); Bhushan (2004). When the AFM is operated in a typical contact mode, a tip with characteristic radius of to nm is pressed into contact with a surface and may be translated to measure the friction. The small dimensions of the tip allow more direct control and/or measurement of the chemistry and geometry, and reduce the range of roughness that can exist on the surfaces.
AFM experiments provide direct information about the normal and lateral forces, but do not reveal the distribution of forces within the contact, the area of contact, or the mechanisms of deformation and friction. This prevents them from directly answering long standing questions about the role of area and load in determining friction. At the macroscopic scale, Amontons’s laws of friction say that the friction is proportional to load and independent of the area of contact. However a prevailing view since the mid 1900’s has been that the friction is proportional to the real area of molecular contact , which is much smaller than the nominal or apparent area Bowden and Tabor (1986); Johnson (1985); Greenwood and Williamson (1966). The real area typically grows linearly with load for nonadhesive surfaces, and Amontons’s laws are recovered if there is a constant shear stress in the contact. For adhesive surfaces, remains finite at zero load, explaining why friction is often finite at zero load.
To try to address the role of at the nanometer scale, AFM experiments have been compared to continuum models. The measured friction can be fit by assuming both that continuum theory describes in nanometer scale contacts and that there is a constant Carpick and Salmeron (1997); Carpick et al. (1999); Schwarz (2003). However, the success of such fits need not imply that the underlying assumptions are valid, because the functional dependence is quite simple and there are many poorly constrained fit parameters. This has been demonstrated in subsequent simulations where the friction can be fit in the same way, but both assumptions break down Luan and Robbins (2005, 2006); Mo et al. (2009). The major cause of the discrepancy with continuum theory is the atomic scale roughness that is present on any surface composed of discrete atoms. This spreads the contact over a larger area, much as predicted by continuum calculations for rough surfaces Johnson (1985); Greenwood and Tripp (1967).
These simulations of single asperity contacts between clean surfaces have found a variety of relations between , load and friction. The friction changes by more than two orders of magnitude with the precise atomic structure of the tip Luan and Robbins (2005), and may scale linearly with area, load or neither Luan and Robbins (2005, 2006); Mo et al. (2009). Similar strong dependence on atomic structure is found for the friction between flat surfaces, with friction expected to vanish with increasing area unless the surfaces are commensurate, i.e., share a common period Hirano and Shinjo (1990); Müser (2001); Müser et al. (2001); Hirano (2006); Dienwiebel et al. (2004); Dietzel et al. (2008); Martin et al. (1993).
Of course experimental surfaces are rarely clean. Any surface exposed to air is rapidly coated with adsorbed molecules of water, oxygen or small hydrocarbons. Wear debris, dust and larger particles may also be present. These “third bodies” can have a profound effect on friction. Studies of flat surfaces show that they greatly reduce the sensitivity of friction to atomic structure and produce a friction force that rises linearly with normal load He et al. (1999); He and Robbins (2001a, b); Müser et al. (2001).
In this paper we consider the effect of adsorbed monolayers on the mechanical properties and friction of single asperity contacts. Even though the adsorbed molecules freely diffuse along the surface, they are trapped in a glassy state when confined under the tip and remain in the contact at very high loads. As for flat surfaces, the adsorbed monolayer decreases the variation of friction with atomic structure and yields a force that usually rises linearly with normal load. The adsorbed monolayer also decreases variations with tip structure in the contact area and normal stiffness, but leads to large deviations from the results for bare tips. The observed increase in contact area and decrease in stiffness relative to continuum theory are qualitatively consistent with modeling the adsorbed monolayer as a thin elastic coating.
The paper is organized as follows. Sec. II describes the interactions, geometry and methods used in our simulations. The MD results for the pressure distribution, contact radius, tip displacement, and friction forces are presented in Sec. III. Sec. IV provides a brief summary and discussion of the results.
II Simulation Methods
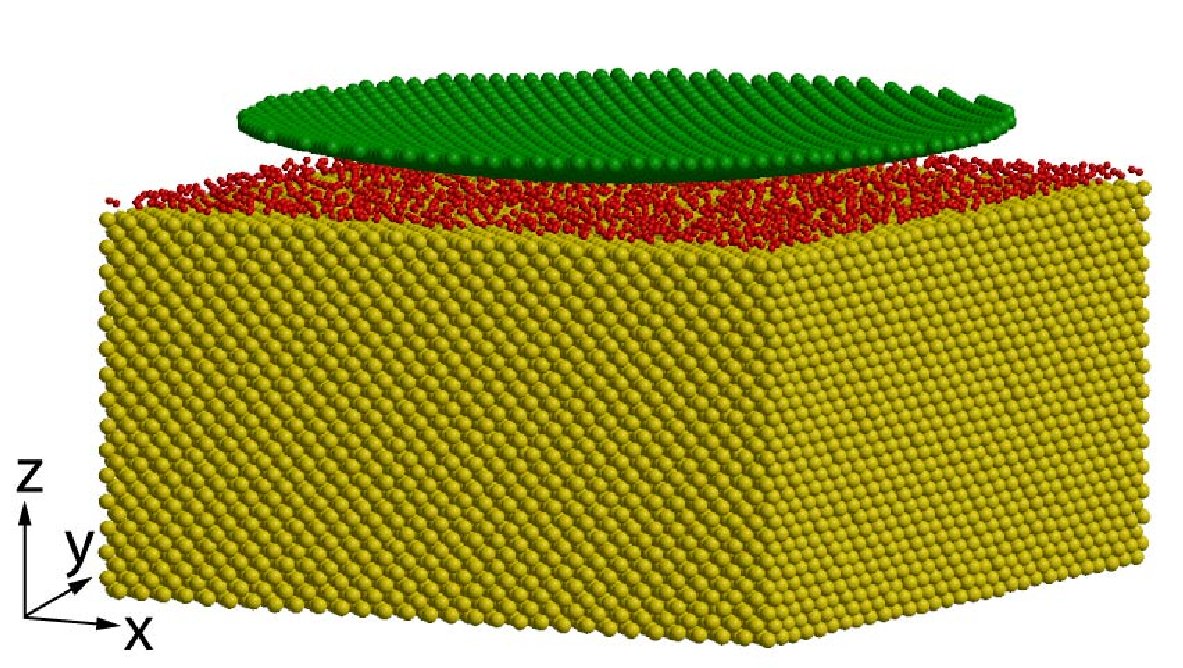
Figure 1 shows a snapshot of the system studied in our MD simulations. A spherical tip is pushed, under a controlled normal load, into a flat substrate covered with an adsorbed fluid layer. The picture only shows a small region near the center of contact (about in the plane of the substrate surface and in the substrate depth). The tip radius is , which is comparable to radii of tips used in AFM experiments. The geometry also approximates contact of peaks on randomly rough surfaces.
In continuum mechanics a contact between two elastic, frictionless spheres, with radii and , Young’s moduli and , and Poisson ratios and respectively, can be mapped to a contact between a rigid sphere of radius and a flat elastic solid of modulus given by Johnson (1985)
| (1) |
Previous studies have shown that the mapping remains essentially correct at atomic scales Luan and Robbins (2005). Thus simulations can be simplified to the case of a rigid tip and an elastic substrate without loss of generality.
To approximate a perfectly elastic material, we take a face-centered-cubic (fcc) crystal as the substrate with a (001) surface exposed. Atoms on nearest-neighbor sites in the substrate are connected by a harmonic potential
| (2) |
where is a spring constant, is the equilibrium distance between two nearest neighbors, and is the inter-atomic distance. To be consistent with our previous work, we express and in terms of the values for particles interacting with a Lennard-Jones (LJ) potential. The truncated and shifted LJ potential is
| (3) |
for , where and are the characteristic binding energy and diameter, and is the cutoff distance. If atoms in the solid interacted with this potential and the cutoff only included nearest-neighbors, then one would have and approximately . We use these values for the spring interaction described in Eq. (2) and express all quantities in terms of , and the mass of solid atoms . For example, the unit of time is . The relation between the effective modulus in Eq. (1) and the elastic constants is complicated when the solid is cubic rather than isotropic Johnson (1985). The value was obtained from fits to simulation results for the normal displacement in contacts between a bare fcc crystal and a dense tip where continuum theory is most accurate Luan and Robbins (2006).
Periodic boundary conditions are imposed in the and directions, i.e., in the substrate surface plane. The bottom layer of substrate atoms is held fixed. This mimics the external support that balances the normal load applied to the tip. Continuum solutions assume a semi-infinite substrate. To approximate this, all dimensions of the substrate should be much bigger than the contact radius. The size of the substrate used in this paper is about , which corresponds to a total of more than million atoms. The contact radius in our MD simulations, as measured by the second moment of the pressure distribution, is less than of the substrate dimensions. The quantity most affected by finite substrate size is the normal displacement. The magnitude of the corrections to the Hertz prediction has been obtained by fitting continuum calculations Johnson and Sridhar (2001); Sridhar et al. (2004); Sergici et al. (2006) to simulations for bare contacts Luan and Robbins (2006). The corrections are less than and have been included in the Hertz prediction lines for normal displacement below.
We perform a series of simulations using tips with different atomic scale structures and roughness, but with the same radius (). The smoothest tips are made by bending the (001) surface of an fcc crystal with nearest-neighbor spacing into a spherical shape. The friction between bare surfaces depends on whether is rational or irrational. These cases are referred to as commensurate and incommensurate, respectively. The highest friction occurs for commensurate surfaces with the same lattice constant and orientation, i.e., . In this commensurate case, we find that the relative position of the tip on the substrate surface plays an important role. Two extreme cases are investigated here. When tip atoms are directly above interstitial positions on the substrate surface, we say the tip is in registry since it represents a continuation of the crystalline structure of the substrate. On the other hand, when tip atoms are directly above atomic equilibrium positions on the substrate surface, we say the tip is out of registry.
Contacting experimental surfaces are rarely in perfect registry and alignment. Any mismatch between lattice constants ( and ) or misalignment between lattice orientations leads to incommensurate contact. To model such cases, we make an incommensurate tip by bending a fcc crystal with . To most closely approximate a continuum, we also consider a dense tip made by bending a (001) face of a fcc crystal with or . The two give nearly identical results for contact area and normal displacements. Frictional forces are small for dense tips and are not reported because such disparate lattice constants on opposing surfaces are hard to realize with real atoms.
The tips used in AFM experiments are unlikely to have the geometry of bent crystals. To generate more realistic tip geometries we take a crystalline or amorphous material and remove all atoms outside a sphere of radius . The crystalline state is chosen to be commensurate with . The amorphous state is obtained by quenching a fluid state with number density . While all tips considered here deviate from an ideal sphere by less than an atomic diameter, the effective roughness is quite different. The cut crystal has terraced steps on the surface and will be referred to as the “stepped” tip in this paper. The amorphous surface does not have terraces, but has fluctuations in height and density (see Fig. 1 of Ref. Luan and Robbins (2006)).
As for the bent commensurate tip, results for the stepped tip depend on registry. For most of the results presented in this paper the stepped tip is out-of-registry, with the atoms in the bottom terrace directly above the equilibrium positions of surface substrate atoms. Another case was considered in simulations of friction, because sliding along the axis brings commensurate tips between the in and out of registry configurations. The tip was shifted diagonally by along both and . Tip atoms then slide along a line that is centered between substrate atoms. This did not change static contact properties significantly, but lowered the friction by a factor of .
Atoms in the tip () and substrate () interact via the LJ potential described in Eq. (3) with , , and . The choice of makes the interaction purely repulsive. Therefore no adhesion is included. Possible effects of adhesion will be explored in future studies. Except as noted, the adsorbed film prevents direct contact between the tip and substrate.
The adsorbed monolayer is composed of chain molecules containing four atoms. Here “atom” is used in a designative sense and each atom may represent a monomer of an oligomer chain. Atoms () that are not connected by a covalent bond interact via the LJ potential with , , and . Reducing the binding energy by a factor of relative to the substrate ensures that the molecules melt at a lower temperature. For adjacent atoms in an adsorbed molecule, the LJ potential is truncated at , and the covalent bond is modeled by the finite extensible nonlinear elastic (FENE) potential Kremer and Grest (1990)
| (4) |
Here is a spring constant and is a length scale. Previous studies have shown that this coarse-grained model provides a good description of short-chain hydrocarbon molecules Kremer and Grest (1990), and it has been used successfully to model a wide range of equilibrium and nonequilibrium behavior Rottler et al. (2002); Rottler and Robbins (2002); Hoy and Robbins (2007).
The monolayer is confined onto the substrate by an LJ potential with , , and . The stronger binding energy gives perfect wetting and, combined with the chain length, leads to a very low vapor pressure. All simulations are performed with the substrate and adsorbate atoms kept at a constant temperature . This is lower than the melting point () of a LJ solid whose interactions are comparable to those in the substrate. However, since is only , the temperature is higher than the glass transition temperature () in bulk systems Baljon and Robbins (1996); Rottler and Robbins (2001). The large reduces the periodic potential from the substrate that might lock the adsorbed film in an epitaxial state Thompson and Robbins (1990). As a result, the adsorbed film is in a fluid state with a high mobility along the substrate surface.
The adsorbates also interact with the tip () through the LJ potential. The corresponding parameters are , , and . These parameters ensure that the adsorbed film does not wet the tip. Thus the formation of a meniscus is avoided.
The simulations are performed using the Large-scale AtomicMolecular Massively Parallel Simulator (LAMMPS) developed at Sandia National Laboratories. This classical MD code utilizes spatial decomposition to parallelize the computations. Forces are calculated with the help of neighbor lists. A velocity-Verlet algorithm with a time step is used to integrate the equations of motion. Tests with to give essentially the same results. To fix the temperature of substrate and adsorbate atoms, a Langevin thermostat is applied by adding a drag term to their equations of motion. The Langevin damping rate is typically . To check that the thermostat did not affect the results, we also ran simulations with and damping only on directions perpendicular to the sliding velocity in friction measurements. No noticeable change was found.
Although nearest-neighbors in the substrate interact with ideal springs, changes in orientation of the springs lead to a slight anharmonicity. Instead of expanding with increasing , the equilibrium lattice constant of the substrate shrinks by about as rises from to . The periodic boundary conditions prevent contraction in the plane, leading to a small negative pressure () in this plane. The height of the substrate shrinks about to relieve the tension along the direction. To check that this slight anisotropy did not affect our results, we also ran simulations in which the solid substrate was allowed to relax to a fully equilibrated state with a zero inner pressure before the contact occurs. No change was noticed for the results presented in this paper.
A layer of adsorbate molecules is put on top of the substrate and the system is allowed to relax into an equilibrium state at . In Fig. 2 we plot the atomic number density of adsorbates as a function of distance above the mean height of atoms in the top layer of the substrate. The film is close to an ideal monolayer with a single major peak at about . The adsorbate distribution has a long but weak tail at large and a small density peak corresponding to a second layer at . Only of the atoms are outside the first layer and virtually no evaporation is observed. However, the tail in density makes it difficult to define the separation between the tip and monolayer covered substrate. We will use the minimum in density at as a reference height corresponding to the top of the fluid layer.

After the adsorbed film and the substrate are fully relaxed, a tip is brought into proximity. The normal load on the tip is controlled and increased by small steps. When the contact reaches a steady state at a given load, the responses of the adsorbate and substrate are measured. The local pressure is determined by finding all atoms on the tip or substrate that have a nonzero interaction with the monolayer or opposing surface. The normal component of the force on the atom is then divided by the area per atom to yield a pressure. We also measure the density distribution of the adsorbates, the contact area, the tip displacement, and the substrate deformation. Friction is measured by displacing the tip and monitoring the lateral force. The tip is moved at a constant velocity or attached to a constant velocity stage with a spring of stiffness . The spring only affects the displacement along the pulling direction and no motion is allowed along the perpendicular direction.
III Results of Molecular Dynamics Measurements
The following subsections compare our simulation results to continuum solutions for the geometry studied in this paper, a sphere of radius pushed by a normal load into a flat elastic substrate. Hertz theory for non-adhesive contacts predicts that the region of contact is a circle whose radius is Johnson (1985)
| (5) |
The contact area is and is thus proportional to . The pressure in the contact region takes the form
| (6) |
where is the distance from the center of the contact circle. Hertz theory also predicts that the normal displacement after initial contact is given by
| (7) |
Combining with Eq. 5 this implies that increases as .
III.1 Distributions of Pressure and Adsorbed Molecules
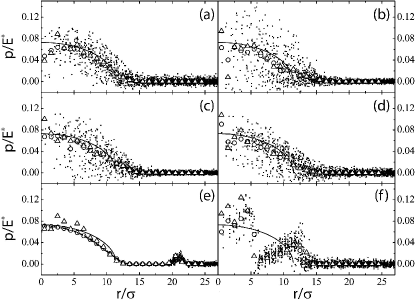
In Fig. 3 the normal pressure on the substrate surface is plotted as a function of radial distance from the center of the contact zone under a normal load . The Hertz prediction using the bulk modulus of the substrate is plotted as a solid line and is the same for all tips. Small dots represent the raw data on every substrate atom and circles are the average over substrate atoms in an annular region from to . Open triangles represent the angle-averaged normal pressure on the tip surface. The forces on the substrate and tip must balance and from Saint-Venant’s principal Love (1944) they are only expected to be redistributed by a distance of order the film thickness. The plots show that the two pressure distributions are very similar. The only pronounced deviations are near the center where fewer atoms contribute to the average. For example, only four atoms on the substrate surface are located within . As a result, the pressure distribution is more sensitive to the specific atomic arrangements at small radii and shows stronger fluctuations.
The raw pressure data exhibits very strong variations with angle. These variations persist even after long averaging times, but are different for different initial conditions. Direct observation of the dynamics of the adsorbed molecules shows that those in the center of the contact region () are frozen in a glassy state. They undergo thermal oscillations that are too small to sample different pressure distributions in the contact and very slow aging that is discussed further below. Similar glass transitions have been observed in a wide range of experiments Gee et al. (1990); Granick (1991); Klein and Kumacheva (1995) and simulations Thompson et al. (1992); Gao et al. (1997); Cui et al. (2003) on confined films. The fluid outside the contact remains in a mobile fluid state and the dynamics slows down dramatically at the outer edge of the contact.
Previous studies of dry contacts with the same tips showed large changes in the distribution of contact pressure with tip geometry. Fig. 3 shows that tip geometry is less important when adsorbed molecules are introduced. Tips with very distinct surface configurations lead to very similar pressure distributions (Figs. 3a-d). Structural effects are only evident for a bent commensurate tip that is in registry with the substrate surface (Fig. 3e) and a tip cut from a crystalline solid (Fig. 3f). Moreover, these structural effects only become significant at high loads. When , all tips show similar .
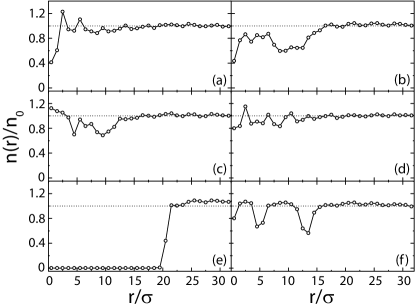
To examine how the pressure in the contact affects the adsorbed film, the adsorbate surface density is plotted in Fig. 4. As in Fig. 3, four of the tips have very similar density distributions (Fig. 4a-d) even though their different atomic structure led to very different behavior of bare tips Luan and Robbins (2005, 2006). The density in the contact is reduced slightly and shows fluctuations that do not average out with time because the film is in a glassy state. The density decrease is slightly larger for the amorphous tip, perhaps because the greater surface roughness enhances mobility.
Figure 4f shows two dips in that correspond to the edges of terraces on the stepped tip. In continuum theory these edges produce a stress singularity, and substantial pressure rises are observed for bare tips. The adsorbed film smooths these peaks at terrace edges into broad features in the pressure plot of Fig. 3f. Note that the sequence of terrace sizes is not uniquely determined by the tip radius and this would lead to variations in the location of these features Luan and Robbins (2006).
Figure 4e shows that the pressure from the commensurate tip in registry expels all adsorbed molecules from the central region. The tip atoms interact directly with the substrate, leading to a smooth pressure peak in the center of the contact (Fig. 3e) that is similar to that for a bare surface Luan and Robbins (2006). A second pressure peak appears near where the tip contacts the edge of the adsorbed film. For the in-registry tip, atoms from one surface are above gaps in the opposing surface. The space available to adsorbed molecules is fairly constant and the barriers to lateral motion are small. For the out-of-registry case, opposing solid atoms are directly above each other and adsorbed molecules can be trapped in pronounced channels between atoms. We found no expulsion of molecules for the out of registry tip even at the highest loads. In-registry tips expelled the film for and there was relatively little dependence on the rate of loading because the film was in a glassy state where thermal activation was negligible compared to mechanical activation.
All pressure distributions in Fig. 3 exhibit a long tail that extends beyond the contact region predicted by Hertz theory. Two factors contribute to this. The first is that the adsorbed film is compliant and thus can conform to the tip, allowing the pressure at the edge of the contact zone to drop to zero more smoothly than in the Hertz model. Note that the relatively small density drop for most tips indicates that this happens mostly through compressing the layer rather than displacing atoms. The second factor is thermal fluctuations in the substrate and adsorbed film. These are normally neglected in contact theories and are discussed in the next subsection.
III.2 Measuring Contact Area
There has been great interest in the relation of single-asperity contact area to load and friction Carpick and Salmeron (1997); Luan et al. (2006); Luan and Robbins (2006); Mo et al. (2009); Knippenberg et al. (2008); Luan and Robbins (2009); Gao et al. (2004). Fig. 3 shows that pressure is distributed over a larger area than the Hertz prediction. However, the meaning of contact is somewhat ambiguous at the atomic scale. Here we will consider three different definitions of contact radius and area. If we define the contact radius as the distance from the contact center at which the pressure on the tip surface vanishes (or drops below some threshold), then Fig. 3 indicates that a value bigger than the Hertz prediction will be obtained. We will call the contact radius associated with the edge of the pressure distribution the outer radius . It is obtained from a linear fit to the tail of on the tip surface. Systematic uncertainties are of order .
The outer radius is sensitive to the periphery of the contact where pressures are small. It is also interesting to consider a measure that is most sensitive to high pressure regions, such as the second moment of the pressure. If the pressure distribution in the contact zone follows the Hertz prediction (Eq. 6), then the contact radius satisfies
| (8) |
The right hand side of Eq. 8 is readily calculated for the actual pressure distributions in our contacts. This gives another measure of the contact radius that we will refer to as , where “s” stands for second moment. Greenwood and Tripp Greenwood and Tripp (1967) considered a similar measure in a study of the effect of roughness on the contact between a sphere and a flat surface using the assumption that asperities could be treated independently. Their radius corresponded to the ratio of the integral of the pressure divided by the integral of . This measure is not plotted below because it is less common than the second moment and the fluctuations shown in Fig. 3 make more sensitive to noise than . However shows the same trends as and the deviations are comparable to the numerical fluctuations.
Several groups have attempted to determine the contact area and the corresponding contact radius by counting the number of atoms on one surface that are within some cutoff distance of the opposing surface Luan et al. (2006); Mo et al. (2009); Knippenberg et al. (2008). However, this definition is very sensitive to the precise atomic structure of the tip and substrate and also to the cutoff distance. Often the cutoff is taken as the point where the potential becomes repulsive Burnham et al. (1991). This criterion for contact correlated most simply with friction in a previous study at zero temperature Luan and Robbins (2006) and corresponds to the cutoff in the interfacial potential used here.
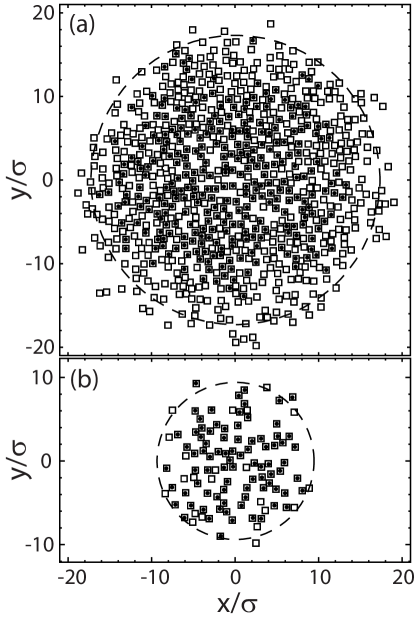
In our current simulations we found that thermal fluctuations lead to additional ambiguities in . Fig. 5 shows all atoms on an amorphous tip that feel a repulsive force in bare and wet contacts at and . There is clearly a pronounced increase in the size of contact when an adsorbed layer is present, but there is also a strong dependence on the observation time. Different symbols indicate the atoms that contacted during time intervals of and . The number of contacting atoms, and thus increases by about for the bare contact and by a factor of for the wet contact.
The variation of with the number of time steps is shown in Fig. 6. Values of over a given time interval were averaged over many starting times once the system had reached steady state. These results are for the amorphous tip, but similar results are obtained for tips with other geometries. For both bare and wet contacts the number of atoms in contact is constant at short times and then increases monotonically. The length of the initial plateau is about a quarter of the period of the most rapid vibrations between neighboring atoms, i.e., the Einstein modes. This is the minimum time for the configuration to change. To confirm this we analyzed the autocorrelation function for contact , where is the local pressure, the Heaviside function and angle brackets indicate an average over and . As shown for an adsorbed film in the inset of Fig. 6a, crosses zero after about time steps (). Deviations from the plateau in grow as drops and the asymptotic long time scaling of sets in at times of order to when is small.

The time dependence in comes from several factors. For the bare contact the dominant factor is thermal fluctuations of the substrate surface. The longer the time interval, the more time for a rare event to bring atoms at large into contact. The roughly logarithmic time dependence would be consistent with the Boltzmann distribution and a linear increase in energy with the height of surface atoms, but a proper calculation of would require a detailed analysis of normal mode energies and their effect on contact. For the wet contact, molecular rearrangements in the adsorbed film also contribute to changes in , leading to more rapid growth with observation time: with . Slow diffusion and aging in the center of the contact brings different tip atoms into contact. At large , the film is fluid and the cost for thermal fluctuations that bring adsorbed molecules up into contact with the tip is lower than for the bare contact. This further broadens the region of contacting atoms.
In the following we consider the contact area associated with the initial plateau in , which is just the mean number of atoms in contact at any instant in time. The corresponding contact area is then where is the area per tip atom. This represents a lower bound on the area of contact because of the monotonic rise in Fig. 6. It would be natural to define the area using a longer time interval that averaged out the rapid oscillations due to high frequency phonon modes, counting any atom that contacted over a period of . Even this short averaging interval increases the area by a surprisingly large ( increase in ). This should be kept in mind when comparing to continuum theory, but we do not present results for larger time intervals because it is hard to identify any unique choice for the length of the interval. If the contact region were circular, the effective contact radius would be and this quantity is compared to Hertz theory. Note that the contacting atoms are in general spread somewhat dilutely over a significantly wider region, i.e., .
Given the clear evolution in the number of contacting atoms with time interval, one may wonder whether there is a corresponding evolution in the contact radii measured from the pressure distribution. The answer is no. The radius determined from the second moment is particularly insensitive to time interval because it is dominated by the central regions of large pressure. The value of increases only slightly with time, changing by or less. The large circles in Fig. 5 show the values of determined from the long time interval. Note that some atoms outside the circle were in contact during the interval. However, the magnitude and duration of the forces during these contacts were so small that they did not contribute significantly to the average pressure and thus . Conversely, while many of the atoms inside do not contact during the short time interval, we find that there are always a few atoms with that make strong enough contacts to produce a significant pressure. The identity of the atoms that make this contribution varies from one time interval to the next, but the measured is nearly unchanged.
III.3 Variation of Contact Area with Load
Our results for the load dependence of different definitions of the contact radius are shown in Fig. 7. Values for the bare amorphous tip and the Hertz prediction (solid line) are shown for comparison. In most cases the radii rise linearly with and the slope is close to the Hertz prediction. However, there are large shifts between different measures of contact radius.
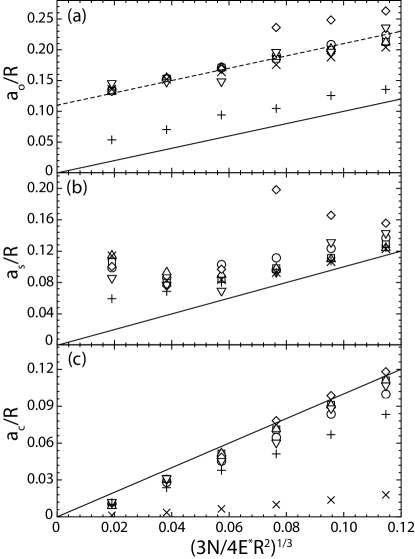
The radius where the pressure goes to zero (Fig. 7a) shows the largest deviations from Hertz theory. A significant increase over Hertz theory is observed for bare tips Luan and Robbins (2005); Luan (2006). Adding an adsorbed film spreads the pressure over a much larger area, as already seen in Fig. 5. Indeed the value of at the smallest load is bigger than the value predicted by Hertz theory for the largest load we studied. Note that at this radius, , the tip surface is only above the lowest point on the tip. For this height is comparable to the width of a molecular layer and it is not surprising that the film can spread contact over this distance. This effect is likely to be significant for most AFM tips, but the broadening would be insignificant for the much larger radii (mm) in Surface Force Apparatus measurements. The shift in for bare tips can also be attributed to a deviation from hard sphere behavior. However, instead of having an adsorbed layer that spreads interactions over a height of order , the broadening comes from the shorter lengths associated with the range of repulsive interactions () and amplitude of surface roughness Luan and Robbins (2005); Luan (2006).
For the stepped tip, rises in discrete steps as increases. As shown in Fig. 7a, it is almost constant for the lower three loads, jumps to another plateau for the next two loads, and has another discontinuous increase at the largest load. This is due to the fact that the surface of this tip has terraced steps. Each time that the next terrace comes into contact with the adsorbed film, increases to the outer radius of that terrace. Note that the sequence of terrace sizes is not uniquely determined by the tip radius and thus the load where jumps occur would vary with realization.
The pressure in the outer regions of the contact is small (Fig. 4) and does not contribute significantly to the load on the tip, particularly at large . Fig. 7b shows that the contact radius determined from the second moment of the pressure is much closer to the Hertz prediction. The results at the largest loads are generally parallel to the Hertz prediction and shifted upwards by only one or two molecular diameters. The only exception is the commensurate tip in registry. As noted above, it expels the film at the highest three loads and there is a second peak in the pressure at the edge of the expelled film (Fig. 4e) that increases . The difference between bare and wet contacts for amorphous tips is small, indicating that most of the contacting atoms in the outer region of Fig. 5b carry relatively little load. Similar results are obtained when comparing bare and wet contacts of other tips.
At the lowest loads the value of saturates or actually increases with decreasing load. This counterintuitive behavior results from the very low pressures in the contact. The lowest load is , corresponding to a pressure of only when spread over the observed radius of order . The thermal contribution to the pressure in a system of density is . Thus the lowest load could be balanced by an ideal gas with density of only for the temperature in our simulations. Hertz theory ignores thermal fluctuations and can not be expected to apply in this limit. The pressures corresponding to the second and third loads are about and times higher, respectively. The thermal contribution to the stress becomes increasingly irrelevant as the load increases and the Hertz prediction becomes more accurate. Note that at the lowest load we also find that the adsorbed layer is not in a glassy state.
It is interesting to consider how the loads considered here compare to typical experiments. If we take and , the loads considered here would range from about to . This is comparable to the range of experimental loads. However, experimental systems are often adhesive. Even weak van der Waals interactions lead to forces per unit area that are of order or larger and this may limit the role of thermal fluctuations. Studies of this are underway.
Figure 7c shows results for the radius , corresponding to the area of atoms in contact at any instant. As for , the increase in is roughly parallel to the Hertz prediction, but is generally shifted to lower radii. As noted above, is expected to be smaller than other measures. Including all atoms that contacted on the time scale of high frequency vibrations would increase by about and make it comparable to at large loads for most tips.
The results for the dense tip indicate another difficulty that arises in defining . Even for ideal flat surfaces, only a small fraction () of the atoms on the dense tip are close enough to contact the opposing surface. Atoms that lie between atoms on the opposing surface are too far away to contact. Normalizing by the fraction of atoms that are in contact for two flat surfaces gives values of that are quite close to those for other tips. Similar effects are likely to arise on surfaces with a range of surface species, where some species may be screened by others with greater height or larger interaction lengths. The relative contribution of different species to contact area is also unclear in this case.
Note that the results on for the in-registry commensurate tip rise slightly above the Hertz prediction at the three largest loads. This is because the tip breaks the adsorbed film and makes direct contact with the substrate. If we only count the number of tip atoms in that direct contact, then would be smaller than the Hertz prediction. However, including contacts with the film at the edge of the contact zone gives a larger .
III.4 Normal Stiffness of the Contact
Experiments can not measure the pressure distribution or contact radius directly, but the normal displacement can be determined if the device is sufficiently stiff Kiely and Houston (1998). Hertz theory assumes hard sphere interactions and the tip displacement is defined as the indentation relative to the first contact. In experiments and simulations the interactions always have a finite range that leads to ambiguity in the zero of . In our simulations, the long tail in the density shown in Fig. 2 leads to weak repulsions at large separations. As noted in the discussion of this figure, we took the density minimum at as the outer edge of the first monolayer. The tip would then contact this layer when height of the lowest tip atom was higher than this outer edge by the cutoff radius . We use this height as our zero for .
The filled symbols in Fig. 8 show the normal displacement of the tip for different tip geometries. The mean tip height was determined by averaging over at least at each fixed load. Uncertainties due to thermal fluctuations were less than , and greatest at low loads. The results are plotted against so that the Hertz prediction for an infinite substrate is a straight line. This is indicated by a dotted line. A solid line shows the continuum prediction with a correction for finite substrate depth. The correction is less than and smaller than the symbol size.
For all tips, the value of rises much more rapidly than predicted at low loads. At higher loads, the rate of increase slows and results for most tips can be fit by the Hertz prediction with a constant offset. In experiments the modulus of a substrate is often obtained from the slope of plots of against . Based on the results shown in Fig. 8, such fits should give reasonably accurate moduli () if extended to sufficiently high load.
Similar load-displacement curves are obtained in calculations for substrates that are covered by a thin layer that is more compliant Sridhar et al. (2004); Sergici et al. (2006). When the contact radius is much smaller than the layer thickness, indentation is described by the lower modulus of the layer and rises more rapidly. When the contact radius is much larger than the thickness, the effective compliance is that of the stiffer substrate. Plots like Fig. 8 should show two straight lines at low and high loads with slope changing by the ratio of . The change of slope in our calculations by almost a factor of three would imply an order of magnitude increase in modulus. Indeed, as discussed above, the film may be more fluid than solid at the lowest load.
To isolate the amount of displacement accommodated by the film, we also evaluated the mean normal displacement of atoms in the top layer of the substrate . Here the origin can unambiguously be taken as the mean height in the absence of any load. Moreover, Eq. 7 corresponds exactly to the expected substrate deformation for a rigid tip.
As shown in Fig. 8, is consistently below the Hertz prediction for all tips. The reason is that the adsorbed film distributes the force from the tip over a wider area. This increases the effective stiffness of the substrate and lowers the displacement. The broadening of the pressure becomes less important as the contact grows and is parallel to the Hertz prediction at large loads. The in-registry commensurate tip has a very large because the adsorbed film is pushed out. However, it produces a slightly smaller than those of other tips. This is because part of the load is spread to the fluid around the tip and spreading the load over a larger area makes the system stiffer.
The total change in is larger than that in . The difference must be accommodated by compressing the adsorbed film and the interfaces on either side. For the cases studied this is typically less than . This total change should be insensitive to the radius of the tip. Thus normalized plots like Fig. 8 will show larger changes for smaller and smaller changes for larger tip radii.
III.5 Time Dependence of Friction
Measurements of friction are known to be affected by the mechanical properties of the measurement device, whether at macroscopic Bowden and Tabor (1986) or nanometer Müser et al. (2003); Medyanik et al. (2006); Conley et al. (2008) scales. To illustrate the range of possible friction forces, we contrast the friction measured by stiff and compliant systems. In the stiff case, the tip is displaced at a constant velocity along the direction and the only compliance is provided by the substrate and the interface with the tip. In the compliant case, the tip is connected to one end of a spring of stiffness and the other end is displaced at constant velocity. The value of for each tip is chosen so that the spring is more compliant than either the substrate or contact. To limit the effects of inertia that are described below, a damping force is added so that the spring is critically damped. The damping does not contribute directly to the reported frictional forces.

Figure 9 shows the the time dependent friction force on out-of-registry commensurate and amorphous tips driven by stiff or compliant systems at . The commensurate tip exhibits simple, nearly periodic motion that is often seen in experiments Carpick and Salmeron (1997). Due to the periodic structure of the tip, the system can find an equivalent energy minimum after a displacement by a lattice constant . The amorphous tip is disordered and its motion is less regular.
The maximum friction force corresponds to the static friction that is needed to initiate steady sliding. For both tips the heights of force maxima are relatively insensitive to the compliance of the system. However the heights do vary with position, particularly for the amorphous tip. These fluctuations reflect changes in the conformation of the adsorbed layer and tend to increase in magnitude with velocity Luan and Robbins (2004). The kinetic friction corresponds to the time average of the friction force and varies strongly with compliance. Stiffer systems have a lower because the friction minima decrease with increasing stiffness and may even become negative.
To understand these trends it is useful to consider the simple Prandtl-Tomlinson model Prandtl (1928); Tomlinson (1929); Müser et al. (2003) for motion of a single degree of freedom, the rigid tip, in a potential with period . The equation of motion is
| (9) |
where is the mass, is the location of the tip, dots indicate time derivatives, is the stiffness of a pulling spring whose other end is at position , and is a damping coefficient. The static friction is just the maximum force exerted by the periodic potential, . The kinetic friction exhibits two different types of behavior depending on whether is smaller or larger than a critical value .
For there is a single static solution to Eq. 9 for each . As increases, the tip moves smoothly with and the friction from the periodic potential varies from positive to negative values. The resulting time average force is small and goes to zero with decreasing . This type of behavior is exhibited by the commensurate tip when the only compliance comes from the substrate. Note that the negative minima in the force are nearly equal and opposite to the positive maxima. The time averaged kinetic friction is less than of the static friction . To confirm that for this system, we note that the values of and imply . The compliance of the substrate is comparable to the prediction of continuum theory , where is the shear modulus and the contact radius. Since all measures of discussed above are larger than the continuum prediction of for this load, . The same condition holds for all other loads because decreases more rapidly with load than the contact radius does.
When there are multiple static solutions to Eq. 9 for a given . The tip remains stuck in one until it becomes unstable and then jumps rapidly to another static solution. The force is near before the jump, and only drops by of order since the distance between stable states is of order the period. As a result, the time average kinetic friction approaches as . For the commensurate tip with a compliant spring, and is almost of . Studies with weaker and stronger springs confirmed that varies from nearly zero at to almost unity in the limit .
The time dependence of the compliant system illustrates another effect that can change the measured kinetic friction. In Fig. 9(a) most of the drops in force have the same size, but two later drops are larger by a factor of three () and two (), respectively. In these cases the inertia of the tip allowed it to jump forward by more than one period. These multiple slip events are also observed in some AFM experiments and have been modeled using Eq. 9 Medyanik et al. (2006); Conley et al. (2008). They lead to a substantial reduction in by reducing the minima in the force.
The frequency and magnitude of multiple slip events vary with load as well as compliance and tip inertia Medyanik et al. (2006); Conley et al. (2008). While this may be important in certain experimental systems, it makes it difficult to report a single number for the load dependent kinetic friction on our model tips. To minimize the associated ambiguity, we will focus on cases where multiple slips have been eliminated by critical damping of the spring and use of a sufficiently stiff pulling spring for each tip.
The time dependence of the friction force on the stepped and incommensurate tips is qualitatively similar to that of the commensurate tip. In both cases, the tip can find an equivalent minimum if it moves forward by a lattice constant of the tip while the adsorbed film remains unchanged. Note that translating the incommensurate tip produces a different registry with the substrate, but this does not matter if the adsorbed film has already adapted to the periodicity of the tip.
In contrast, the time dependent friction on the amorphous tip is not simply described by Eq. 9. Because the structure of the tip is not periodic, the tip does not find an equivalent potential energy minimum after moving by any distance. Periodic motion would be possible if the adsorbed molecules slid rigidly over the substrate with the tip, but this is not observed. At low loads, sliding is localized at the interface between the tip and film. The film is damaged at higher loads, as discussed in the next subsection. While the tip drags some adsorbed molecules over the substrate, they do not translate rigidly with the tip and thus do not lock into an equivalent energy minimum after moving by a period.
The lack of periodicity has a direct impact on the friction traces for amorphous tips. Even for the stiff system, where , the friction force remains positive as the tip jumps forward. As a result, is close to for any degree of compliance. The minima in friction are typically about half the maxima rather than being equal and opposite in magnitude as predicted by Eq. 9. The negative forces for the stiff commensurate system come from the intervals where the tip is being pulled forward as it drops into a free energy minimum. There is no preformed minimum for the amorphous tip to drop into and thus no negative force.
For the stiff amorphous system the force shows oscillations that are not periodic but have a typical spacing that is of order the atomic diameter. This length scale enters simply because it is the typical distance that the tip must move to interact with different molecules after leaving a low free energy state. For the compliant system the motion is even less regular. There are some intervals where the force is fairly constant, and the tip moves over the substrate at a nearly constant velocity. At other times the tip gets stuck in a local free energy minimum. The force then rises linearly with time until the minimum becomes unstable and the tip jumps forward. Similar erratic stick-slip has been observed in previous simulations and was found to be sensitive to the inertia of the tip Luan and Robbins (2004). The simulations reported here are overdamped, which decreases the role of inertia.
III.6 Load Dependence of Friction
The static and kinetic friction were obtained from friction traces like those shown in Fig. 9. The kinetic friction is just the time average of the force after the system reaches a steady state. The static friction was obtained by identifying the peak forces during each interval where the surfaces locked together. We found the peaks were easiest to identify for the compliant systems and present those results below. Values obtained from stiff systems were the same within the statistical uncertainty, which was less than . Experiments, previous simulations, and simple models suggest that the static friction should grow with the time the surfaces are stuck together because of aging in the adsorbed film Dieterich (1979); Ruina (1983); Rottler and Robbins (2005); He and Robbins (2001a). This dependence is typically logarithmic in contact time and difficult to separate from statistical fluctuations. It is not considered here.
The static and kinetic friction were evaluated over a sliding distance of at least . At low loads the friction varied little over this interval. At the highest loads some tips induced transitions in the state of the film with sliding distance that changed the friction force.
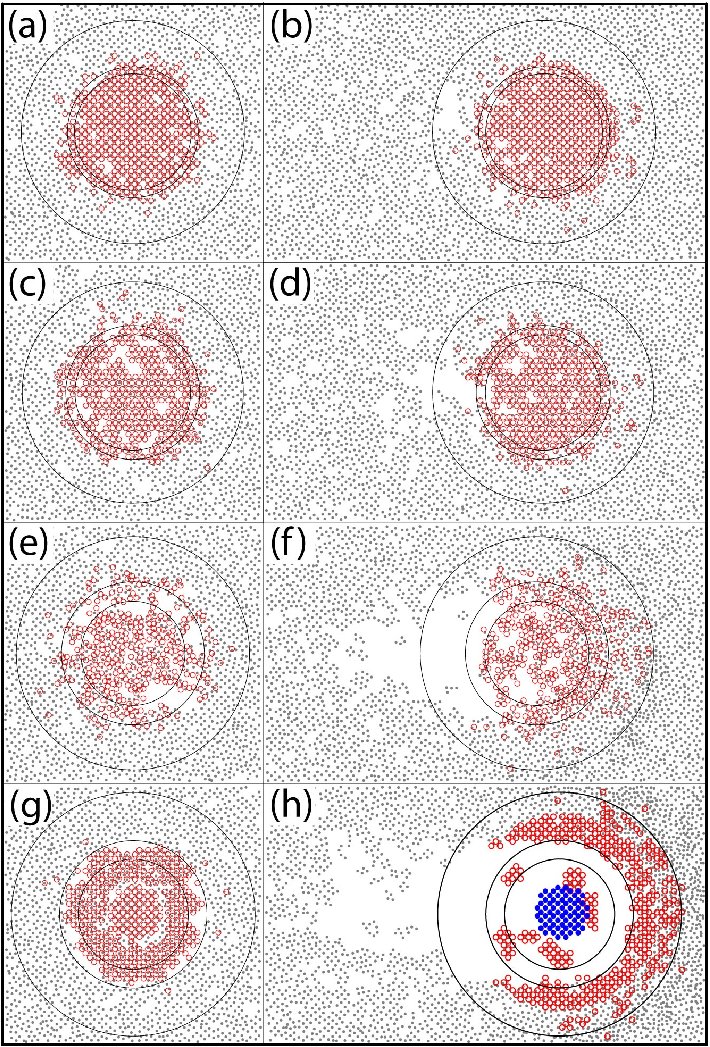
The evolution of film structure at is illustrated in Fig. 10. At this load, there is a tendency for a hole to form behind the tip and for molecules to pile up in front of the tip. The size of these effects increases with the roughness of the tip. The smallest changes are for the bent incommensurate and out-of-registry commensurate tips. Both slide on top of the film at all loads, with almost all of the sliding velocity accommodated at the tip/film interface. In contrast, the stepped tip completely expels film molecules from under the first terrace for . Molecules remain trapped under the second terrace and tend to move with the tip. For , even the adsorbed molecules under the second terrace start to be squeezed out. This allows the first terrace to contact the substrate directly for the first time and leads to a rapid rise in friction.
The amorphous tip slides on top of the film at low loads, but the mode of sliding changes for . Some of the molecules become trapped in the roughness of the tip and are dragged along with the tip. The sliding velocity is accommodated between these molecules and the substrate. Because the molecules are trapped in positions related to the roughness of the disordered tip, they do not lock well with the substrate and the friction rises less rapidly with than at lower loads. The tip and entrapped film molecules push the rest of the film aside. Molecules pile up in front and a bare patch is left behind. This bare patch fills in fairly rapidly and the region where the tip started has nearly healed by the end of the run. Such healing of the lubricant layer could be very important to function as a boundary lubricant.
A different type of time dependence was observed for the in-registry commensurate tip at high loads () and velocities. For the tip starts in direct contact with the substrate and the first friction peak is about twice as large as for the out-of-registry tip. Once sliding starts, the tip lifts up onto the film. The friction drops sharply and then rises gradually, with the final friction being very close to that for the out-of-registry commensurate tip. For this reason we do not show separate friction results for the in-registry commensurate tip. When the velocity was decreased to the tip remained in contact with the substrate during the sliding. In this case the tip plows through the film and the force peaks remain roughly twice the height of those at .
For both the in and out of registry bent commensurate tips, the sliding path takes atoms on the tip directly over atoms in the substrate. This is why the frictional forces are identical as long as the film is either present or absent for both tips. Previous work has shown that the friction on commensurate tips changes as the line of motion is displaced perpendicularly to the sliding direction Harrison et al. (1993); Perry and Harrison (1997); Gao et al. (2007). To illustrate the effect of perpendicular shifts, the stepped tip was displaced diagonally by along and so the tip atoms move along a line that is centered between substrate atoms. Before displacing the friction on the stepped tip is close to that on bent tips. After displacing the friction is reduced by a factor of about two, with the precise ratio depending on load. Similar reductions are observed when the bent commensurate tip is offset in the same way. The stepped tip was also made incommensurate by rotating it around the -axis by . This produced an even larger drop in friction.
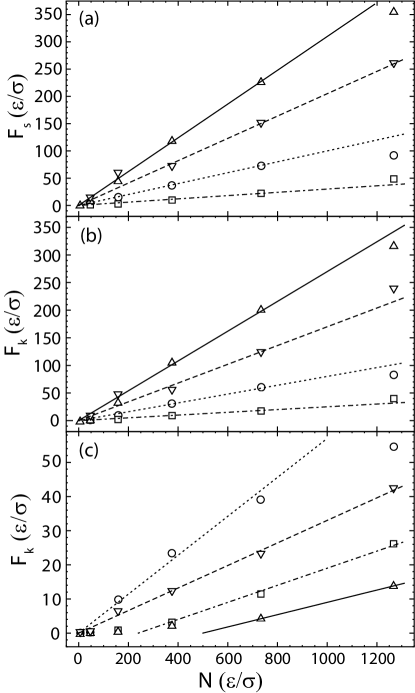
Figure 11 shows the load dependence of the static friction () on different tips and the kinetic friction () obtained for compliant and stiff systems. While the friction varies with tip geometry, the deviations are much smaller than those observed for bare tips. For the same tips, the friction in bare contacts varied by two orders of magnitude and showed different functional dependencies on load. Inserting the adsorbed layer has greatly reduced this sensitivity to tip geometry, and the variation is even smaller if the special case of commensurate tips moved directly over substrate atoms is removed. In addition, the tips all exhibit a roughly linear rise in friction with load, although there are transitions in behavior for some tip geometries. For example the friction on the stepped tip increases more rapidly when the film is expelled from the central terrace (), while the friction on the amorphous tip increases less rapidly with load when the film is damaged ().
In these and previous simulations the largest static friction is observed for the commensurate case where the opposing surfaces have the same period and orientation. This case also typically yields a linear relation between and load. The simplest explanation is that the surfaces are effectively in hard-sphere contact and the tip must be lifted up over atoms in the layer below before it can slide forward Müser et al. (2001). The friction provides the force needed to move the tip up the ramp formed by these atoms and the slope of the ramp gives . The slope is largest for the commensurate case because the effect of all atoms adds coherently. The slope is also larger when the tip atoms pass directly over the substrate atoms rather than passing between them as for the stepped tip simulations. For incommensurate and amorphous surfaces, the forces average to zero for bare, infinite surfaces. This cancellation is prevented by the adsorbed film because it adopts a glassy state that adapts to the structure of both tip and substrate He et al. (1999). However, the commensurate case still proves most easily locked together.
The kinetic friction for compliant systems is very similar to . The stiff amorphous results are also comparable to for the reasons discussed in the previous section. The friction force on commensurate systems is substantially reduced in the stiff system. The friction is nearly zero at small loads and then rises linearly at large loads. This behavior can be understood from the Prandtl-Tomlinson model. At low loads, and the kinetic friction vanishes with decreasing velocity. As the load increases, the potential and increase. At sufficiently large load, may be smaller than leading to a kinetic friction that follows the linear rise in . As expected from Fig. 9, the stiff commensurate system has for all loads. Even though the commensurate tip has the largest static friction of any tip, is the smallest and goes to zero with decreasing velocity.
There has been great interest in understanding the connection between the friction in molecular scale asperities and macroscopic measurements of friction. Amontons’s laws state that macroscopic friction is proportional to load and independent of the nominal area of the contacting surfaces. However, macroscopic surfaces are generally rough and, as noted above, the real area of molecular contact may be much smaller than the nominal area. In many cases, is expected to be proportional to load but is difficult to measure, making it unclear whether the area or load is controlling the friction force. There are also many exceptions to Amontons’s laws. For example, adhesion between surfaces leads to friction at zero or negative loads and grows in importance as dimensions shrink. Repulsive tip interactions were used in our simulations to eliminate adhesive effects.
The variation of friction with load in Fig. 11 is roughly linear and thus consistent with Amontons’s laws. As noted above, deviations from linearity tend to coincide with changes in the structure of film and location of sliding. Linear fits to the kinetic friction reach zero friction at a positive load, but this shift depends on the pulling spring and can be understood from the Prandtl-Tomlinson model (Eq. 9).
Studies of bare tips by Luan and Robbins showed that the friction did not always increase linearly with load over the same range of loads studied here Luan and Robbins (2006). In particular, the static friction on the amorphous and incommensurate tips increased sublinearly and the stepped tip showed discontinuous jumps in friction. When a film is present, the friction on the amorphous tip only rises sublinearly at the highest load and this is directly attributable to a change in sliding mechanism that one would not expect to describe simply in terms of the change in load or area.
Mo et al. have recently considered the friction between diamond and a hydrogen-terminated amorphous carbon tip, using realistic interaction potentials Mo et al. (2009). They concluded that both the friction and the area obtained from counting atoms, , were proportional to load and contrasted this with the results of Luan and Robbins. The plots shown by Mo et al. actually show that neither friction nor area is strictly proportional to load. Rather both are zero up to a finite load and then rise linearly. While this linear relation is still inconsistent with the sublinear relation obtained by Luan and Robbins, the latter authors reported the static friction while Mo et al. reported kinetic friction and went to much smaller dimensionless loads.
Figure 12 contrasts the static and kinetic friction on a bare amorphous tip over the range of dimensionless loads considered by Mo et al.. The static friction is strongly sublinear as noted by Luan and Robbins. The kinetic friction is consistent with the results of Mo et al.. As expected from the Prandtl-Tomlinson model, the friction is nearly zero at low loads where the driving system is stiff compared to the substrate potential. At larger loads the friction rises roughly linearly with load. The crossover between these behaviors moves to larger loads as the stiffness of the pulling spring increases. Note that the sensitivity to stiffness is lower when an adsorbed film is present because the potential energy is not a simple function of tip position as assumed in the Prandtl-Tomlinson model.
The results in Fig. 12 explain the apparent discrepancy between previous results. Luan and Robbins did not report because of the strong dependence on stiffness. Mo et al. did not report or vary the system compliance by adding a spring. However, the tip, substrate and hydrogen bonds terminating the tip all act as compliant elements. The importance of grafted hydrogen and hydrocarbons in locking surfaces together and dissipating energy has been shown in a number of studies by Harrison and coworkers Harrison et al. (1993, 1999).
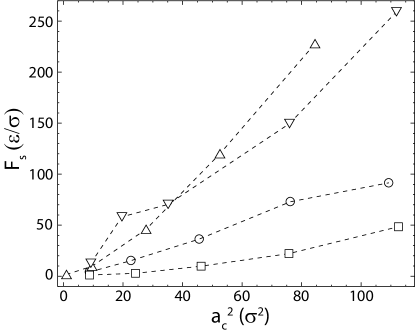
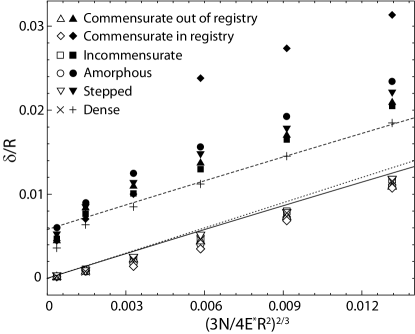
Both previous studies of bare tips found that the friction rose roughly linearly with area as measured either by Luan and Robbins (2005, 2006) or Mo et al. (2009). However, the friction did not necessarily got to zero at zero area, and in many cases the outer region contributed little to the friction. Fig. 13 shows a plot of friction vs. for tips sliding on a monolayer. The behavior at large forces could be fit to a line that reaches zero friction at a nonzero area. However, the friction is clearly not zero below this point and results at lower area show pronounced curvature. The curvature is even more pronounced when is used instead of as would be expected from the fact that scales as load to the power with an offset. We conclude that when a film is present the friction force is more strongly connected to normal load than area of contact.
IV Summary and Conclusions
A single fluid monolayer was shown to have a significant impact on the mechanical properties of single-asperity contacts. Although the molecules diffused rapidly on an isolated substrate, they entered a glassy state when confined under the tip. As a result, the film was only expelled at the highest loads and for an in-registry commensurate tip where the barriers to motion were smallest. Previous simulations of hydrocarbons between flat surfaces have also found films remain stable to very high pressures Landman et al. (1996); Persson and Ballone (2000). The pressure gradient produced by spherical tips should facilitate the expulsion of the film, but it remained stable over the times available to our simulations (s). The loads used are comparable to the largest in AFM experiments and produced surface strains of more than , which would lead to plastic indentation for most potentials other than the ideal springs considered here.
Sliding at high load was more likely to damage the film, but the disruption rapidly healed through fluid diffusion once the tip had passed. Sliding only produced direct contact for the stepped tip and only at the highest load. The in-registry commensurate tip expelled the film under static loading, but lifted on top of the film during sliding. All the above results suggest that relatively weakly adsorbed molecules may remain within contacts under typical loading conditions. Their ability to separate opposing surfaces and recover from damage are desirable features for boundary lubricants.
The adsorbed film spreads the contact pressure over a substantially larger area (Figs. 5 and 7) than for bare tips or Hertz theory. Deviations in the variation of pressure with radius between different tip geometries were smaller than for bare tips because the film smeared features out over a molecular diameter. This smearing also explains the large increase in the outer radius of the pressure distribution relative to Hertz. Values of are shifted by a constant of order the radius where the tip surface has risen above its lowest point by a molecular diameter, . This is a significant fraction of the radius for typical AFM tips, but would be a small effect in the larger contacts of a Surface Force Apparatus.
The pressure in the outer regions is small and may overestimate the effective size of contacts. Contact radii derived from moments of the pressure distribution are closer to the values for bare tips and to Hertz theory. At large loads, is shifted from Hertz theory by a constant offset of a few molecular diameters. As decreases, saturates. In this regime the local contact pressure is comparable to the ideal gas pressure. The tip is supported by thermal fluctuations in the upper edge of the monolayer. The width of this layer is of order and the pressure is spread over a radius of order .
The contact area was also determined from the number of tip atoms in contact at any instant multiplied by the area per atom. The corresponding radius is just slightly below the Hertz prediction for most tips and loads. The source of the large discrepancy between and at low loads is that each tip atom is only in contact for a small fraction of the time. This is consistent with the tip being supported by thermal fluctuations in the upper edge of the monolayer.
A surprisingly large temporal variation in the identity of the atoms that make contact was also observed at high loads. The number of tip atoms that contacted the adsorbed film over a time interval grew roughly as while the number contacting a bare substrate grew as . For bare surfaces the time dependence appears to reflect thermal vibrations in the substrate. For the adsorbed film, slow displacements of molecules to new glassy states and fluid fluctuations in low pressure regions at the edge of the contact also increase . The time dependence of makes it a more ambiguous measure of contact area than measures based on the mean pressure. Even increasing to the period of the fastest phonon vibrations changed the contact area by . Purely repulsive interactions were used here, but an attractive tail in the potential also complicates the definition of contacting atoms.
The adsorbed film also increases the normal tip displacement , which is directly accessible in some experiments Kiely and Houston (1998). The in-registry commensurate tip exhibits a large jump in displacement when the film is expelled. For other tips the displacement rises at the rate predicted by continuum theory at large loads. At smaller loads rises more rapidly. This is qualitatively consistent with continuum theory for a thin elastic coating where the effective modulus crosses over from that of the coating to that of the more rigid substrate as the contact radius becomes much larger than the film thickness Johnson and Sridhar (2001); Sridhar et al. (2004); Sergici et al. (2006). The deformation of the substrate is very close to Hertz theory, but is slightly reduced because the pressure is spread over a greater area.
The normal displacement is closer to Hertz theory than the contact radius because it reflects an average response of the entire system, while the contact pressure is a local property. Fits at large loads give accurate values of the substrate modulus, indicating that analogous experimental measurements provide accurate material parameters.
The static and kinetic friction were studied for tips moved at constant velocity or pulled by a spring. The static friction is insensitive to the stiffness of the system, but the kinetic friction decreases as the stiffness increases (Fig. 11). Similar behavior is observed in the Prandtl-Tomlinson model Prandtl (1928); Tomlinson (1929); Müser et al. (2003) and previous simulations of tips moving over a fixed potential Socoliuc et al. (2004); Glosli and McClelland (1993); Gyalog et al. (1995). The rate of decrease is greatest for commensurate tips where atoms can move coherently between metastable states and the tip feels a nearly fixed potential. Amorphous tips show the least decrease because they can not jump to an equivalent minimum. The resulting rearrangements in the film lead to greater dissipation and a larger .
For all tips, the static friction is roughly proportional to at low loads. Nonlinear behavior sets in at high loads when there is a transition, such as contact of a new terrace on a stepped tip or disruption of the film. The kinetic friction follows the same trends and is slightly smaller than when the tip is pulled through a weak spring. For a stiff system, the friction is extremely small for a range of loads and then rises linearly. The extent of the low friction region is largest for commensurate systems because of the coherent motion discussed above. The value of in this region goes to zero with decreasing velocity. A similar low friction region has been observed in AFM experiments at low loads and is consistent with the Prandtl-Tomlinson model Prandtl (1928); Tomlinson (1929); Müser et al. (2003). The apparent discrepancy between previous results for friction on bare amorphous tips Luan and Robbins (2005, 2006); Mo et al. (2009) could be explained by the fact that one reported while the latter reported .
The relation between friction and contact area was also examined for each of the definitions described above. The best correlation was obtained for the static friction and (Fig. 13), but the dependence is less linear than for load, and appears to go to zero at finite area. Note that scales roughly as (Fig. 7). If friction is linear in load, plots of friction against area should have the upwards curvature observed in Fig. 13.
The linear relation between friction and load is consistent with previous simulations of adsorbed layers between flat surfaces. For a wide range of atomic structure and surface coverage the shear stress is a linear function of the local pressure: . If this linear relation persists between rough surfaces, then the total friction should scale as for any distribution of pressure. For the case of nonadhesive interactions considered here is nearly zero and friction should rise linearly with load as observed. Moreover a direct comparison of the values of for simulations of flat surfaces with the ratios observed here shows the same trends with structure and similar numerical values. For example, commensurate surfaces yield , incommensurate surfaces have , and amorphous surfaces have He et al. (1999); He and Robbins (2001b); Müser et al. (2001) Simulations also show that is insensitive to the exact coverage He and Robbins (2001b), explaining why damage to the film does not produce dramatic changes in .
Studies of thin films between surfaces with a small random roughness found a similar linear rise in Gao et al. (2004). The authors argued that the real area of contact was irrelevant in these simulations because there was no direct contact of opposing surfaces, but any definition based on contact pressure would give the real area of load proportional to the apparent area in their simulations. It would be interesting to extend simulations to much rougher surfaces where the contact pressure is only significant over a small fraction of the apparent area and where this rises with load.
Another important extension will be to consider a monolayer which partially wets the tip. In this case a capillary meniscus will form around the tip. In addition to producing an adhesive force on the tip, the capillary may introduce new dissipation mechanisms. It may also serve as a reservoir that feeds molecules to the contact and prevents film rupture. Another parameter that could be varied is the thickness of the film on the substrate.
Acknowledgments
This material is based upon work supported by the National Science Foundation under Grant No. DMR-0454947 and the Air Force Office of Scientific Research.
References
- Johnson (1985) K. L. Johnson, Contact Mechanics (Cambridge, New York, 1985).
- Greenwood and Williamson (1966) J. A. Greenwood and J. B. P. Williamson, Proc. R. Soc. London, Ser. A 295, 300 (1966).
- Bowden and Tabor (1986) F. P. Bowden and D. Tabor, The Friction and Lubrication of Solids (Clarendon Press, Oxford, 1986).
- Persson (2001) B. N. J. Persson, Phys. Rev. Lett. 87, 116101 (2001).
- Hyun et al. (2004) S. Hyun, L. Pei, J.-F. Molinari, and M. O. Robbins, Phys. Rev. E 70, 026117 (2004).
- Campañá et al. (2008) C. Campañá, M. H. Müser, and M. O. Robbins, J. Phys.: Condens. Matter 20, 354013 (2008).
- Persson (2008) B. N. J. Persson, J. Phys.: Condens. Matter 20, 312001 (2008).
- Gee et al. (1990) M. L. Gee, P. M. McGuiggan, J. N. Israelachvili, and A. M. Homola, J. Chem. Phys. 93, 1895 (1990).
- Granick (1991) S. Granick, Science 253, 1374 (1991).
- Klein and Kumacheva (1995) J. Klein and E. Kumacheva, Science 269, 816 (1995).
- Carpick and Salmeron (1997) R. W. Carpick and M. Salmeron, Chem. Rev. 97, 1163 (1997).
- Kiely and Houston (1998) J. D. Kiely and J. E. Houston, Phys. Rev. B 57, 12588 (1998).
- Bhushan (2004) B. Bhushan, ed., Springer Handbook of Nanotechnology (Springer, Berlin, 2004).
- Carpick et al. (1999) R. W. Carpick, D. F. Ogletree, and M. Salmeron, J. Colloid Interface Sci. 211, 395 (1999).
- Schwarz (2003) U. D. Schwarz, J. Colloid Interface Sci. 261, 99 (2003).
- Luan and Robbins (2005) B. Luan and M. O. Robbins, Nature 435, 929 (2005).
- Luan and Robbins (2006) B. Luan and M. O. Robbins, Phys. Rev. E 74, 026111 (2006).
- Mo et al. (2009) Y. Mo, K. T. Turner, and I. Szlufarska, Nature 457, 1116 (2009).
- Greenwood and Tripp (1967) J. A. Greenwood and J. H. Tripp, Trans. ASME Series E, J. Appl. Mech. 34, 153 (1967).
- Hirano and Shinjo (1990) M. Hirano and K. Shinjo, Phys. Rev. B 41, 11837 (1990).
- Müser (2001) M. H. Müser, Tribol. Lett. 10, 15 (2001).
- Müser et al. (2001) M. H. Müser, L. Wenning, and M. O. Robbins, Phys. Rev. Lett. 86, 1295 (2001).
- Hirano (2006) M. Hirano, Surf. Sci. Rep. 60, 159 (2006).
- Dienwiebel et al. (2004) M. Dienwiebel, G. S. Verhoeven, N. Pradeep, J. W. M. Frenken, J. A. Heimberg, and H. W. Zandbergen, Phys. Rev. Lett 92, 126101 (2004).
- Dietzel et al. (2008) D. Dietzel, C. Ritter, T. Möninghoof, H. Fuchs, A. Schirmeisen, and U. D. Schwarz, Phys. Rev. Lett. 101, 125505 (2008).
- Martin et al. (1993) J. M. Martin, C. Donnet, T. L. Mogne, and T. Epicier, Phys. Rev. B 48, 10583 (1993).
- He et al. (1999) G. He, M. H. Müser, and M. O. Robbins, Science 284, 1650 (1999).
- He and Robbins (2001a) G. He and M. O. Robbins, Tribol. Lett. 10, 7 (2001a).
- He and Robbins (2001b) G. He and M. O. Robbins, Phys. Rev. B 64, 035413 (2001b).
- Johnson and Sridhar (2001) K. L. Johnson and I. Sridhar, J. Phys. D: Appl. Phys. 34, 683 (2001).
- Sridhar et al. (2004) I. Sridhar, Z. W. Zheng, and K. L. Johnson, J. Phys. D: Appl. Phys. 37, 2886 (2004).
- Sergici et al. (2006) A. O. Sergici, G. G. Adams, and S. Müftü, J. Mech. Phys. Sol. 54, 1843 (2006).
- Kremer and Grest (1990) K. Kremer and G. S. Grest, J. Chem. Phys. 92, 5057 (1990).
- Rottler et al. (2002) J. Rottler, S. Barsky, and M. O. Robbins, Phys. Rev. Lett. 89, 148304 (2002).
- Rottler and Robbins (2002) J. Rottler and M. O. Robbins, Phys. Rev. Lett. 89, 195501 (2002).
- Hoy and Robbins (2007) R. S. Hoy and M. O. Robbins, Phys. Rev. Lett. 99, 117801 (2007).
- Baljon and Robbins (1996) A. R. C. Baljon and M. O. Robbins, Science 271, 482 (1996).
- Rottler and Robbins (2001) J. Rottler and M. O. Robbins, Phys. Rev. E 64, 051801 (2001).
- Thompson and Robbins (1990) P. A. Thompson and M. O. Robbins, Phys. Rev. A 41, 6830 (1990).
- Love (1944) A. E. H. Love, A treatise on the mathematical theory of elasticity (Dover Publications, New York, 1944).
- Thompson et al. (1992) P. A. Thompson, G. S. Grest, and M. O. Robbins, Phys. Rev. Lett. 68, 3448 (1992).
- Gao et al. (1997) J. Gao, W. D. Luedtke, and U. Landman, Phys. Rev. Lett. 79, 705 (1997).
- Cui et al. (2003) S. T. Cui, C. McCabe, P. T. Cummings, and H. D. Cochran, J. Chem. Phys. 118, 8941 (2003).
- Luan et al. (2006) B. Luan, S. Hyun, J. F. Molinari, N. Bernstein, and M. O. Robbins, Phys. Rev. E 74, 046710 (2006).
- Knippenberg et al. (2008) M. T. Knippenberg, P. T. Mikulski, B. I. Dunlap, and J. A. Harrison, Phys. Rev. B 78, 235409 (2008).
- Luan and Robbins (2009) B. Luan and M. O. Robbins, Tribol. Lett. 36, 1 (2009).
- Gao et al. (2004) J. Gao, W. D. Luedtke, D. Gourdon, M. Ruths, J. N. Israelachvili, and U. Landman, J. Phys. Chem. B 108, 3410 (2004).
- Burnham et al. (1991) N. A. Burnham, R. J. Colton, and H. M. Pollock, J. Vac. Sci. Technol. A 9, 2548 (1991).
- Luan (2006) B. Luan, Ph.D. thesis, Johns Hopkins University, Baltimore (2006).
- Müser et al. (2003) M. H. Müser, M. Urbakh, and M. O. Robbins, Adv. Chem. Phys. 126, 187 (2003).
- Medyanik et al. (2006) S. N. Medyanik, W. K. Liu, I.-H. Sung, and R. W. Carpick, Phys. Rev. Lett. 97, 136106 (2006).
- Conley et al. (2008) W. G. Conley, C. M. Krousgrill, and A. Raman, Tribol. Lett. 29, 23 (2008).
- Luan and Robbins (2004) B. Luan and M. O. Robbins, Phys. Rev. Lett. 93, 036105 (2004).
- Prandtl (1928) L. Prandtl, ZS. f. angew. Math. u. Mech. 8, 85 (1928).
- Tomlinson (1929) G. A. Tomlinson, Phil. Mag. Series 7, 905 (1929).
- Dieterich (1979) J. H. Dieterich, J. Geophys. Res. 84, 2169 (1979).
- Ruina (1983) A. Ruina, J. Geophys. Res. 88, 10359 (1983).
- Rottler and Robbins (2005) J. Rottler and M. O. Robbins, Phys. Rev. Lett. 95, 225504 (2005).
- Harrison et al. (1993) J. A. Harrison, C. T. White, R. J. Colton, and D. W. Brenner, J. Phys. Chem. 97, 6573 (1993).
- Perry and Harrison (1997) M. D. Perry and J. A. Harrison, J. Phys. Chem. B 101, 1364 (1997).
- Gao et al. (2007) G. T. Gao, R. J. Cannara, R. W. Carpick, and J. A. Harrison, Langmuir 23, 5394 (2007).
- Harrison et al. (1999) J. A. Harrison, S. J. Stuart, and D. W. Brenner, in Handbook of Micro/Nanotribology, edited by B. Bhushan (CRC Press, Boca Raton, FL, 1999), pp. 525–594.
- Landman et al. (1996) U. Landman, W. D. Luedtke, and J. Gao, Langmuir 12, 4514 (1996).
- Persson and Ballone (2000) B. N. J. Persson and P. Ballone, J. Chem. Phys. 112, 9524 (2000).
- Socoliuc et al. (2004) A. Socoliuc, R. Bennewitz, E. Gnecco, and E. Meyer, Phys. Rev. Lett. 92, 134301 (2004).
- Glosli and McClelland (1993) J. N. Glosli and G. McClelland, Phys. Rev. Lett. 70, 1960 (1993).
- Gyalog et al. (1995) T. Gyalog, M. Bammerlin, R. Lüthi, E. Meyer, and H. Thomas, Europhys. Lett. 31, 269 (1995).