Broadband Imaging Segregation of Ly Emitting and Ly Absorbing Galaxies
Abstract
The spectral properties of Lyman break galaxies (LBGs) offer a means to isolate pure samples displaying either dominant Ly in absorption or Ly in emission using broadband information alone. We present criteria developed using a large LBG spectroscopic sample from the literature that enables large numbers of each spectral type to be gathered in photometric data, providing good statistics for multiple applications. In addition, we find that the truncated faint, blue-end tail of LBG population overlaps and leads directly into an expected Ly emitter (LAE) population. As a result, we present simple criteria to cleanly select large numbers of LAEs in deep broadband surveys. We present the spectroscopic results of LBGs and LAEs at pre-selected in the Canada-France-Hawaii Telescope Legacy Survey that confirm these criteria.
Subject headings:
galaxies: evolution — galaxies: formation — galaxies: fundamental parameters — galaxies: photometry1. INTRODUCTION
The Lyman break galaxies (LBGs; Steidel et al., 1996) are a high-redshift population of star forming galaxies selected by their rest-frame ultraviolet colors. LBGs at are faint ( corresponds to m at ) and require long integrations using 8 m class telescopes to obtain spectral information having a signal-to-noise ratio (S/N) of a few. Nevertheless, spectra have been obtained and studied (e.g., Le Fèvre et al., 2005; Cooke et al., 2005; Steidel et al., 2003, hereafter CCS03). Ly is the most prominent feature in LBG spectra and has been shown to be indicative of other spectral properties, such as interstellar medium absorption line strength and continuum profile (Shapley et al., 2003, hereafter AES03).
Inspection of the spectroscopic samples gathered to date show that % of LBGs exhibit dominant (or net) Ly in absorption, with the remaining exhibiting dominant Ly in emission (e.g., AES03 Cooke et al., 2005). A recent investigation of close and interacting pairs (Cooke et al., 2009a) finds evidence of an overabundance of LBGs exhibiting Ly emission in close pairs; all LBGs with projected physical separations kpc display Ly in emission. To properly explore this relationship, along with other spectroscopic trends with spatial distribution, large samples that reflect the spectral properties of LBGs are necessary. However, the conventional means of multi-object spectroscopy is inefficient in acquiring the spectra of galaxies closely spaced on the sky because of inherent mechanical constraints (see Cooke et al., 2009a). As a result, comprehensive LBG spectroscopic surveys are difficult and time intensive.
High-redshift star-forming systems with continua typically too faint for spectroscopic follow-up, but with prominent Ly emission (Cowie & Hu, 1998; Hu et al., 1998), have been detected via targeted spectroscopic and narrowband surveys (e.g., Dawson et al., 2004; Ouchi et al., 2005; Venemans et al., 2005; Gawiser et al., 2006). Because of the faint continua of these Ly emitters (LAEs), and the difficulties involved in their acquisition, LAE surveys have been limited to narrow redshift ranges and typically clustered fields. As a result, fewer total spectra have been compiled relative to LBGs, with the details of the process, or processes, that contribute to the generation and escape of Ly emission, less certain. In addition, the data-gathering techniques have provided only a few cases to date where the mass of LAEs from clustering can be reasonably inferred (Ouchi et al., 2003; Shimasaku et al., 2004; Kovač et al., 2007; Gawiser et al., 2007).
LBGs at that are dominated by Ly in absorption separate sufficiently in color–magnitude space from those dominated by Ly in emission to enable a simple means using broadband imaging to isolate subsets with desired Ly features and associated spectral properties. Furthermore, we find that deep broadband criteria can select clean, EW unbiased samples of LAEs with photometrically detectable continua. As a result, very large numbers systems over defined volumes with desired spectral properties can be efficiently obtained for statistical study, complementing the limitations of narrowband surveys and extensive deep spectroscopic campaigns. We describe the observations used in this work in Section 2. In Section 3, we present the behavior of LBG spectroscopic subsets, the criteria for LBG spectral-type and LAE selection, and the results of our spectroscopic test of the criteria. Finally, we provide a conclusion in Section 4. Magnitudes presented here are in the AB (Fukugita et al., 1996) magnitude system.
2. OBSERVATIONS
We use the publicly available data set of CCS03 111http://vizier.cfa.harvard.edu/viz-bin/VizieR?-source=J/ApJ/592/728/ and related accessible files to quantify the spectroscopic properties of LBGs and establish the spectral-type selection criteria. This survey consists of selected and spectroscopically confirmed LBGs from 17 separate fields that effectively sample the LBG population as a whole. As a key component to this work, we use the Ly EW measurements of AES03 for LBG spectra of the CCS03 sample (A. E. Shapley, 2009, private communication).
In Section 3.3, we test the criteria presented below using the spectra of -selected LBGs in the Canada France Hawaii Telescope Legacy Survey (CFHTLS) Deep field “D4” 222http://www1.cadc-ccda.hia-iha.nrc-cnrc.gc.ca/cadcbin/cfht/wdbi.cgi/cfht/tpx_fields/form. We -band select LBGs from stacked images that combine four years of high-quality observations that reach limiting magnitudes of and . The stacked -band images probe mag deeper than the -band images of CCS03 and thereby test a fainter regime. The LBG criterion for the CFHT Megacam filters imposes a weaker restriction on the -band depth as compared to the criteria of CCS03. This minimizes the introduction of a bias in LBG selection based on their colors. For further information on image stacking and color-selection spectroscopic tests, see Cooke et al. (2009b, Supplementary Information).
We acquired the spectroscopic data using the Low-Resolution Imaging Spectrometer (LRIS; Oke et al., 1995; McCarthy et al., 1998) mounted on the Keck I telescope on 2009 July 20 using the grism on the new blue arm and grating on the new red arm yielding a blue/red resolution of km s-1. Time constraints resulted in a total integration time of s with seeing FWHM. This is a the total integration time of typical LBG spectroscopy, but is found to be sufficient to identify most candidates and the Ly emission feature of LAEs.
3. ANALYSIS
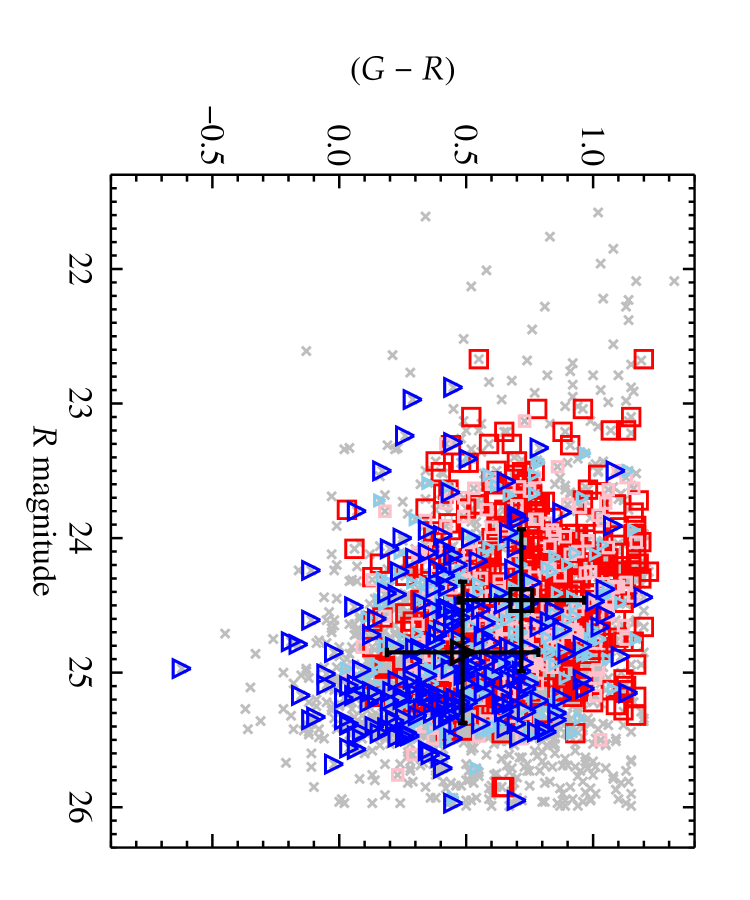
We construct a () versus color–magnitude diagram (CMD) for the CCS03 LBG photometric sample, plotted in the left panel of Figure 1. Motivated by the results of Cooke et al. (2009a), we overlay the spectroscopically confirmed LBGs and code them by their AES03 defined Ly EW quartiles. AES03 find that LBGs with strong Ly have blue Å continua with a continuous reddening trend seen with decreasing Ly emission EW, through to strong absorption. This is the main cause of the color separation on the CMD in Figure 1. The presence of the Ly feature in the band also contributes to the color separation, but to a lesser extent, and is on order of the mag uncertainties.
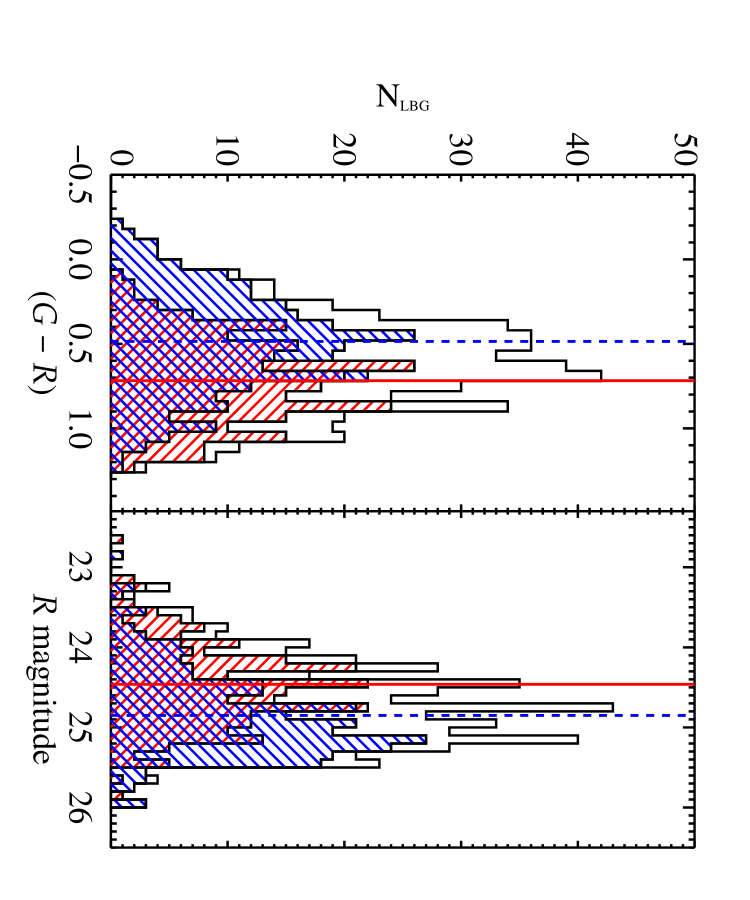
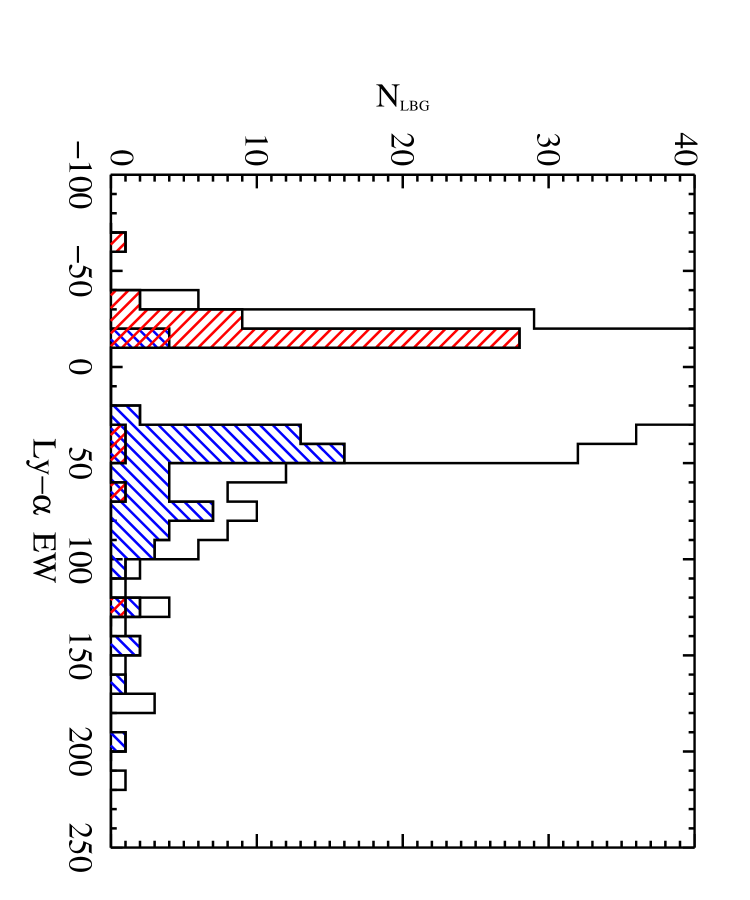
We use the term “aLBGs ” for LBGs with dominant Ly in absorption (net Ly EW ) and “eLBGs” for dominant Ly in emission (net Ly EW ). We find that the aLBG and eLBG distributions show significant overlap but are distinct populations. A two-sided K–S test of the aLBG and eLBG () distributions produces a probability of that the two distributions are pulled from the same population. Similarly, a K–S test produces for the mag distributions. This is illustrated in the right panels of Figure 1.
Next, we study two LBG spectral subsets that exhibit the opposite extremes in Ly EW behavior. Subset 1 contains the strongest aLBGs (net Ly EW ) and subset 2 consists of the strongest eLBGs (net EW ) of the full spectroscopic sample. The () versus CMD of the two subsets is plotted in Figure 2 and shows two cohesive distributions with a more distinct separation when compared to the aLBG/eLBG distribution values shown in Figure 1. Using the statistical mean values of the two subsets, we sever the populations in both color and magnitude as shown by the solid line in Figure 2. This line falls from both the color and magnitude mean values of both distributions and defines our primary cut. We show that more restrictive selections based on the slope of this cut (defined below), are very effective in isolating LBG spectral types with differing Ly and continuum profiles.
3.1. Spectral-Type Selection Criteria
We use the parameters of the subset 1 and 2 distributions to refine the primary cut in an effort to generate pure samples of each spectral type. Choosing CMD cuts that are separated from the primary cut by of the () distributions of each subset and along the same slope as the primary cut, selects LBG spectral types from the mean values of the opposite distribution. We find that the following criteria select nearly pure samples of aLBGs:
| (1) |
and eLBGs
| (2) |
where and and are the standard deviations of the () distributions for subset 1 and subset 2, respectively. These selection cuts are indicated in Figure 2.
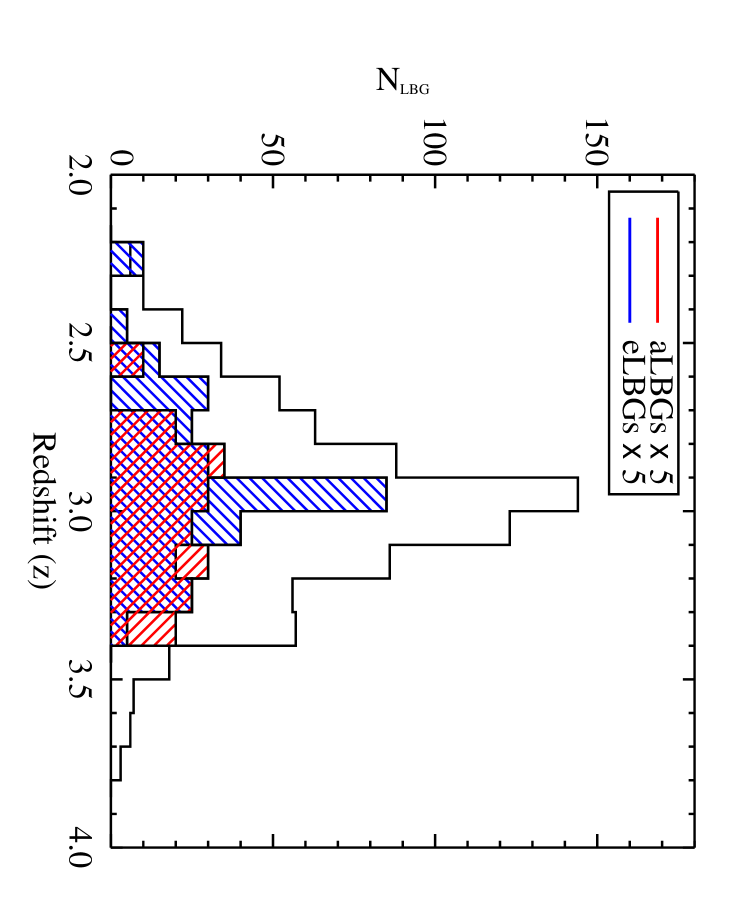
Applying Equations 1 and 2 to the full spectroscopic data set of CCS03 produces spectral-type samples consisting of aLBGs and eLBGs with contamination fractions of and , respectively (Figure 3; top panel). In addition, Figure 3 presents the net Ly EW and redshift distributions for the two isolated samples (center and bottom panels, respectively). The samples exhibit Å EW for the eLBGs and Å EW for the aLBGs and their redshift distributions are found to be representative of the full data set ( = , = , and = ). The above criteria, of course, can be made more strict by using a larger coefficient of and , thereby producing samples that are more pure, at the cost of sample size. In this manner, large photometric data sets can obtain very clean spectral-type samples while still maintaining a large number of objects for good statistics.
3.2. Ly emitters
LAEs at have colors similar to eLBGs with the bulk expected to have () (see Reddy & Steidel, 2009, Appendix A). The colors and mass of LAEs (e.g., Gawiser et al., 2007; Lai et al., 2008) appear to provide a natural extension of the LBG population and would help to complete the eLBG magnitude truncation.
From the aLBG/eLBG color and magnitude distributions and those of their spectral subsets, and the results of the spectral-type selection criteria above, we find that a pure sample of LAEs (defined here as having ) can be obtained using
| (3) |
which modifies the eLBG cut to a larger separation from the primary cut. This effectively avoids systems displaying Ly in absorption by selecting objects from the mean of the aLBG distribution. The region of the CMD defined by Equation 3 is indicated in Figure 2 and shows that the few spectroscopically identified objects in the CCS03 sample that meet these criteria exhibit Ly in emission. Similar to above, the purity of the LAE sample can be determined by the coefficient.
3.3. Spectroscopic Tests of the Spectral-Type Predictions
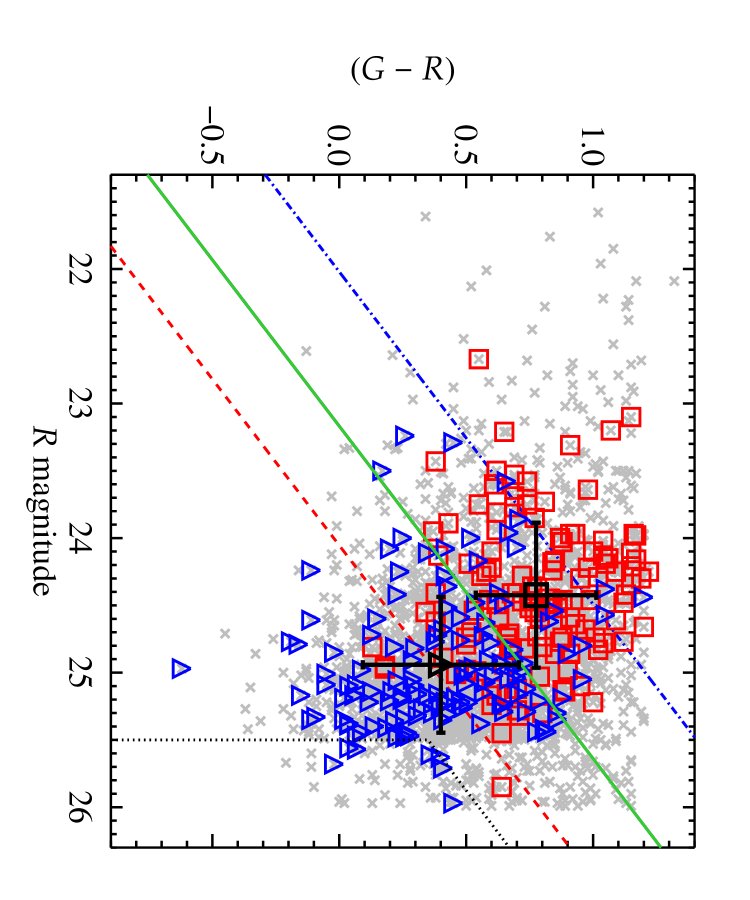
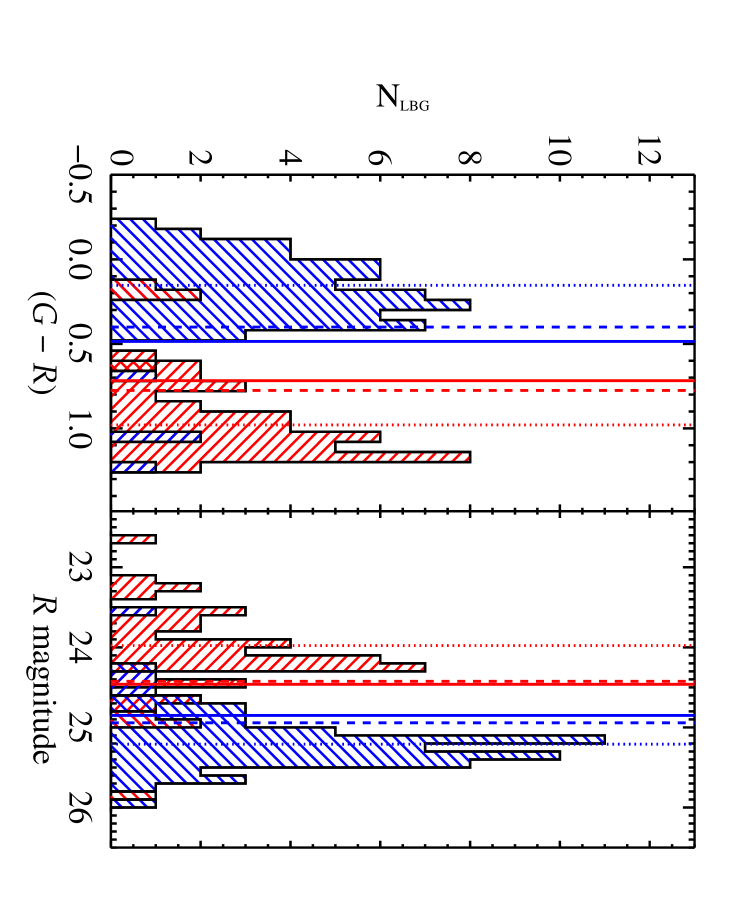
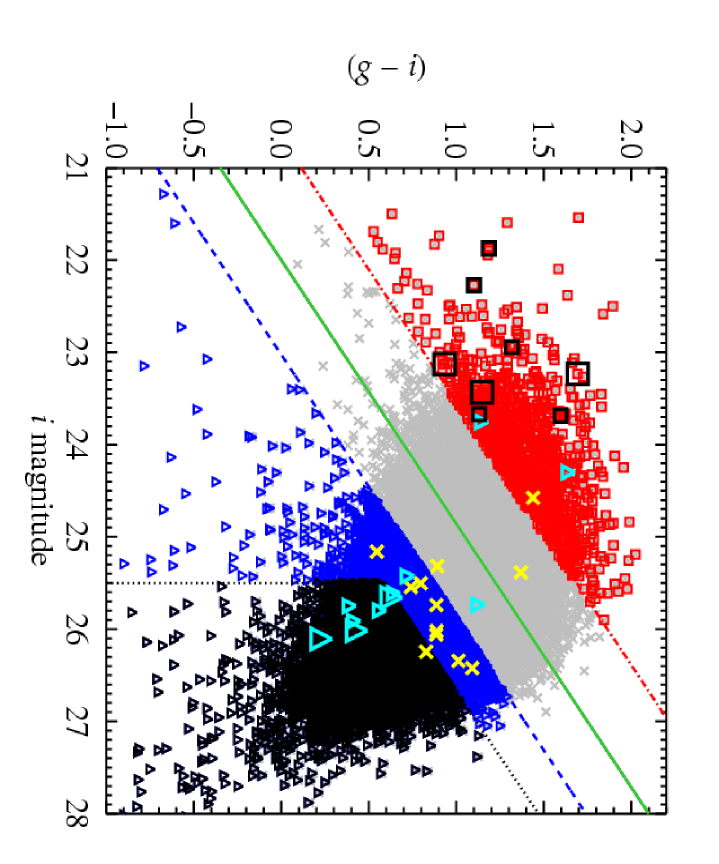
We use -selected LBGs in the CFHTLS Deep field “D4” to test the predictions of the spectral-type criteria and our LAE assumptions. Figure 4 plots the () versus mag CMD for the “D4” field and shows our tentative spectral-type cuts based on the LBG densities and the results of the above analysis. The primary cut shown here produces aLBG/eLBG samples with a very similar ratio () as compared to the ratio of CCS03 when maintaining conventional color-selection criteria, and specifically the constraint () . For more complete color-space detection, we relax the criterion to () to include the small number of bluer objects to probe the full eLBG and expected LAE () distribution. The relaxation of the color in this manner does not increase the fraction of interlopers (e.g., CCS03; Cooke et al., 2005). The “D4” field is reflective of the remaining three CFHTLS Deep fields in depth and generates spectral-type samples of aLBGs and eLBGs, of which fall in the LAE selection region (LAE magnitude definition shown in Figure 4 is ).
The analysis of our spectra (Section 2) indicates that our tentative spectral-type cuts are very effective. Of the LBGs targeted in the aLBG spectral-type cut, eight have confirmed Ly in absorption, two show complex absorption and emission profiles with net Ly emission, and one is unidentified as a result of its low S/N. Nine of the 17 LBGs targeted in the eLBG region were unidentified (although six show weak evidence of emission), with eight exhibiting Ly emission. Seven of the eight galaxies that fall in the LAE region show Ly emission, with the remaining galaxy being unidentified. This demonstrates a high efficiency in identifying LAEs from their broadband colors and helps to confirm the LAE extension to the LBG population.
4. CONCLUSION
We present an analysis of the photometric properties of the LBG spectroscopic sample of Steidel et al. (2003). The relationships between Ly EW and () and Ly EW and mag enable a spectral separation of the LBG population using broadband data. We define statistical photometric cuts to reliably generate % pure spectral-type samples of LBGs displaying dominant Ly in absorption and dominant Ly in emission. In addition, the spectral-type broadband criteria are extended to isolate clean samples of LAEs.
Our spectroscopic sample of LBGs from the CFHTLS demonstrates the efficiency of the broadband criteria presented here in identifying galaxies based on their Ly feature, including LAEs. Use of this method will allow the statistical study of galaxies populations from the large numbers easily acquired in deep broadband surveys. This circumvents the expense and constraints of investigations using MOS spectroscopy and the limitations of narrowband searches. Further tests of the criteria, and the extension of the results to other redshifts and filter sets, are presented in a future paper.
References
- Cooke et al. (2005) Cooke, J., Wolfe, A. M., Gawiser, E., & Prochaska, J. X. 2005, ApJ, 621, 596
- Cooke et al. (2009a) Cooke, J., Berrier, J. C., Barton, E. J., Bullock, J. S., & Wolfe, A. M. 2009, MNRAS, submitted
- Cooke et al. (2009b) Cooke, J., Sullivan, M., Barton, E. J., Bullock, J. S., Carlberg, R. G., Gal-Yam, A., & Tollerud, E. 2009, Nature, 460, 237
- Cowie & Hu (1998) Cowie, L. L., & Hu, E. M. 1998, AJ, 115, 1319
- Dawson et al. (2004) Dawson, S., et al. 2004, ApJ, 617, 707
- Fukugita et al. (1996) Fukugita, M., Ichikawa, T., Gunn, J. E., Doi, M., Shimasaku, K., & Schneider, D. P. 1996, AJ, 111, 1748
- Gawiser et al. (2006) Gawiser, E., et al. 2006, ApJ, 642, L13
- Gawiser et al. (2007) Gawiser, E., et al. 2007, ApJ, 671, 278
- Hu et al. (1998) Hu, E. M., Cowie, L. L., & McMahon, R. G. 1998, ApJ, 502, L99
- Kovač et al. (2007) Kovač, K., Somerville, R. S., Rhoads, J. E., Malhotra, S., & Wang, J. 2007, ApJ, 668, 15
- Lai et al. (2008) Lai, K., et al. 2008, ApJ, 674, 70
- Le Fèvre et al. (2005) Le Fèvre, O., et al. 2005, A&A, 439, 845
- McCarthy et al. (1998) McCarthy, J. K., et al. 1998, SPIE, 3355, 81
- Oke et al. (1995) Oke, J. B., Cohen, J. G., Carr, M., Cromer, J., Dingizian, A., Harris, F. H., Labrecque, S., Lucinio, R., Schaal, W., Epps, H., & Miller, J. 1995, PASP, 107, 375
- Ouchi et al. (2003) Ouchi, M., et al. 2003, ApJ, 582, 60
- Ouchi et al. (2005) Ouchi, M., et al. 2005, ApJ, 620, L1
- Reddy & Steidel (2009) Reddy, N. A., & Steidel, C. C. 2009, ApJ, 692, 778
- Shapley et al. (2003) Shapley, A. E., Steidel, C. C., Adelberger, K. L., & Pettini, M. 2003, ApJ, 588, 65
- Shimasaku et al. (2004) Shimasaku, K., et al. 2004, ApJ, 605, L93
- Steidel et al. (1996) Steidel, C. C., Giavalisco, M., Pettini, M., Dickinson, M., & Adelberger, K. L. 1996, ApJ, 462, 17
- Steidel et al. (2003) Steidel, C. C., Adelberger, K. L., Shapley, A. E., Pettini, M., Dickinson, M., & Giavalisco, M. 2003, ApJ, 592, 728
- Venemans et al. (2005) Venemans, B. P., et al. 2005, A&A, 431, 793