Ly Blobs Like Company : The Discovery of A Candidate 100 kpc Ly Blob Near to A Radio Galaxy with A Giant Ly halo, B3 J2330+3927 at ††thanks: Based on data collected at Subaru Telescope, which is operated by the National Astronomical Observatory of Japan.
Abstract
We present the discovery of a candidate of giant radio-quiet Ly blob (RQLAB) in a large-scale structure around a high-redshift radio galaxy (HzRG) lying in a giant Ly halo, B3 J2330+3927 at redshift . We obtained narrow- and broad-band imaging around B3 J2330+3927 with Subaru/Suprime-Cam to search for Ly emitters (LAEs) and absorbers (LAAs) at redshift . We detected candidate 127 LAEs and 26 LAAs in the field of view of ( comoving Mpc). We found that B3 J2330+3927 is surrounded by a 130 kpc Ly halo and a large-scale ( comoving Mpc) filamentary structure. The large-scale structure contains one prominent local density peak with an overdensity of greater than 5, which is ( comoving Mpc) away from B3 J2330+3927. In this peak, we discovered a candidate 100 kpc RQLAB. The existence of both types of Ly nebulae in the same large-scale structure suggests that giant Ly nebulae need special large-scale environments to form. On smaller scales, however, the location of B3 J2330+3927 is not a significant local density peak in this structure, in contrast to the RQLAB. There are two possible interpretations of the difference of the local environments of these two Ly nebulae. Firstly, RQLAB may need a prominent () density peak of galaxies to form through intense star-bursts due to frequent galaxy interactions/mergers and/or continuous gas accretion in an overdense environment. On the other hand, Ly halo around HzRG may not always need a prominent density peak to form if the surrounding Ly halo is mainly powered by its radio and AGN activities. Alternatively, both RQLAB and Ly halo around HzRG may need prominent density peaks to form but we could not completely trace the density of galaxies because we missed evolved and dusty galaxies in this survey.
keywords:
galaxies: evolution – galaxies: formation – galaxies: individual: B3 J2330+3927 – cosmology: observations.1 Introduction
Ly blobs (LABs) are large Ly nebulae in the high redshift Universe. Since the 1980’s, LABs have been discovered around high-redshift radio galaxies (HzRGs, McCarthy, 1993; Miley & De Breuck, 2007). As the size and luminosity of these radio-loud LABs (RLLAB) show correlation with their radio activities, the formation mechanisms of LABs are thought to be mainly related to their radio and AGN activities (van Ojik et al., 1997). However, the formation mechanisms of the diffuse outer parts of the nebulae may be different from those of the bright central part related to AGN activities, since the outer parts of the nebulae show more quiescent kinematics than the central part and show more varied structures, such as filaments and bubbles (Villar-Martín et al., 2003; Reuland et al., 2003). Since the 2000’s, LABs lacking strong radio sources or AGN have been discovered (radio-quiet LAB, or RQLAB, Steidel et al., 2000). RQLABs also show filamentary and bubble-like structures, and the morphology of the outer parts of RLLABs and RQLABs are very similar (Matsuda et al., 2004). Although at least three possible ideas, such as cold gas accretion, galactic winds, and photoinonization by intense star-bursts or by obscured AGN, have been proposed to explain the formation mechanisms of the RQLABs (Taniguchi & Shioya, 2000; Haiman, Spaans, & Quataert, 2000; Chapman et al., 2001), there is no consensus yet (Geach et al., 2009; Dijkstra & Loeb, 2009). Both RLLABs and RQLABs often have bright sub-millimeter (sub-mm) sources and reside in overdense regions, they could be linked to massive galaxy formation in overdense environments (Steidel et al., 2000; Stevens et al., 2003; Smail et al., 2003; Venemans et al., 2007). It is possible that RLLABs and RQLABs are closely related objects, but this relation is still unclear.
While giant LABs are very rare objects, protoclusters and the surrounding large-scale structures often contain multiple giant LABs. The number densities of 100 kpc-scale LABs have been estimated to be Mpc-3 from several blind surveys for LABs (Saito et al., 2006; Smith & Jarvis, 2007; Yang et al., 2009). Despite this rarity, the SSA22 protocluster at contains two kpc RQLABs with a spatial separation of comoving Mpc (Steidel et al., 2000). The SSA22 protocluster is located at the central part of a filamentary large-scale structure with spatial extents of comoving Mpc (Hayashino et al., 2004). This structure also contains more than smaller ( kpc) RQLABs (Matsuda et al., 2004). The protocluster associated with a 250 kpc RLLAB, MRC 1138–262 also contains a 80 kpc RQLAB with a spatial separation of comoving Mpc (Kurk et al., 2004; Venemans et al., 2007).
What is the difference between RLLABs and RQLABs? Is there any difference between the local environments of RQLABs and RLLABs? Is it common that giant RL and RQLABs reside in the same structure? Until now, there has been no wide-field Ly imaging observation around RLLABs comparable to the SSA22 protocluster survey. We selected one of the most well-studied HzRGs, B3 J2330+3927 at , which was known to have a Ly nebulae with an extent of at least from the previous long slit spectroscopy and thus is a possible candidate for a giant RLLAB (De Breuck et al., 2003). B3 J2330+3927 has possible evidence that it resides in an overdense environment of galaxies. The JCMT/SCUBA observations of B3 J2330+3927 showed that it has at least two possible companion sub-mm sources lying within comoving Mpc (Stevens et al., 2003). Fortunately, the Ly of B3 J2330+3927 falls on almost the central wavelength of the filter, which was originally made for the SSA22 protocluster observations (Hayashino et al., 2004). Here we present results of our Ly imaging observation around B3 J2330+3927 with the .
In this letter, we use AB magnitudes and adopt cosmological parameters, , and km s-1 Mpc-1. In this cosmology, the Universe at is 2.0 Gyr old and corresponds to a physical length of 7.6 kpc at .
2 Observations and Data Reduction
| Filter | /a | Exposure Time | (lim)b | FWHM |
|---|---|---|---|---|
| (Å/Å) | (s) | (AB mag) | (′′) | |
| 4977/77 | 14400 () | 25.6 | 0.7-0.9 | |
| 4417/807 | 2880 () | 26.5 | 0.5-0.9 | |
| 5447/935 | 4320 () | 26.4 | 0.6-0.7 | |
| 4977/1742 | – | 26.6 | 1.0 |
aThe central wavelength and FWHM of the filters.
bThe limiting magnitudes within diameter apertures.

We took narrow- and broad-band images centred at (,) = 23:30:12.7, +39:30:41 (J2000.0) on 2007 November 09 (UT) with Suprime-Cam (Miyazaki et al., 2002) on the 8.2-m Subaru Telescope (Iye et al., 2004). Details of the observations are listed in Table 1. Suprime-Cam has a pixel scale of and a field of view of . The narrow-band filter, , has a central wavelength of 4977 Å and FWHM of 77 Å which corresponds to the redshift range for Ly at . Fig. 1 shows the transmission curves of the , and -band filters, and the Ly wavelength at the redshift of B3 J2330+3927 ().
The raw data were reduced with sdfred20080620 (Yagi et al., 2002; Ouchi et al., 2003) and iraf. We flat fielded using the median sky image after masking objects. We did background sky subtraction adopting the mesh size parameter of 64 pixels () before combining the images. We have confirmed that our results are not sensitive to these choices (see Section 3). Photometric calibration was obtained from the spectroscopic standard stars, LDS749B, and G191-B2B (Oke, 1990). The magnitudes were corrected for Galactic extinction of mag (Schlegel, Finkbeiner, & Davis, 1998). The variation of the extinction in this field is small (peak to peak, mag) and thus it does not affect our results.
The combined images were aligned and smoothed with Gaussian kernels to match their seeing to a FWHM of . We made a image [] for the continuum at the same effective wavelength as . The total size of the field analyzed here is after removal of low S/N regions near the edges of the images. We also masked out the halos of the bright stars. The resultant total effective area is 699 arcmin2 (corresponding to a comoving volume of Mpc3 at ).
Object detection and photometry were performed using SExtractor version 2.5.0 (Bertin & Arnouts, 1996). The object detections were made on the image (for Ly emitters, or LAEs) and image (for Ly absorbers, or LAAs), using a Gaussian detection kernel with FWHM of 1′′. We detected objects that had 5 connected pixels above of the sky background rms noise. The magnitudes and colours are measured for each object in diameter apertures.
3 Results
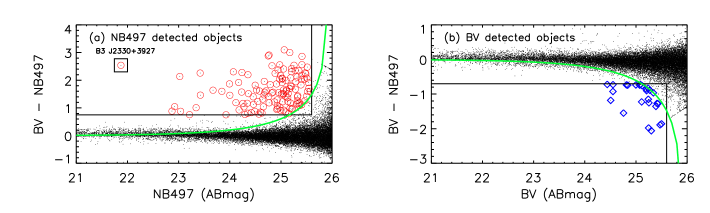
Fig. 2(a) shows a colour-magnitude plot for the detected objects. We selected 127 candidates as LAEs with the following criteria; (1) mag (), (2) mag ( Å), (3) , where the is the ratio between the excess and the uncertainty of colour based on photometric errors of both and for objects with constant spectra. The Ly luminosity limit of our LAE sample is erg s-1. We note that the contamination of [OII] emitters at in our LAE sample should be negligible thanks to the observed equivalent width limit of 80 Å (, e.g., Gawiser et al., 2007).
We verified whether the entire field of view of the B3 J2330+3927 field has overdensity compared with blank fields or not, using the image of Subaru-XMM Deep survey (SXDS) field taken by Hayashino et al. (2004). As a result, the number density of LAEs in the B3 J2330+3927 field is similar to that in SXDS at least for a sub-sample of bright LAE candidates with a large EW (L(Ly) erg s-1 and Å). Thus the B3 J2330+3927 field does not show evidence for overdensity in the entire field of view.
Fig. 2(b) shows a colour-magnitude plot for the detected objects. We selected 26 candidates as LAAs with the following criteria; (1) mag (), (2) mag ( Å), (3) , where the is the ratio between the depress and the uncertainty of colour. We used the same equivalent width limit for LAAs as used in Steidel et al. (2000). They have spectroscopically confirmed that their LAA sample is at (Steidel et al., 2000).
.
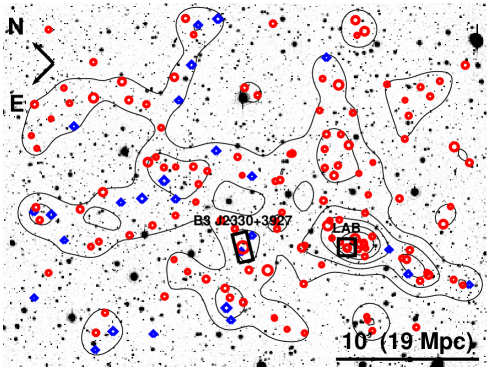
Fig. 3 shows the spatial distribution of candidate 127 LAEs and 26 LAAs in this field and the smoothed density map of these objects. We note that neither LAE nor LAA is detected at the positions of two sub-mm sources around B3 J2330+3927 in Stevens et al. (2003). We made the density map smoothed with a Gaussian kernel of , or FWHM comoving Mpc. The smoothing kernel size was chosen to match the median distance between the nearest neighbours in this sample.
We defined high-density regions (HDRs) as the regions with the overdensity . We mark the position of B3 J2330+3927 and the approximate direction of the radio axis (Pérez-Torres & De Breuck, 2005). B3 J2330+3927 is surrounded by a large HDR with an extent of ( comoving Mpc) . We have confirmed that it is difficult to reproduce such large HDRs from random distribution. We generated 10,000 density maps with the same size with 153 randomly distributed sources. The probability of finding HDRs with an area equal to or larger than that found around the B3 J2330+3927 is less than . Thus the large HDR around B3 J2330+3927 should be a real large-scale structure.
This large-scale structure contains one prominent density peak centred at (,) = 23:29:53.5, +39:21:45 (J2000.0), which is (15 comoving Mpc) south-west from B3 J2330+3927. This peak has an overdensity of , which is greater than a significance level of compared with the average of the density fluctuation in this map. Moreover we discovered a candidate giant RQLAB lying very close to the density peak. However, the location of B3 J2330+3927 is not a significant local density peak in this structure, in contrast to the new RQLAB. We note that there is no evidence for an overdensity of LAAs in the density peak, although LAEs appear to have a similar spatial distribution to LAAs on large scales in this field. We have confirmed that the results do not change significantly if we use different flat-field images taken by other projects and apply slightly different selection criteria for LAEs and LAAs.
| ID | RA(J2000) | Dec(J2000) | Angular Size | EWobs | log L(Ly) | log M | ||
|---|---|---|---|---|---|---|---|---|
| (h:s:m) | (d:s:m) | (′′/kpc) | (Å) | (cgs) | (mJy) | (M⊙) | ||
| LAB2330+3922 | 23:29:58.3 | +39:22:03 | 13/100 | 356 | 43.6 | – | ||
| B3 J2330+3927 | 23:30:24.9 | +39:27:11 | 17/130 | 637 | 44.4 |
aThe local overdensities () derived from the smoothed density map of LAEs and LAAs. The uncertainties are calculated from the Poisson error of the number of objects within the Gaussian smoothing kernel at the positions.
bThe 1.4 GHz flux density from NRAO VLA Sky Survey (NVSS, Condon et al., 1998)
cThe stellar mass from Seymour et al. (2007)
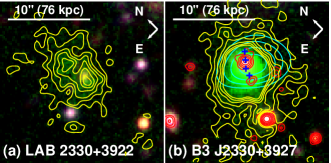
Fig. 4 shows colour images of the candidate RQLAB, LAB2330+3922 and B3 J2330+3927. The RQLAB has an extent of (100 kpc) and it is one of the largest LABs known to date. The RQLAB has two Ly peaks and was initially detected as two different LAEs. B3 J2330+3927 also has giant Ly nebula with an extent of (130 kpc). We listed the properties of these two LABs in Table 2. The Ly luminosities and observed Ly equivalent widths are measured using isophotal apertures with a threshold of erg s-1 cm-2 arcsec-2 (the lowest contours in Fig. 4). We have confirmed that there is no other prominent LAB in this field except for these two LABs, searching for LABs with the detection threshold of erg s-1 cm-2 arcsec-2 and the selection criteria of mag, mag, isophotal area arcsec2. We have also confirmed that the results do not change significantly if we use different mesh sizes for sky-subtraction in the data reduction process.
4 Discussion and Conclusions
We discovered a new candidate 100 kpc RQLAB, which appears to lie in the same large-scale structure around the RLLAB, B3 J2330+3927. This discovery is unlikely to be serendipitous. If we use the upper limit of the number density of 100 kpc-scale LABs from previous blind surveys for LABs at (Saito et al., 2006; Smith & Jarvis, 2007; Yang et al., 2009), the estimated probability to find a new 100 kpc LAB in the survey volume of our observation is only . Thus it is more likely that this large-scale structure is a special environment for LABs to form. However, we need spectroscopic redshifts of the new RQLAB and the large-scale structure to investigate whether the new RQLAB and the RLLAB are really in the same structure or not.
On smaller scales, the new RQLAB appears to lie in the local density peak in the large-scale structure, while the RLLAB, B3J2330+3927 does not. There are two possible interpretations of the difference of the local environments of these two LABs. Firstly, RQLAB may need a prominent () density peak of galaxies to form through intense star-bursts due to frequent galaxy interactions/mergers and/or continuous gas accretion in an overdense environment. The prototypes of RQLABs, SSA22 LAB1 and LAB2 are also known to reside in overdensities of star-forming galaxies of greater than (Steidel et al., 2000). On the other hand, RLLAB may not always need a prominent density peak to form if it is mainly powered by its radio and AGN activities. Alternatively, both RQLAB and RLLAB may need prominent density peaks to form but we could not completely trace the density of galaxies because we missed evolved and dusty galaxies in our survey. B3 J2330+3927 has two possible sub-mm companions although neither has a LAE/LAA counterpart (Stevens et al., 2003). Thus it is still possible that B3 J2330+3927 is associated with an overdense region of evolved and dusty galaxies. Future deep, wide-field NIR and sub-mm observations will be useful to investigate these possibilities by providing a complete map including evolved and dusty galaxies in these environments.
Acknowledgments
We thank the referee, Bram Venemans for careful reading the manuscript. We also thank Dave Alexander, Mark Swinbank, Jim Geach, Jim Mullaney, Richard Bower and Rob Ivison for help and useful discussions. YM and IRS acknowledge support from STFC.
References
- Bertin & Arnouts (1996) Bertin, E., & Arnouts, S. 1996, A&A, 117, 393
- Chapman et al. (2001) Chapman S. C., Lewis G. F., Scott D., Richards E., Borys C., Steidel C. C., Adelberger K. L., Shapley A. E., 2001, ApJ, 548, L17
- Condon et al. (1998) Condon J. J., Cotton W. D., Greisen E. W., Yin Q. F., Perley R. A., Taylor G. B., Broderick J. J., 1998, AJ, 115, 1693
- De Breuck et al. (2003) De Breuck C., et al., 2003, A&A, 401, 911
- Dijkstra & Loeb (2009) Dijkstra M., Loeb A., 2009, arXiv, arXiv:0902.2999
- Gawiser et al. (2007) Gawiser, E., et al. 2007, ApJ, 671, 278
- Geach et al. (2009) Geach J. E., et al., 2009, ApJ, 700, 1
- Haiman, Spaans, & Quataert (2000) Haiman Z., Spaans M., Quataert E., 2000, ApJ, 537, L5
- Hayashino et al. (2004) Hayashino T., et al., 2004, AJ, 128, 2073
- Iye et al. (2004) Iye M., et al., 2004, PASJ, 56, 381
- Keel et al. (1999) Keel W. C., Cohen S. H., Windhorst R. A., Waddington I., 1999, AJ, 118, 2547
- Kurk et al. (2004) Kurk J. D., Pentericci L., Röttgering H. J. A., Miley G. K., 2004, A&A, 428, 793
- Matsuda et al. (2004) Matsuda Y., et al., 2004, AJ, 128, 569
- McCarthy (1993) McCarthy P. J., 1993, ARA&A, 31, 639
- Miley & De Breuck (2007) Miley G., De Breuck C., 2007, A&ARv, 15, 67
- Miyazaki et al. (2002) Miyazaki S., et al., 2002, PASJ, 54, 833
- Oke (1990) Oke, J. B. 1990, AJ, 99, 1621
- Ouchi et al. (2003) Ouchi M., et al., 2003, ApJ, 582, 60
- Pérez-Torres & De Breuck (2005) Pérez-Torres, M.-A., & De Breuck, C. 2005, MNRAS, 363, L41
- Reuland et al. (2003) Reuland M., et al., 2003, ApJ, 592, 755
- Saito et al. (2006) Saito T., Shimasaku K., Okamura S., Ouchi M., Akiyama M., Yoshida M., 2006, ApJ, 648, 54
- Schlegel, Finkbeiner, & Davis (1998) Schlegel D. J., Finkbeiner D. P., Davis M., 1998, ApJ, 500, 525
- Seymour et al. (2007) Seymour N., et al., 2007, ApJS, 171, 353
- Smail et al. (2003) Smail I., Ivison R. J., Gilbank D. G., Dunlop J. S., Keel W. C., Motohara K., Stevens J. A., 2003, ApJ, 583, 551
- Smith & Jarvis (2007) Smith D. J. B., Jarvis M. J., 2007, MNRAS, 378, L49
- Steidel et al. (2000) Steidel, C. C., Adelberger, K. L., Shapley, A. E., Pettini, M., Dickinson, M., & Giavalisco, M. 2000, ApJ, 532, 170
- Stevens et al. (2003) Stevens J. A., et al., 2003, Natur, 425, 264
- Taniguchi & Shioya (2000) Taniguchi Y., Shioya Y., 2000, ApJ, 532, L13
- van Ojik et al. (1997) van Ojik R., Roettgering H. J. A., Miley G. K., Hunstead R. W., 1997, A&A, 317, 358
- Venemans et al. (2007) Venemans B. P., et al., 2007, A&A, 461, 823
- Villar-Martín et al. (2003) Villar-Martín M., Vernet J., di Serego Alighieri S., Fosbury R., Humphrey A., Pentericci L., 2003, MNRAS, 346, 273
- Yagi et al. (2002) Yagi M., Kashikawa N., Sekiguchi M., Doi M., Yasuda N., Shimasaku K., Okamura S., 2002, AJ, 123, 66
- Yang et al. (2009) Yang Y., Zabludoff A., Tremonti C., Eisenstein D., Davé R., 2009, ApJ, 693, 1579