First evidence for spectral state transitions in the ESO243-49 hyper luminous X-ray source HLX-1
Abstract
The brightest Ultra-Luminous X-ray source (ULX), ESO 243-49 HLX-1, with a 0.2 - 10 keV X-ray luminosity of up to 1042 erg s-1, provides the strongest evidence to date for the existence of intermediate mass black holes. Although small scale X-ray spectral variability has already been demonstrated, we have initiated a monitoring campaign with the X-ray Telescope onboard the Swift satellite to search for luminosity-related spectral changes and to compare its behaviour with the better studied stellar mass black holes. In this paper, we report a drop in the XRT count rate by a factor of which occurred simultaneously with a hardening of the X-ray spectrum. A second observation found that the source had re-brightened by a factor of which occurred simultaneously with a softening of the X-ray spectrum. This may be the first evidence for a transition between the low/hard and high/soft states.
1 Introduction
The most compelling evidence for the existence of intermediate mass black holes (IMBHs) comes from the observation of ULXs, extragalactic X-ray sources with bolometric luminosities exceeding 1039 erg s-1 which are located outside the nucleus of the host galaxy. These X-ray luminosities – if they are assumed to be isotropically radiated – are up to several orders of magnitude above the Eddington limit for the maximum mass of stellar mass black holes (e.g. Roberts, 2007). There is still an open debate about whether any ULXs host IMBHs. How IMBHs form and evolve is also a subject of intense debate, but they are thought to be associated with events such as the implosion of massive stars formed during the very first stages of star formation, the collapse of dense star clusters, and the early growth of supermassive black holes lying in the center of galaxies (Miller & Colbert, 2004).
2XMM J011028.1–460421, referred to hereafter as HLX-1, was discovered serendipitously by XMM-Newton on 23 November 2004 (hereafter XMM1) in the outskirts of the edge-on spiral galaxy ESO 243–49, at a redshift of 0.0224 (Afonso et al., 2005). Its 0.2 – 10 keV unabsorbed X-ray luminosity, assuming isotropic emission, was found to be ergs s-1: one order of magnitude larger than the previously known brightest ULX (Miniutti et al. 2006). A second XMM-Newton observation performed 4 years later (on 28 November 2008 – hereafter XMM2) revealed that the source spectrum and X-ray luminosity had changed. From its highest X-ray luminosity and the conservative assumption that the observed value exceeded the Eddington limit by a factor of 10, a lower limit of 500 M⊙ was derived for the black hole (BH) in HLX-1, thus providing the strongest evidence so far that IMBHs do exist (Farrell et al., 2009).
The evidence for spectral variability in HLX-1 from the two XMM-Newton observations was the motivation for monitoring the source with the Swift X-ray Telescope (XRT; Burrows et al., 2005). The aim of this program is to study its spectral properties as a function of its X-ray luminosity to search for any of the three canonical X-ray states identified in Galactic black hole binaries (GBHBs) (see for instance Remillard & McClintock, 2006). Observing transitions between these states could thus provide important information on the physical nature of ULXs (e.g. Kajava & Poutanen, 2009). Despite its lower effective area compared to XMM-Newton and Chandra, the XRT can record enough counts in relatively short exposure times (few to tens of kiloseconds) to track any significant luminosity and spectral changes. This has been recently demonstrated by Kaaret & Feng (2009) who reported on a monitoring campaign with the XRT of three prototype ULXs, i.e. Holmberg IX X-1, NGC 5408 X-1 and NGC 4395 X-2. No spectral state changes were observed in any of these three sources, despite significant changes in their X-ray luminosities (by up to a factor of 9).
In this paper, we present the results of the first two observations of our on-going monitoring campaign of HLX-1 with the Swift XRT. Compared with a previous XRT pointing performed one year before, this observation revealed not only a dramatic drop in the XRT count rate (by a factor of ) but also a significant hardening of the X-ray spectrum as well as a dramatic re-brightening (by a factor ) occurring simultaneously with a clear softening of the X-ray spectrum.
2 X-ray observations
HLX-1 was observed with Swift under the Target-of-Opportunity (ToO) program on 3 occasions so far: S1 2008-10-24 (33.5 ks), S2 2009-08-05 (19.2 ks) and S3 2009-08-16 (19.1 ks). All the Swift-XRT Photon Counting data were processed using the tool XRTPIPELINE v0.12.3 111See http://heasarc.gsfc.nasa.gov/docs/swift/analysis/. We used the grade 0-12 events, giving slightly higher effective area at higher energies than the grade 0 events, and a 20 pixel (47.2 arcseconds) radius circle to extract the source and background spectra using XSELECT v2.4a. The background extraction region chosen close to the source extraction region is the same for the three epochs S1, S2 and S3. No XMM-Newton sources are present inside the background extraction region. The average background count rate is count s-1. The ancillary response files were created using XRTMKARF v0.5.6 and exposure maps generated by XRTEXPOMAP v0.2.5. We fitted all the spectra within XSPEC v12.5.0a using the response file SWXPC0TO12S6-20070901V011.RMF, which includes an improvement of the soft energy response of the XRT (Godet et al. 2009a, ; Godet et al. 2009b, ); which is essential for a source as soft as HLX-1.
The XRT monitoring revealed that HLX-1 was highly variable over the past 10 months with a drop in count rate by a factor of from S1 to S2 followed by a dramatic re-brightening by a factor of from S2 to S3 (see Table 1).
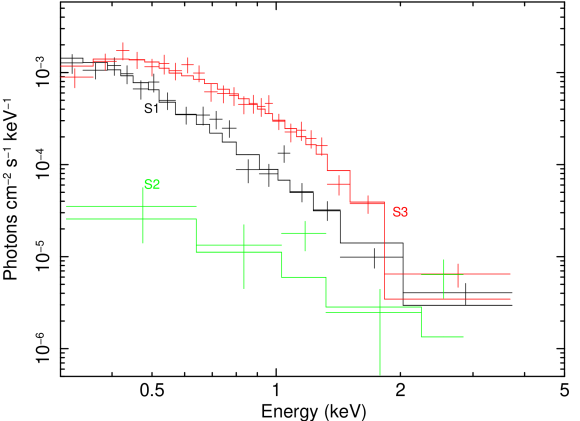
Fig. 1 shows the unfolded spectra for S1 (black), S2 (green) and S3 (red). The S1 and S3 spectra were binned to contain a minimum of 20 counts per channel, and were fitted using the minimisation technique. For all spectra, we fixed the absorption column at cm-2, the best constraint on derived by Farrell et al. (2009). All the best-fit models and spectral parameters are given in Table 1. From Fig. 1, it is immediately obvious that the source has varied significantly in flux. The results from S1 when fitted using an absorbed power-law appear to be consistent with those of XMM1 (Farrell et al., 2009) which showed a steep power-law, but are inconsistent with those of XMM2 (/dof=134/18 using the XMM2 best fit model) even though the two observations were performed only a month apart. The addition of a disk black-body component to the power-law model does not significantly improve the fit (; which corresponds to a F-test probability of 30%). The use of a unique absorbed disk black-body does not give a good fit either (). The S3 spectrum is extremely soft. Within the statistics of the XRT data, the S3 spectrum is better fitted () using a unique absorbed soft thermal emission than an absorbed power-law () with a -value fixed at cm-2. The sparse counts in S2 (28 counts in the background-subtracted spectrum) prevent us from performing any meaningful fitting analysis. Instead, we prefer to use spectral hardness-ratios (see below). Nevertheless, folding through the Swift-XRT response kernel the S1, XMM2 and S3 best-fit models multiplied by a constant factor gives adequate fits to the S2 data with a constant factor of ( erg s-1) for S1, ( erg s-1) for XMM2 and ( erg s-1) for S3. The numbers in parentheses are the corresponding unabsorbed 0.2-10 keV luminosity. In all cases, the S2 luminosity appears to be much lower than those derived for XMM1, XMM2, S1 and S3 by at least a factor of 10. For comparison, we plot in Fig. 1 the S2 spectrum (green) using a power-law with a fixed value of the photon index .
The fitting results are suggestive of a series of spectral changes. To investigate this, we compared the total number of counts in three energy bands: 0.3-1 keV, 1-3 keV and 3-10 keV (see Table 2). There is a significant drop (by a factor of ) in the soft 0.3-1 keV band between S1 and S2 when compared to the 1-3 keV band. This suggests a hardening of the spectrum between S1 and S2. The source was not detected above 3 keV in either the S2 or S3 data due to an overall low flux level in S2 and a steep spectral slope in S3. From S2 to S3, there is a significant increase in counts (by a factor of ) in the 0.3-1 keV band when compared to the other bands, indicating that the X-ray spectrum has softened again (see also Table 1).
3 State transitions in a ULX?
The detection of the same spectral states as those observed in the GBHBs would be extremely valuable in constraining the nature of ULXs. Spectra of other ULXs have been either interpreted as the source being in a low/hard state or in a very high state, even if the distinction between the two states is problematic (e.g. Soria & Kuncic, 2008). It appears that ULXs in the high/soft or thermal state are rare. Thermal components with temperatures in the range kT = 1 - 1.5 kev have been observed in the spectra of some ULXs for an emitted luminosity erg s-1, placing them at the extreme end of stellar mass BHs (Roberts et al., 2002). Winter et al. (2006) claimed the identification of several ULXs in the thermal state based on the detection of disk black-body (DBB) spectral components. However, in all cases, the DBB contribution was not significant with respect to the power-law component. Moreover, no state transition as seen in GBHBs has been observed in ULXs even those showing large luminosity variability (e.g. Gladstone & Roberts, 2009; Fridriksson et al., 2008). Claims for spectral state transitions, different from those seen in GBHBs have already been reported (see e.g. Liu et al., 2002; Soria & Motch, 2004). In these papers, the authors claimed evidence for a high/hard to low/soft transition. Recently, Isobe et al. (2009) claimed evidence for a spectral transition in the ULX, NGC 2403 Source 3 from a slim-disk state dominated by a keV disk black-body to a very high state dominated by a power-law spectrum.
When compared to other ULXs, HLX-1 is truly remarkable not only because its huge luminosity enables us to claim that it may harbour an IMBH with a M⊙ mass (Farrell et al., 2009), but also because its luminosity-spectral variability as observed in X-rays (see Section 2) shows compelling evidence for spectral variation on short timescales (see Fig. 2) that are consistent with what has been observed in GBHBs like GRS 1915+105 (Fender & Belloni, 2004). Indeed, HLX-1 was likely to be in the very high state in XMM1 & S1, while the source was in the high/soft state in XMM2 with a DBB luminosity corresponding to 80% of the total X-ray luminosity. In this case, the transition has occurred in a 1 month window. In S2, the data suggest that the source may have been in the low/hard state. The re-brightening and spectral softening in S3 suggest that HLX-1 has returned to a high/soft state brighter than during XMM2, the transition having occurred on a relatively short timescale ( days).
The low-temperature of the DBB component measured in XMM2 and S3 is in the same range as those measured in some ULXs ( keV; see Soria & Kuncic, 2008). This thermal component is often interpreted as direct emission from the accretion disk. The DBB normalisation and (via the inner radius of the accretion disk ) could then be used to constrain the BH mass. To do so, we assumed that corresponds to the radius of the last stable orbit around a non-rotating BH or a rotating BH with a maximum angular momentum (i.e. with , the Schwarzschild radius where , and are the BH mass, the speed of light and the gravitational constant, respectively). We found that the derived masses are in the range of IMBH masses with from XMM2 and from S3, where is the inclination of the disk with respect to the line of sight.
Within the limited statistics of the XRT spectrum, we have attempted to fit the highest quality spectrum (S3) with the slim disk model (Kawaguchi 2003). In order to reduce the number of free parameters, we freezed the source distance to 95 Mpc and the viscosity parameter to three possible values (0.01, 0.1 and 1). The fits suggest a BH mass larger than M⊙, thus adding another piece of evidence for the presence of an IMBH in HLX-1.
4 Conclusion
We have presented the first evidence for spectral state transitions in HLX-1, similar to those seen in GBHBs, strengthening the case for a black hole in the system. Since multi-wavelength observations (e.g. IR, radio) of HLX-1 continue to exclude alternative explanations for HLX-1, such as a foreground neutron star, or a background narrow line Seyfert 1 galaxy (Webb et al., in preparation), HLX-1 still provides the strongest evidence for the existence of IMBHs in the Universe.
References
- Afonso et al. (2005) Afonso, J. et al. 2005 ApJ, 624, 135
- Burrows et al. (2005) Burrows, D. N. et al. 2005, Space Sci. Rev., 120, 165
- Cash (1979) Cash, W. 1979, ApJ, 228, 939
- Dickey & Lockman (1990) Dickey, J. M. & Lockman, F. J. 1990, ARA&A, 28, 215
- Evans et al. (2009) Evans, P. A. et al. 2009, MNRAS, 397, 1177
- Farrell et al. (2009) Farrell, S. A., Webb, N. A., Barret, D., Godet, O. & Rodrigues, J. M. 2009, Nature, 460, 73
- Fender & Belloni (2004) Fender, R. & Belloni, T. 2004, ARA&A, 42, 317
- Fridriksson et al. (2008) Fridriksson, J. K. Homan, J. Lewin, W. H. G., Kong, A. K. H., Pooley, D. 2008, ApJS, 177, 465
- see Gehrels et al. (1986) Gehrels, N. 1986, ApJ 303, 336
- Gladstone & Roberts (2009) Gladstone, & Roberts, T. P. 2009, MNRAS, 397, 124
- (11) Godet, O. et al. 2009, A&A, 494, 775
- (12) Godet, O. et al. 2009, Release note on the Swift-XRT spectral response SWIFT-XRT-CALDB-13
- Isobe et al. (2009) Isobe, N. et al. 2009, PASJ, 61, 279
- Kaaret & Feng (2009) Kaaret, P. & Feng, H. 2009, accepted in ApJ, arXiv:0907.5415
- Kajava & Poutanen (2009) Kajava J. J. E. & Poutanen J. 2009, MNRAS, 398, 1450
- (16) Kawaguchi, T. 2003, ApJ, 593, 69
- Liu et al. (2002) Liu, J.-F. et al. 2002, ApJ, 581, L93
- Miller & Colbert (2004) Miller, M. C. & Colbert, E. J. M. 2004, International Journal of Modern Physics D, 13, 1
- (19) Miniutti, G. et al. 2006, MNRAS, 373, 1
- Remillard & McClintock (2006) Remillard, R. A. & McClintok, J. E. 2006, ARA&A, 44, 49
- Roberts (2007) Roberts, T. P. 2007, ApSS, 311, 203
- Roberts et al. (2002) Roberts, T. P., Warwick, R. S., Ward, J. M. and Murray, S. S. 2002, MNRAS, 337, 677
- Soria & Kuncic (2008) Soria, R. & Kuncic, Z. 2008, Proceedings of the 2nd Kolkata Conference on Observational Evidence for Black Holes in the Universe held in Kolkata India, AIP Conference Proceedings, 1053, 103
- Soria & Motch (2004) Soria, R. & Motch, C. 2004, A&A, 422, 915
- Winter et al. (2006) Winter, L. M., Mushotzky, R. F. and Reynolds, C. S. 2006, ApJ, 649, 730.

| Observation | Observationa | Model | Spectral | b | |
| Number | starting date | parameters | (0.2-10 keV) | ||
| ( erg s-1) | |||||
| S1 | 2008-10-24 | ABS PLc | 20/16 | ||
| S3 | 2009-08-16 | ABS DBBc | keV | 14.4/21 | |
| Observation | Exposure | Counts a | Countsa | Countsa | Count rate |
|---|---|---|---|---|---|
| Number | time | (0.3-1 keV) | (1-3 keV) | (3-10 keV) | (0.3-10 keV) |
| (ks) | (cts s-1) | ||||
| S1 | 33.45 | ||||
| (19.17) | ()b | ()b | ()b | ||
| S2 | 19.17 | ||||
| S3 | 19.09 | ||||
| (19.17) | ()b | ()b | – |