Many-body effects in the cyclotron resonance of a magnetic dot
Abstract
Intraband cyclotron resonance (CR) transitions of a two-electron quantum dot containing a single magnetic ion is investigated for different Coulomb interaction strengths and different positions of the magnetic ion. In contrast to the usual parabolic quantum dots where CR is independent of the number of electrons, we found here that due to the presence of the magnetic ion Kohn’s theorem no longer holds and CR is different for systems with different number of electrons and different effective electron-electron Coulomb interaction strength. Many-body effects result in shifts in the transition energies and change the number of CR lines. The position of the magnetic ion inside the quantum dot affects the structure of the CR spectrum by changing the position and the number of crossings and anti-crossings in the transition energies and oscillator strengths.
pacs:
78.67.Hc, 71.55.Eq, 75.75.+a, 75.50.PpI Introduction.
Single-doped magnetic impurity quantum dots (QDs)Furdyna are considered as promising nano-structures for spintronic physics. Besides, these systems allow to probe the impurity spin statesBesombes ; Leger . Furthermore, spin information in these spin-based devices can be storedGall (and retrieved) in the magnetic moment of the Mn-ion. In these nano-systems one can confine a small number of electrons that can be manipulated by e.g. the gate voltage. These diluted magnetic semiconductor nano-structures have attracted a lot of attention to theoreticians and experimentalists within the past ten years. Those studiesBesombes ; Leger ; Govorov ; Schmidt ; Worjnar ; Fernandez ; Chang ; Gall ; Glazov ; Hawrylak ; NTTNguyen2 include investigations of the electronic structure, the magnetic properties, optical absorption, etc. For a recent review of experimental and theoretical work on QDs doped with magnetic impurities the reader is referred to Ref.Govorov_review
Magnetic-optical properties of nonmagnetic few-electron QDs were investigated in e.g. Refs.Kohn-Luttinger ; Kohn ; Peeters ; Sikorski ; Geerinckx ; Helle . It was found theoreticallyKohn ; Peeters and experimentallySikorski that the optical cyclotron resonance energies in the case of quadratic confining potentials are independent of the number of electrons. In other words, the electron-electron (e-e) interaction does not result in any observable changes in the far-infrared (FIR) spectrum for different -electron systems. This theorem is no longer valid in the presence of impurities as found experimentallyNicholas and theoreticallyMerkt .
In this paper we study a magnetic semiconductor system [Cd(Mn)Te] in the presence of a Mn-ion of spin (). We find that the excitation energy spectrum of the quantum dot will change due to the presence of the Mn-ion. Different CR lines in the electron absorption energy spectrum are found as a consequence of the electron-magnetic-ion (e-Mn) spin-spin exchange interaction. Positioning the Mn-ion at different positions inside the QD affects the results significantly. We found also that the e-e interaction influences the electron excitation spectrum.
A two-dimensional few-particle circular parabolic QD was considered as a model system to study e.g. the pair Coulomb interaction effectMaksym ; Wojs . Here we will use this model to examine the effect of the e-e interaction on the intra-band absorption spectrum of a two-electron QD containing a single Mn-ion. Detailed studies of the FIR spectra in the case without a Mn-ion were done for quantum dot moleculesHelle containing few electrons in which the e-e interaction leads to small shifts in the peak position of the CR spectrum.
The intra-band energy absorption spectrum of a magnetic QD was calculated by Savić et alSavic for a single electron in the presence of one and two Mn-ions in a 3D non-parabolic CdTe/ZnTe QD system, and recently by ourselvesNTTNguyen1 for a single electron in a 2D purely parabolic single-doped-Mn2+ CdTe self-assembled QD. Both studies pointed out that with the presence of the Mn-ion, the in-plane intra-band absorption energy spectra exhibits several CR-lines as a consequence of the e-Mn interaction. Here we extend our previous work to the case of two electrons and study the effect of the e-e interaction on the CR and the magneto-optical absorption spectrum. One way to see that the e-e interaction will affect the CR spectrum is by writing the two-electron Hamiltonian in terms of center-of-mass () and relative () coordinates:
| (1) |
where
| (2a) | |||
| (2b) | |||
| and | |||
| (2c) | |||
are, respectively, the center-of-mass, the relative, and the electron spin Mn-ion spin Hamiltonian. is the total Zeeman spin energy. and are, respectively, the total mass and total charge of the electrons. is the confining frequency, and are the center-of-mass and relative magnetic vector potential, respectively. In a CR experiment the long-wavelength radiation interacts only with the center of mass through where is the electric field of the FIR. Notice that due to the interaction of the electron spin with the Mn-ion spin the center of mass is coupled with the relative coordinates which contain information on the e-e interaction.
In the next section we describe our theoretical approach to solve the many-particle system which is based on the configuration interaction (CI). Sect. III presents our numerical results. A summary and our conclusions are given in Sec. IV.
II Theoretical approach
The HamiltonianHawrylak ; NTTNguyen2 for a parabolic quantum dot containing two electrons interacting with a single Mn-ion () in the presence of a perpendicular magnetic field in second-quantized form reads:
| (3) |
where in the sum is the single-particle Fock-Darwin state: having corresponding on-site energy: with the frequency that defines a new length where is the cyclotron frequency. This new effective length is related to the confinement length via the relation: with . It is convenient to use this dimensionless parameter instead of the frequency . For our numerical work we consider the host semiconductor CdTe and indicate the Landé g-factor of the electron and the Mn-ion by and , respectively. The strength of the electron-Mn-ion spin-spin exchange interaction is evaluated via: as the product of single-electron Fock-Darwin wave functions and at the position of the Mn-ion. We define a dimensionless parameter: as the Coulomb interaction strengthNTTNguyen2 with the effective Bohr radius.
We use the many-body wave function, built up from the Fock-Darwin basis, namely the Slater determinant for a specific configuration of the electrons and the Mn-ion, which now includes the spin part of the Mn-ion . As an example, the two-electron wave function for configuration is written:
| (4) |
where is the radial and spin coordinates of the electron in state - a product of the Fock-Darwin and the spin coordinate - as the single-particle wave function. Now we employ the CI method to define the wave function of the system: as a linear combination of all possible configurations where is given by Eq. (4). The number of configurations is determined by the number of Fock-Darwin orbitals , the number of electrons which in the present study is , with taking into account a factor of due to the electron spin and a factor of due to the Mn-ion spin size : . For our numerical work we use the set of parameters used in Refs.Hawrylak ; NTTNguyen2 with , , , , , and dielectric constant . The effective Coulomb interaction strength is changed by changing , i.e. which is a measure for the size of the QD, which is typically about tens of angstroms. is taken sufficiently large to guarantee convergency.
III Numerical results
III.1 Cyclotron resonance
The oscillator strength for circular polarized light is given by:
| (5) |
with the transition amplitude for our two-electron system:
| (6) |
The sign refers to right and left circular polarized light. is the cyclotron transition energy for the system from state to state . Clearly, the spins of the electrons and the Mn-ion are not involved in the transition. From expression (6), we see that one of the electrons can transit to a higher (lower) energy level while the other electron can be involved in another transition. Therefore, the wave function part of the other electron can be separated from each term of the Slater determinant while one electron resonates.
We express the Slater determinant (4) in the language of permutations for identical particles: where is one of the permutation operators. equals for symmetric and for anti-symmetric case. The quantum number [e.g. ] and (for electron two) characterize the two electron configuration , and the operator acts on the order of these single electron configurations.
Integrating the right-hand side of Eq. (6) over and , we end up with:
| (7) |
where () and () stand for one electron and () and () for the other electron. The prime indicates the final state . The matrix element was calculated before and was given by Eq. (18) of Ref.Geerinckx .
We use the following Lorentzian broadened formula for the different CR peaks:
| (8) |
where and refer to the initial and final states, respectively. In the following results we concentrate on the transitions where the initial state is the ground state (GS) and we will identify by . is the broadening parameter that is taken to be about meV in our numerical calculations.
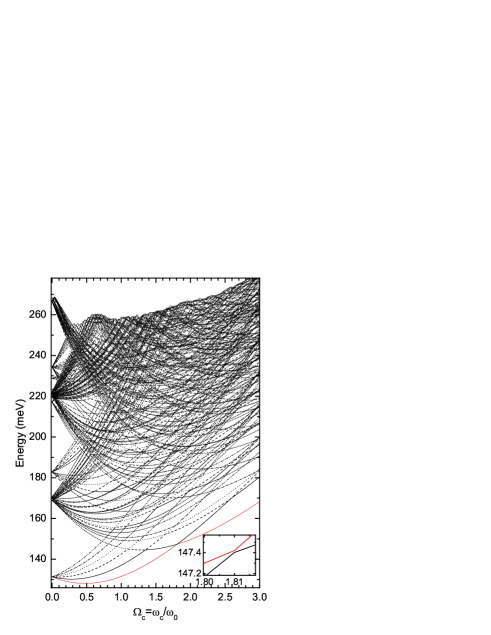
We first calculate the oscillator strength (OS) for the case without and with the presence of the Mn-ion taking into account all allowed transitions of the two electrons. The system with the Mn-ion located at the center of the dot has the energy spectrum as shown in Fig. 1 when the effective Coulomb interaction strength is . Many crossings and anti-crossings are found in the spectrum that were not present in the case without a Mn-ion. The anti-crossings, which are a consequence of intermixing of higher quantum states due to the presence of the Mn-ion, lead to energy gaps between the levels, and result in unusual behaviors in the cyclotron resonance spectrum.
For , the pure ferromagnetic (FM) phase, where the two electrons have spins parallel to the spin of the Mn-ion, does not exist. This is opposite to the case for which is a consequence of the closed orbital for . This results in zero diagonal elements for the e-Mn exchange matrix. The neighboring off-diagonal elements that describe the spin exchange of the electrons with the Mn-ion of the configurations with different and but satisfying const., which are in general very small, now turn to be the main contributions to the exchange interaction energy. Therefore, a “FM” state is still found with a total spin slightly larger than zero. The magnitude of these off-diagonal contributions is small and depends on the position of the magnetic ion. Moving the Mn-ion to other positions inside the QD when the system is still in the “FM” phase can affect the structure of the energy spectrum of the system. With increasing the magnetic field, the system will transit to a phase where the two electrons will have spin-up and are antiferromagnetically attracted to the Mn-ion. This phase is called antiferromagnetic (AFM). The FM-AFM transition can be seen from the inset of Fig. 1 through the anti-crossing between the GS and the second level at . The Mn-ion is always “frozen” with spin projection in case of nonzero magnetic field.
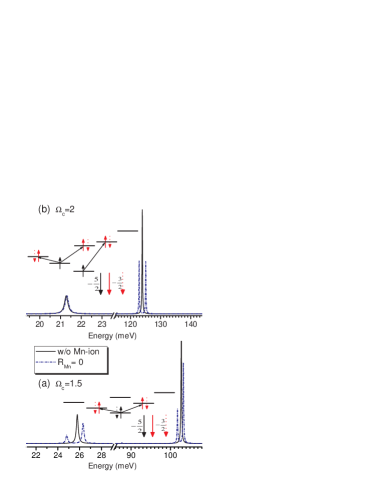
Figs. 2(a) and 2(b) are the magneto-optical absorption spectrum for two values of the magnetic field (FM) and (AFM), respectively, for the system in case without (black solid) and with (blue dash-dot) the presence of the Mn-ion (at the center of the dot). Two schematic diagrams describe possible electron transitions with OS exceeding of the total OS taking place within the , , and shells. When the system is in the FM phase, the main transitions are such that the final state has the quantum numbers (the second peak) or (the fourth peak) as the major configuration and (the first peak) or (the third peak) as the minor configuration, respectively. We recallNTTNguyen1 that the number of CR lines in the case of a single electron quantum dot doped with a Mn-ion when the system is in the FM state is two and the e (spin down)-Mn-ion (spin down) interaction affects the CR spectrum in this state through shifting the cyclotron energy and/or the presence of crossings. The spin exchange interaction becomes stronger when the system is in the AFM state (electron and Mn-ion spin antiparallel) resulting in the presence of more CR lines. However, the major CR lines in this case are two. Let us go back to the current system when it is in the AFM state where we find three major CR lines as can be seen in Fig. 2(b). The first peak is due to an electron transition from the [] orbital to the (0,2) orbital corresponding to the resonance from the GS with major configuration to the final state with major configuration . For the other two pronounced peaks, the one that appears at the smaller transition energy is for the -electron transition to the () and its oscillator strength is slightly larger than the other peak that stands for the electron transition from the (0,1) orbital to the () orbital. Their final states have as dominant configurations and , respectively. The CR transitions that become allowed due to spin exchange have a much smaller oscillator strength than the major transitions and can be neglected. For the case without a Mn-ion, the system transits from the state to the state . Note that if one keeps increasing the magnetic field, the electrons will occupy higher quantum states resulting in the GS wave function having quantum numbers e.g. or , and so on. Consequently, the number of possible CR lines increases.
Here, we will discuss in more detail the transitions resulting from the GS. Note that only two of the three allowed CR lines are observable, namely, the -electron to the [the first solid peak in Fig. 2(b)] and the -electron and the -electron to, respectively, the and the orbital that have the same OS and transition energy [the second solid peak in Fig. 2(b)]. These two coinciding CR lines split in the presence of the Mn-ion as can be seen by the dash-dotted curve where the system is in the AFM state. We note that for [Fig. 2(b)] the first peak corresponding to the transition of the -electron to the orbital has almost the same transition energy in case without and with the Mn-ion. This is due to the zero exchange interaction energy between the and the orbitals when the Mn-ion is located at the center of the dot. The energy difference between these two peaks and the number of spin-exchange CR lines will increase as one moves the Mn-ion away from the center of the QD. We will come back to this point in a later discussion.
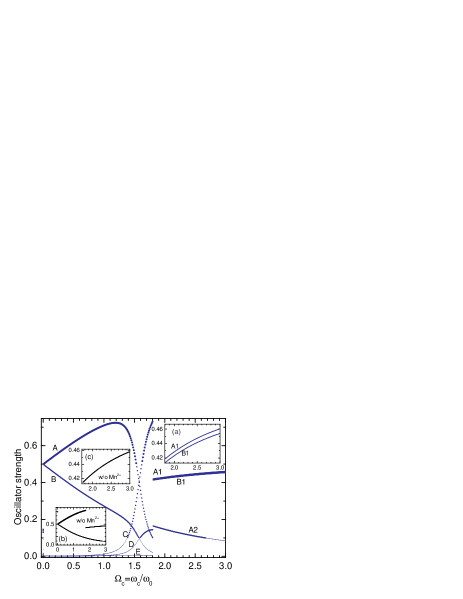
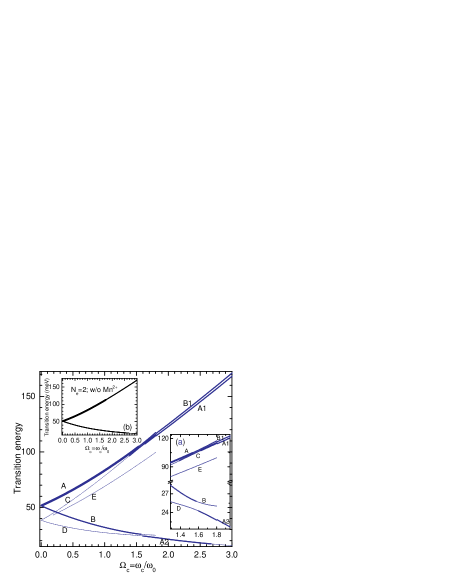
The OS and absorption energy spectrum of the above case over a wide range of magnetic field are found in Fig. 3 and Fig. 4, respectively. For the case without a Mn-ion, these quantities are, respectively, reviewed in the insets (b) and (c) of Fig. 3 and in the inset (b) of Fig. 4. Fig. 4(b) is identical to the case of one-electron QD due to the -independence of the absorption spectrum for parabolic confinement without a Mn-ion. The thickness of the transition absorption energy curves plotted in Fig. 4 is proportional to the OS whose values are plotted in Fig. 3. As we can see from these two plots, the CR transitions for the case when the Mn-ion is present is very different from the case without a Mn-ion. For the magnetic field region where the system is in the FM phase , the differences are significant which can be seen from the presence of the two crossings in the OS in Fig. 3 that correspond to the two anti-crossings in the transition energy in Fig. 4. At the FM-AFM transition point, there are discontinuities. For the AFM region, the difference is in the separation of the two lines that was not present in the case without a Mn-ion as shown, respectively, in Figs. 3(a), 4(a) and Figs. 3(b), 4(b). Note that the discontinuity in the OS of Fig. 3(b) is due to the fact that the CR spectrum transits from two to three lines, where the last two CR lines have the same transition energy (they are the transitions and ). If these OS are added, there would be no discontinuity in Fig. 3(b). Let us first discuss the branches of the OS for the region (before the first crossing) - which we name region I. In this region, the system is in the FM phase. The two electrons mostly stay in the shell with antiparallel spins. The transitions are from the GS to the two orbitals with high OS . The latter are the two higher branches in the OS curve plotted in Fig. 3. The final states, which now mix with several quantum states, include, respectively, (higher) or as their main contribution. We see also two lower branches; that are the curves corresponding to the electron transitions from the GS to the two orbitals but with different spin states. The final states are now such that the electron that is excited to a higher state will flip its spin which is compensated by a change of the Mn-ion spin. We found that the final states corresponding to these CR lines have, respectively, the quantum numbers (higher) and () as their major contribution. This is understood via the e-Mn-ion spin-spin exchange interaction. These two curves have a smaller OS than the above two due to the small contribution of the configuration in the GS while the major one is .
Now we will discuss the results for the higher magnetic field region. At the first crossing, , we observe the exchange between two branches as seen in Fig. 3. The higher branch of the two lower branches is higher in energy than the lower branch of the two higher branches in region I of the OS plot. This is the case up to the next two crossings at . The region is named region II. Within this magnetic field region, the final state which has the configuration as its major contribution to the OS becomes larger in OS as compared to the state which has the configuration . At we find two crossings with an exchange of OS. This is a consequence of the fact that the energy spectrum exhibits crossings (and anti-crossings) of energy levels. Next we consider the AFM phase, , and focus on the two higher branches that stay very close to each other. Remember that for the case without a Mn-ion, these branches are degenerate [as can be seen from Fig. 3(c) and Fig. 4(b)]. In the presence of the Mn-ion, this degeneracy is lifted and and their OS differ about of the total OS and their energy differs by meV or about of the confinement energy . They correspond to transitions of the spin-up electron from the shell to the orbital (lower branch) and of the spin-up electron from the orbital to the orbital as discussed before in Fig. 2, respectively. For these transitions, the Mn-ion spin with is unaltered. The other lower branch corresponds to the transition of the -electron to the orbital. The anti-crossings in the transition energy are illustrated in Fig. 4(a) which magnifies the region .
III.2 Mn-ion position dependence of the intra-band excitation spectrum
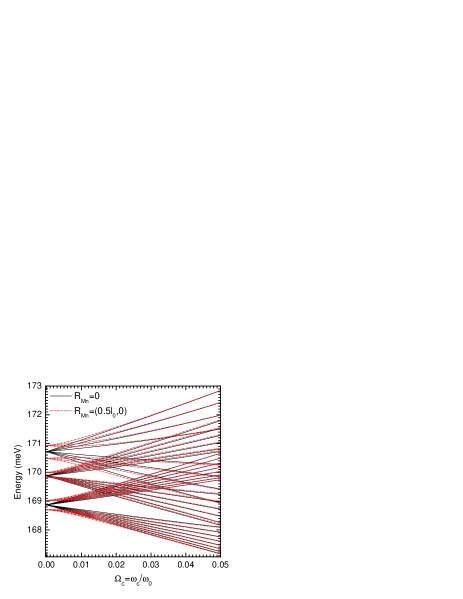
Moving the Mn-ion to another location inside the QD affects the energy spectrum as shown in Fig. 5 where we focus on the small magnetic field region. The black solid lines and the red dashed lines are the energy levels starting from level for the cases that the Mn-ion is located at the center and at , respectively. We first notice that the GS energy in both cases has the same degeneracy (i.e. ). For the higher energy levels different degeneracies are found for we have while for the other case we have fold degeneracy. When applying a magnetic field, these degeneracies are further lifted due to the Zeeman effect. We note that e.g. for the two eightfold-degenerate levels [in the case that the Mn-ion is located at -the red dash-dotted curves] or the two -fold-degenerate-levels (in the case that the Mn-ion is located at the center of the dot-the black solid curves), as the magnetic field increases, the lower energy level corresponds to states with positive total azimuthal quantum number, in this case - one electron in the shell and the other in the orbital and the higher energy level has negative total azimuthal quantum number - one electron in the shell and the other in the orbital, etc. The degeneracy of the higher energy levels for , i.e. , , or , etc, comes from the ferromagnetic (e.g. for the case of eightfold degeneracy) or antiferromagnetic (e.g. for the case of sixfold degeneracy) coupling of the two electrons with the Mn-ion. Note that all the energy levels in Fig. 5 refer to the and orbitals. At higher magnetic fields, the energy spectrum exhibits further differences when is varied in e.g. the number and the positions of the crossings and anti-crossings, the energy gaps of the anti-crossings, etc.
As we discussed above, the system that consists of two electrons and a single Mn-ion does not exhibit a very clear FM phase since the state where the two electrons stay in the shell with antiparallel spins minimizes the GS. The energy gained by the direct antiferromagnetic coupling of the Mn-ion to the spin-up electron is balanced by the ferromagnetic exchange with the other spin-down electron. This holds as long as the two electrons occupy the orbital. Therefore, the FM-AFM transition magnetic field is almost not changed when we vary the position of the Mn-ion. For example, the FM-AFM takes place at for the cases that the Mn-ion is located at the center and at and at for the case the Mn-ion is located at . To see the Mn-ion position dependence on the CR-spectrum, we will focus on the high magnetic field region where the system is in the AFM phase with both electrons having spin up and one of them accommodating a higher orbital e.g. the orbital. The allowed electron transitions now are the three lines that start from the GS to the (for the -electron) and to the and orbitals (for the -electron). Note that for the case that the Mn-ion is located at the center of the dot, the exchange interactions between the and orbitals are zero while these terms increase as the Mn-ion is moved away from the center e.g. to or . Consequently, the behavior of the OS changes. The first transition that corresponds to the transition of the -electron to the orbital is shifted. The other two transitions that stay very close in energy and correspond to the other transitions of the -electron and the -electron to the and orbitals [the solid lines at the right hand side in the diagram in Fig. 2(b)], respectively, are most separated for the case the Mn-ion is located at the center of the QD. The reason is that for , only the exchange interactions between the and the orbitals are nonzero (and equal) within the involved shells , , and . This means that the final state with the configuration of the -electron and the -electron as their main contribution to the wave function is more enhanced in energy. This difference leads to a larger separation between the two CR lines for . Qualitatively, this separation is about meV for and meV for , meV for and almost zero for . In the last case the problem converts to the problem without a Mn-ion. The two transitions merge to a single one as seen before [black curve in Fig. 2(b)].
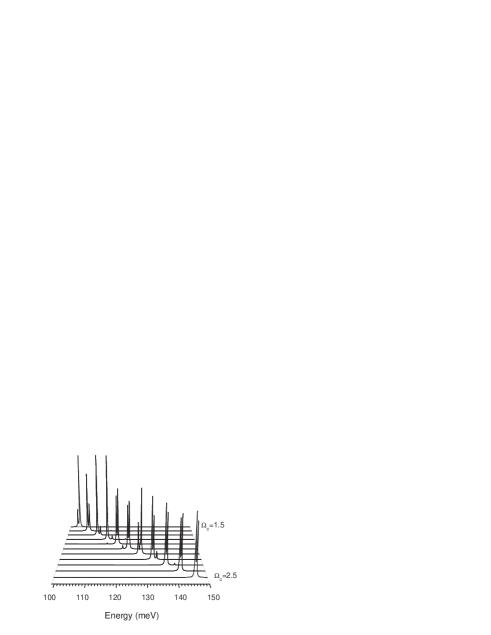
We complete this subsection by investigating the absorption spectrum of the system for in a range of magnetic field that includes the FM-AFM transition [see Fig. 6]. We focus our discussions on the two transitions discussed in the previous paragraph that correspond to the right hand side CR lines in Fig. 2(b). As the system transits to the AFM phase, the “correlations” between the and , and , and , etc, become nonzero for almost all values of the coupling strength. Consequently, the final states of the two transitions gain energy from the exchange interaction part. Their difference reduces leading to the fact that these two peaks stay closer in energy as compared to the case that the Mn-ion is located at the center of the dot. However, the stronger peak (at smaller transition energy) which corresponds to the transition of the -electron when the system is in the AFM phase can become more pronounced or smaller than the other transition as illustrated in Fig. 6. As the system transits to the AFM phase (), we see that within the magnetic field range the peak that corresponds to the transition of the electron to the orbital is higher (having a larger OS) as compared to the other peak that corresponds to the transition of the -electron to the orbital. Within the magnetic field where the OS of the two peaks exchange. This exchange happens again at and we obtain the last exchange in this figure for . Each time that there is an OS exchange between these two peaks there is a crossing in the OS (and an anti-crossing) in the transition energy. When the is displaced to , the difference in the OS value between these two peaks is now larger, but the difference in energy is smaller. Note that also smaller peaks appear next to the main ones. The small peak for is a transition from the GS with dominant configuration which has as a minor contribution, to the state with the configuration as its main contribution to the wave function. For the small peak is due to the transition to the state with the configuration as its main contribution.
III.3 Electron-electron interaction effect
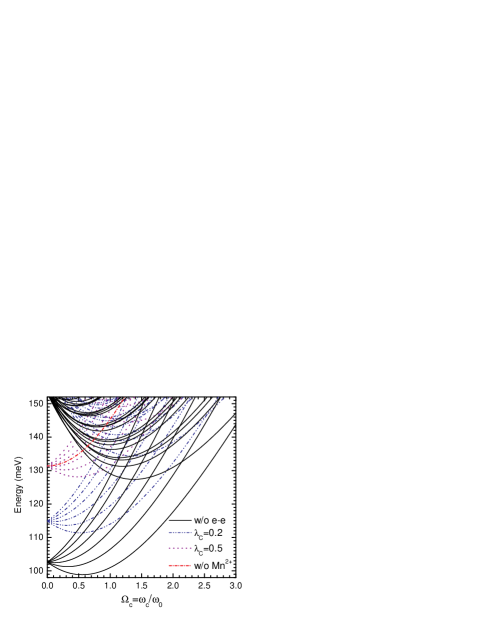
Here we investigate how the strength of the e-e interaction influences the CR absorption spectrum. Its influence on the first energy levels is plotted in Fig. 7 in case without e-e interaction (solid black curves) and two different [ (blue dash-dot-dotted curves) and (violet dash curves)]. Crossings and anti-crossings of these energy levels occur at different magnetic fields (the smaller the larger the crossing field ).
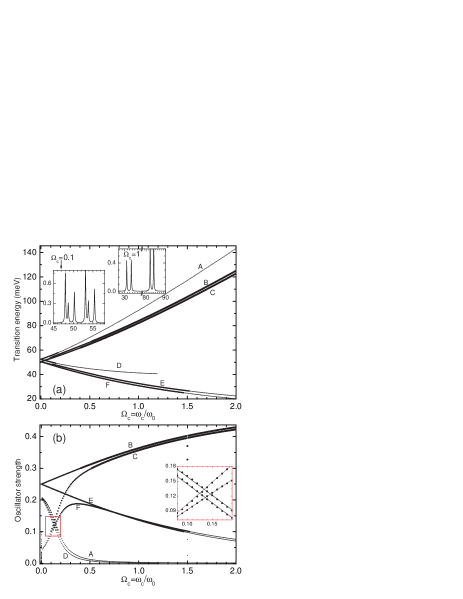
Lets turn to the transition energy and for reference purposes we turn off the Coulomb interaction strength (see Fig. 8). Without the Coulomb interaction, the FM-AFM transition takes place at a larger magnetic field as compared to for the case with e-e interaction (see Fig. 4 and Ref.NTTNguyen2 ). There are generally six CR lines (as compared to four for the case with e-e interaction) with OS exceeding of the total OS [Fig. 8(b)]. The main difference is that the dominant CR lines [conventional transitions e.g. from the GS with the quantum state as the main configuration to the final state with the quantum state ] do not have a much larger OS than the secondary transitions - the transitions appearing as a consequence of the e-Mn-ion exchange interactions, as can be seen from Figs. 3 and 8(b) ( of the total OS). These six lines correspond to transitions of the electrons from the GS containing the major quantum state , to the six final states that contain their dominant contributions to the wave functions as combinations of the following four quantum states: , , , and . Depending on the value of the applied magnetic field, the relative contributions of these states to the wave function will change leading to crossings as seen at , in the inset of Fig. 8(b). If we increase the magnetic field further the CR spectrum collapses into four CR lines. The lines that are the results of the exchange e-Mn-ion interaction (C and F) become close in energy to the “conventional” lines (B and E). This behavior is not seen in case of interacting electrons. The reason is that when the Coulomb interaction is turned on, see Fig. 4, the e-Mn spin-spin interaction is weakened by the Coulomb repulsion. Note that the two additional peaks in the CR spectrum are a consequence of the breaking of the selection rule by the e-Mn exchange interaction.
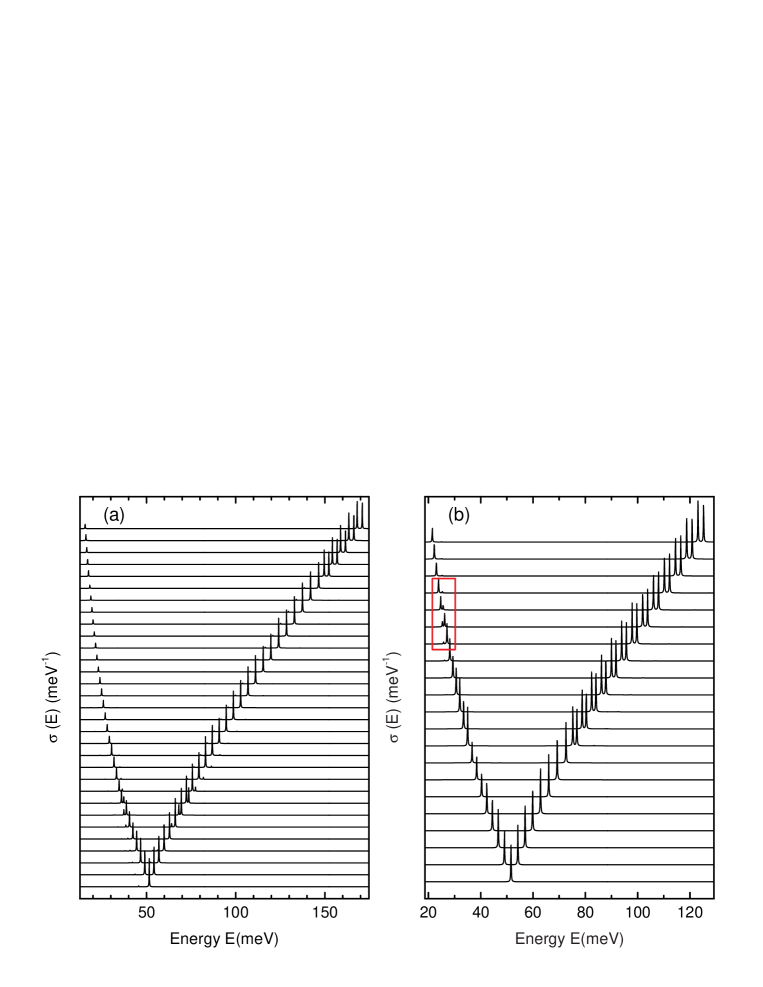
When comparing the low magnetic field behavior (see Figs. 3 and 4) of the CR spectrum we note a very different behavior when we turn off the e-e interaction (see Fig. 8). To understand this different behavior we plot in Fig. 9(a) the magneto-optical absorption spectrum for the system with a Mn-ion located at the center of the dot and for the magnetic field range . As compared to the system studied in Figs. 3 and 4 with : first, the AFM phase takes place at a larger magnetic field ( as compared to ), second, the low OS branches survive up to higher fields. The FM-AFM transition occurs at and , for and , respectively. As the e-e interaction strength increases, e.g. from [see Fig. 9(a)] to [see Fig. 9(b)], the low OS branches that appear due to the spin exchange of the electrons and the Mn-ion contribute less to the total OS. In Fig. 9(a), the contribution of the exchange terms to the total OS stays appreciable within the magnetic field range (FM). The low OS branches appear on both “sides” of the transitions of the -electrons: to the (left - lower transition energy) and to the (right - higher transition energy) orbitals [see the lower peaks of Fig. 9(a)], meaning that the final states with the configurations having as the main contribution have nonzero OS. While these low OS branches appear only on the “side” of the -electron resonating to the orbital within the magnetic field region (1.4,1.7) (AFM), see the red rectangular in Fig. 9(b). It means that only the final state with the main quantum configuration as has a nonzero contribution (as a minor) to the oscillator strength, while there is no gain from the exchange interactions during the transitions of the -electron and the -electron to the and orbitals, respectively. However, in any case, the exchange interactions always separate these two transitions in energy (about of for ), as can be observed in Figs. 9(a) and 9(b), for magnetic field and for and , respectively.
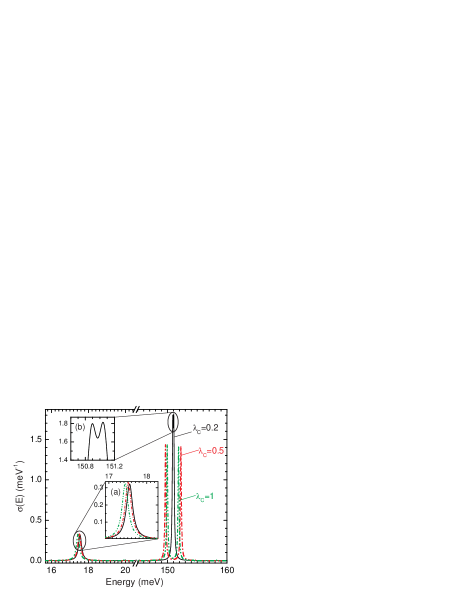
Last, we study the combined effects of the position of the Mn-ion and the Coulomb interaction strength on the CR absorption spectrum. Due to the exchange interactions between all included quantum orbitals, the transitions of the -electron to the orbital and of the -electron to the orbital have different energies depending on the strength of the Coulomb interaction as can be seen in Fig. 10. We plot as a function of energy for three different (=, , and ) at (AFM phase) with the Mn-ion located at . For the smallest considered (i.e. ) the two electrons are more strongly confined and the location of the Mn-ion in this case is almost out of the effective region of the electrons. Consequently, the separation between the two transitions of the electrons in two different orbitals becomes very small as can be seen from the black solid curve in Fig. 10 and its inset. The first transition, the transition of the -electron to the orbital, slightly changes as changes as shown in Fig. 10(a).
IV Summary and Conclusions
We find that the electron transition energy in parabolic quantum dot with a single Mn-ion depends on the strength of the e-e interaction and the number of electrons in the QD. The e-e interaction shifts and splits the two main branches (the upper-energy ones) of the absorption spectrum at the FM-AFM transition magnetic field. The strength of the e-e interaction changes the position of the low OS branches significantly. Different branches appear with changing Coulomb interaction strength.
In a many-electron quantum dot without a Mn-ion the CR spectrum consists of two peaks due to Kohn’s theorem. The reason for the breakdown of Kohn’s theorem is the presence of the Mn-ion, which leads to spin exchange interaction with the electrons of the QD. Moving this Mn-ion to different positions in the QD corresponds to changing the magnitude of the exchange interactions and leads to changes in the absorption energy spectrum.
In the FM region, the spin-spin e-Mn-ion interactions share their contributions to the total OS with the two “direct” transitions of the two -electrons in which the total is conserved. In the AFM region, this leads to discontinuities in the OS and the respective transition energy and separate the two transitions of the - and the -electrons in energy. These two transitions address, respectively, the and orbitals. At the FM-AFM transition magnetic field, we observed that the OS exhibits a discontinuity for all the CR peaks. When the system is in the FM phase, the transition energy exhibits only minor differences as compared to the case without a Mn-ion. When the system is in the AFM phase, however, there are major differences in the absorption energy spectrum. The separation of the two upper peaks in the CR spectrum depends on the effective e-e interaction strength and the position of the Mn-ion. The heights of these two upper peaks change with changing position of the Mn-ion and their relative heights exchange OS at each anti-crossing in the transition energy. The electrons spin-spin exchange with the Mn-ion and the strength of it depends on the position of the Mn-ion. Therefore, changing the Coulomb interaction strength will affect the absorption energy spectrum by e.g. separating or merging the two above electron transitions. When the Mn-ion is moved away from the center of the dot, the exchange interactions become nonzero resulting in additional CR peaks. The number of these branches reduces as the Coulomb interaction strength increases. When the e-e interaction is turned off, we found that the transitions that become allowed due to the spin exchanges increase in OS.
In short, in the FM phase (i.e. low magnetic field situation) the number of CR lines is increased to four for which compares to two lines when . In the AFM phase (i.e. high magnetic field) the number of CR lines with substantial OS is reduced to three while for it was four of which only two had an OS appreciable different from zero. These changes in the CR spectrum should be observable in a CR experiment. The number of electrons in the quantum dot can be varied through the application of a gate potential. In order to resolve the CR lines that are very close to each other it is recommended to use single dot spectroscopy.Besombes ; Leger ; Gall
V Acknowledgments
This work was supported by FWO-Vl (Flemish Science Foundation), the EU Network of Excellence: SANDiE, the Brazilian science foundation CNPq, and the Belgian Science Policy (IAP).
References
- (1) J.K. Furdyna, J. Appl. Phys. 64, R29 (1988).
- (2) L. Besombes, Y. Léger, L. Maingault, D. Ferrand, H. Mariette, and J. Cibert, Phys. Rev. Lett. 93, 207403 (2004).
- (3) Y. Léger, L. Besombes, J. Fernández-Rossier, L. Maingault, and H. Mariette, Phys. Rev. Lett. 97, 107401 (2006); L. Maingault, L. Besombes, Y. Léger, H. Mariette, and C. Bougerol, Phys. Status Solidi C 3, 3992 (2006).
- (4) C. Le Gall, L. Besombes, H. Boukari, R. Kolodka, J. Cibert, and H. Mariette, Phys. Rev. Lett. 102, 127402 (2009).
- (5) A. O. Govorov, Phys. Rev. B 70, 035321 (2004).
- (6) T. Schmidt, M. Scheibner, L. Worschech, A. Forchel, T. Slobodskyy, and L. W. Molenkamp, J. Appl. Phys. 100, 123109 (2006).
- (7) P. Wojnar, J. Suffczyński, K. Kowalik, A. Golnik, G. Karczewski, and J. Kossut, Phys. Rev. B 75, 155301 (2007).
- (8) J. Fernández-Rossier and Ramón Aguado, Phys. Rev. Lett. 98, 106805 (2007); J. Fernández-Rossier, Phys. Rev. B 73 , 045301 (2006).
- (9) K. Chang, J.B. Xia, and F.M. Peeters, Appl. Phys. Lett. 82, 2661 (2003).
- (10) M. M. Glazov, E. L. Ivchenko, L. Besombes, Y. Léger, L. Maingault, and H. Mariette, Phys. Rev. B 75 205313 (2007).
- (11) F. Qu and P. Hawrylak, Phys. Rev. Lett. 95, 217206 (2005).
- (12) N. T. T. Nguyen and F. M. Peeters, Phys. Rev. B 78, 045321 (2008).
- (13) A. O. Govorov, C. R. Physique 9, 857 (2008).
- (14) W. Kohn and J. M. Luttinger, Phys. Rev. 96, 529 (1954); J. M. Luttinger, Phys. Rev. 102, 1030 (1956).
- (15) W. Kohn, Phys. Rev. 123, 1242 (1961).
- (16) F. M. Peeters, Phys. Rev. B 42, 1486 (1990).
- (17) Ch. Sikorski and U. Merkt, Surf. Sci. 229, 282 (1990).
- (18) F. Geerinckx, F. M. Peeters, and J. T. Devreese, J. Appl. Phys. 68, 3435 (1990).
- (19) M Helle, A Harju, and R M Nieminen, New J. Phys. 8, 27 (2006).
- (20) R. J. Nicholas, M. A. Hopkins, D. J. Barnes, M. A. Brummell, H. Sigg, D. Heitmann, K. Ensslin, J. J. Harris, C. T. Foxon, and G. Weimann, Phys. Rev. B 39, 10955 (1989); J. Richter, H. Sigg, K. v. Klitzing, and K. Ploog, Phys. Rev. B 39, 6268 (1989).
- (21) U. Merkt, Phys. Rev. Lett. 76, 1134 (1996).
- (22) P. A. Maksym and T. Chakraborty, Phys. Rev. Lett. 65, 108 (1990)
- (23) A. Wojs and P. Hawrylak, Phys. Rev. B 53, 10841 (1996).
- (24) I. Savić and N. Vukmirović, Phys. Rev. B 76, 245307 (2007).
- (25) N. T. T. Nguyen and F. M. Peeters, Phys. Rev. B 78, 245311 (2008).