-
The Planetary Nebula Luminosity Function: Pieces of the Puzzle
Abstract: Extragalactic surveys in the emission line of [O III] have provided us with the absolute line strengths of large, homogeneous sets of planetary nebulae. These data have been used to address a host of problems, from the measurement of the extragalactic distance scale, to the study of stellar populations. I review our current understanding of the [O III] planetary nebula luminosity function (PNLF), and discuss some of the physical processes that effect its structure. I also describe the features of the H PNLF, a function that, upon first glance, looks similar to the [O III] PNLF, but which includes a very different set of objects. Finally, I discuss recent measurements of , the number of PNe found in a stellar population, normalized to that population’s bolometric luminosity. I show that, contrary to expectations, the values of found in actively star-forming spirals is essentially the same as those measured in late-type elliptical and lenticular systems. I discuss how this result sheds light on the physics of the planetary nebula phenomenon.
Keywords: planetary nebulae: general — galaxies: stellar content — galaxies: distances — blue stragglers
1 Introduction
Photometric surveys for extragalactic planetary nebulae (PNe) are useful for a host of reasons: they produce test particles for studies of galactic kinematics and chemical evolution, they probe facets of stellar evolution that are unobservable with conventional techniques, and they yield unique insights into the properties of Galactic PNe. PN photometry even allows us to measure the extragalactic distance scale to a precision that few other methods can reach. These uses come about because, unlike Galactic samples of PNe, the planetary nebulae of other galaxies are all at the same distance and all have the same amount of foreground reddening. Thus, we have access to the objects’ absolute line-strengths, and, in particular, the planetary nebula luminosity function (PNLF).
The history of the PNLF dates back to the early 1960’s, when Henize & Westerlund (1963) modeled the PNe of the Magellanic Clouds as a set of spherical gas clouds surrounding non-evolving central stars. Under this assumption, the expected Balmer-line flux from a PN should go as
| (1) |
which, when written in terms of magnitudes, yields
| (2) |
Since the number of objects observed between magnitudes and is proportional to the time spent between those magnitudes, the implied luminosity function of Magellanic Cloud PNe is then
| (3) |
Obviously, the above argument grossly oversimplifies the physics of the planetary nebula phenomenon. Most PNe are not spherically symmetric, and their early evolution is governed more by the hydrodynamics of a fast wind/superwind interaction than by simple photoionization and expansion (Kwok 1982; Balick & Frank 2002; Schönberner et al. 2007). As a result, the ionized mass of a young PN should increase with time and produce a distribution of PN luminosities that is flatter than that implied by equation (3). Furthermore, as a PN evolves, its opacity to ionizing photons and its ionization structure may change as well, adding dips and wiggles to the expected form of the PNLF. Yet for all this, the Jacoby (1980) observations of faint PNe in the Large Magellanic Cloud seemed to confirm the simple Henize & Westerlund (1963) law. Although the LMC observations were conducted at 5007 Å, rather than H (since PNe are easier to identify in the [O III] line), the agreement between the observations and the simple theory suggested that much of the complex physics associated with planetary nebulae was not crucial to understanding their faint, late stages of evolution.
The late 1980’s saw the introduction of the [O III] PNLF as an extragalactic standard candle. Surveys of more than two dozen spiral and elliptical galaxies demonstrated that, while the faint-end of the PNLF may be fit by a Henize & Westerlund (1963) exponential, the bright-end of the function truncates abruptly. This led Ciardullo et al. (1989) to propose fitting the PNLF using a cutoff exponential,
| (4) |
where is the absolute luminosity of the brightest possible planetary in a magnitude system defined by
| (5) |
Remarkably, appeared to be virtually independent of stellar population: internal tests within galaxies (e.g., Ciardullo 2003; Hui et al. 1993), internal tests within galaxy groups and clusters (e.g., Ciardullo et al. 1989; Jacoby et al. 1990; Ciardullo et al. 1991), and external tests in galaxies with distances from Cepheid and surface brightness fluctuation measurements (Ciardullo et al. 2002) yielded values of that were consistent to better than . As Figure 1 illustrates, the only systematic trend was a slight fading of at low metallicity – a fading that was entirely consistent with the expected response of a set of nebulae to lower oxygen abundance (Ciardullo & Jacoby 1992; Dopita et al. 1992; Ciardullo et al. 2002).

2 The Faint-End Shape
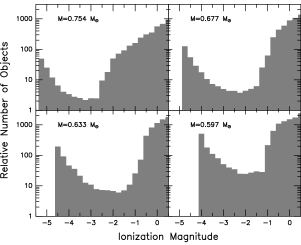
The constancy of means that the bright-end cutoff of the [O III] PNLF contains little or no information about the underlying stellar population. However, the same is not necessarily true for the function’s faint-end shape. As described above, the physics of PN evolution is extremely complicated, and a proper treatment of the problem requires careful hydrodynamical modeling (e.g., Schönberner et al. 2007). Yet at its most fundamental level, PN evolution is controlled by two timescales: one tied to central star evolution, and the other to nebular expansion. If most PNe are powered by low-mass, slowly-evolving central stars, then nebular expansion will dominate and the result will be a luminosity function that monotonically increases towards fainter magnitudes. Conversely, if the majority of central stars are high-mass objects, then their rapid stellar evolution will render nebular expansion unimportant. In this case, the observed PNLF will primarily reflect the evolution of the central star’s ionizing flux, and there will be a deficit of PNe with luminosities near the top of the white-dwarf cooling sequence.
Figure 2 illustrates this effect by translating the post-AGB evolutionary tracks of Vassiliadis & Wood (1994) into a set of mock luminosity functions, under the simplistic assumption that planetary nebulae reprocess ionizing flux into [O III] radiation with 10% efficiency. Obviously, many processes can reduce this factor, and real PNe may evolve quite differently. Nevertheless, more sophisticated analyses bare out the result of this straightforward analysis: populations which are dominated by high core mass PNe must have a dip in their luminosity function (Méndez et al. 2008).
The stars of M31’s bulge have ages of Gyr (Trager et al. 2000). Consequently, from the initial mass-final mass relation (Kalirai et al. 2008), we would expect the region to have PNe with low-mass, slowly evolving central stars. This is indeed the case: the deep [O III] luminosity function of Ciardullo et al. (2002) shows that the population’s PNLF is well-fit by the Henize & Westerlund (1963) law for non-evolving central stars. Conversely, the star-forming populations of the Small Magellanic Cloud (Jacoby & De Marco 2002) and M33 (Ciardullo et al. 2004) should have many high-mass cores that evolve rapidly across the HR diagram. Again, this is what is seen, as the luminosity functions of both systems have a clear deficit of intermediate luminosity objects.
How fast is this transition? In theory, we can constrain this quantity by examining the PNLF in a galaxy where star-formation has ceased in the recent past. Unfortunately, such objects are difficult to identify. One possible location is the envelope of NGC 5128: this interacting elliptical has a blue color that is reminiscent of the inter-arm region of a spiral galaxy, and still contains some evidence of recent star-formation (Rejkuba et al. 2004). As Figure 3 illustrates, a deep planetary nebula survey of the region reveals a PNLF that is identical to that found for M31’s bulge; there is no hint of the mid-magnitude deficit present in the SMC and M33. This suggests that the transition from a central-star driven luminosity function to a nebula-driven luminosity function must occur rather quickly: unless the PN population is dominated by objects from very young progenitors, the Henize & Westerlund (1963) law is the better predictor of the PNLF’s shape.

3 The PNLF in H
Since the brightest PNe emit predominantly in [O III] , it is natural that PN surveys in distant galaxies focus on this wavelength. But other emission lines contain information as well, and for many Galactic surveys, it is the H emission that is most-easily studied. Thus, we should consider the probative value of this brightest Balmer line as well.
Figure 4 displays the H luminosity function for three Local Group galaxies, using an H magnitude defined via
| (6) |
Like the [O III] PNLF, the H luminosity function displays a cutoff that is insensitive to stellar population. The planetaries produced by the old stellar population of M31’s bulge have roughly the same maximum H flux as the PNe created in the star-forming environments of M33 and the Large Magellanic Cloud. Although the cutoff in the H luminosity function is a factor of fainter than that for [O III] , the data do suggest that H measurements of PN ensembles can be used to estimate distance.

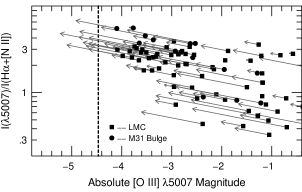
This is not to say that all the PNe that are bright in H are also bright in [O III]. In fact, when compared against the most luminous objects in the [O III] PNLF, H-bright objects are surprisingly inhomogeneous. This can be seen in Figure 5, which gives the [O III] to H+[N II] line ratios of PNe in M31’s bulge, M33’s disk, and throughout the Large Magellanic Cloud. When plotted against [O III] absolute magnitude, the data show excellent consistency at the bright end, as the line-ratios, , populate a wedge in emission-line space defined by
| (7) |
where ergs s-1 in the monochromatic 5007 Å line (Herrmann et al. 2008). All PNe in the top magnitude of the luminosity function have [O III] brighter than H by a considerable amount. Conversely, PNe in the top magnitude of the H PNLF have line ratios that span the entire range observed, from . This scatter, which has been reproduced in the hydrodynamic simulations of Méndez et al. (2008), clearly demonstrates that more than one type of object is contributing to the bright-end of this function.
Figure 5 also illustrates a danger about drawing conclusions from samples of objects selected via a single emission-line. PNe in distant galaxies are typically identified from their flux at [O III] ; consequently, objects that are faint in [O III] but bright in H may not be detected. The result can be a censored dataset. So, while the top panel of Figure 5 is an accurate representation of the distribution of objects in emission-line space, the bottom panel of the figure is seriously incomplete at the faint end. The same is true for the luminosity functions of Figure 4: although the deficits of PNe at faint magnitudes may be real, sample incompleteness is also playing an important role. In the Milky Way, where large samples of PNe are selected via their brightness in H (Parker et al. 2006; González-Solares et al. 2008), this bias will be seen when objects are plotted against their [O III] magnitude.

4 The PNLF and Distances in the Milky Way
Figures 3, 4, and 5 suggest a method of constraining the distances to PNe within the Milky Way. As the figures illustrate, PNe populate a specific region of emission-line space: there is a hard upper limit to a PN’s luminosity, both in [O III] and H. Moreover, objects near the bright-end cutoff of the [O III] luminosity function are all high-excitation objects. Thus the line strengths of a Galactic planetary nebula immediately provide an upper limit to distance. For example, a PN which is twice as bright in H than in [O III] cannot be any brighter than .
Unfortunately, such relations are of limited use. Like all objects, PNe are affected by extinction along the line-of-sight. This extinction has two components: one from the foreground dust of the Milky Way Galaxy, and the other from circumstellar material. The effects of the former have to be removed, since the dust is totally unrelated to the planetary. Conversely, the latter extinction must remain untouched, as it is an integral part of the planetary nebula phenomenon. Indeed, as Figure 6 illustrates, circumstellar extinction helps define the PNLF cutoff: without this dust, many of the PNe observed in the Large Magellanic Cloud and M31 would be substantially brighter than . Thus, if one wants to use PN line strengths as a distance indicator, one has to somehow separate the Galactic and circumstellar components of extinction.
5 The PNLF’s Normalization
An under-appreciated component of the PNLF is its normalization. According to the theory of stellar energy generation, all non-star forming stellar populations should create PNe yr, regardless of the system’s age, metallicity, or initial-mass function (Renzini & Buzzoni 1986). Therefore, if one has an estimate for the mean PN lifetime, that age can immediately be translated into an expected number of observable planetaries. Any departure from this number provides a constraint on the timescale of the PN phase and/or the importance of alternative channels of stellar evolution.
To perform this experiment, one needs to estimate , the number of PNe divided by the total bolometric luminosity of the underlying stellar population. This presents two problems. First, one has to translate broadband measurements of a galaxy’s flux into total bolometric luminosity. This is not as difficult as it sounds: the PNLF provides the galaxy’s distance, and the population’s bolometric correction can be assumed to be B.C. , independent of its age or metallicity (Buzzoni et al. 2006). Second, one can never observe the entire PN population of a distant galaxy: typically, one only counts objects in the top mag of the luminosity function. Thus, extragalactic PN surveys usually quote or , i.e., the normalized number of PNe in the top 0.5 or 2.5 mag of the luminosity function. To obtain the total PN population, this value has to be extrapolated over a range of at least 5 or 6 magnitudes.
For example, in their 1989 survey of the Leo I Cloud, Ciardullo et al. (1989) found values of PNe for three different galaxies. They then extrapolated this value to using the Henize & Westerlund (1963) law, and assumed a timescale for the PN phenomenon of yr Pottasch (1984). The result was a stellar death rate that was surprisingly close to the theoretical value for single stars.
Unfortunately, the true situation is a bit more complicated. Ciardullo et al. (2005) have presented values of for elliptical and lenticular galaxies. As the left-hand panel of Figure 7 demonstrates, early-type systems typically have one bright PN (i.e., within 0.5 mag of ) for every of bolometric light, with redder galaxies trending towards lower values of , and bluer systems approaching the theoretical limit mentioned above. But remarkably, recent measurements of in the disks of late-type spirals have produced values of in this same range, between 1 and PNe (Herrmann et al. 2008). At first glance, the agreement between these numbers seems extraordinary.

There are several factors which must be considered before interpreting this result. The first, of course, is that much of a spiral galaxy’s luminosity comes from an extremely young stellar population that does not produce planetary nebulae. Specifically, if a galaxy has been producing stars at constant rate over a Hubble time, then, according to the models of Bruzual & Charlot (2003), roughly half of its bolometric light should come from populations formed less than years ago. The luminosity from these young stars should dilute the galaxy’s PN-to-light ratio, and cause our measurement of to be lower than what would otherwise be predicted.
On the other hand, estimates of the total PN population require an extrapolation. For simplicity, this is usually performed by integrating a a fit to equation (4). However, as Figure 3 shows, star-forming systems have a deficit of objects at intermediate magnitudes; if one integrates the SMC’s PNLF found by Jacoby & De Marco (2002), then one obtains a total PN population that is times less than that derived from the exponential law. Observations of the brightest planetaries in late-type systems will therefore overestimate the total number of PNe present in the galaxy. Fortuitously, this error is of the same order of magnitude as the luminosity dilution and works in the opposite direction. Thus, the observe values of should probably not deviate very strongly from their nominal value.
Interpreting the values of seen in elliptical galaxies is harder. PNe at the bright-end cutoff of the [O III] PNLF emit monochromatically at 5007 Å, and according to both models and observations, no more than of the central star’s flux can come out in this line (e.g., Jacoby 1989; Marigo et al. 2004; Schönberner et al. 2007). Thus, the central stars of [O III]-bright PNe must be more luminous than ; in fact, in M31’s bulge, 3 out of the 12 PNe analyzed by Jacoby & Ciardullo (1999) have central star luminosities in excess of . This is a problem, since in order to generate , a central star has to have a core mass of at least (Vassiliadis & Wood 1994). Cores as massive as this require high-mass (young) progenitors (Kalirai et al. 2008), and such objects do not exist in elliptical and lenticular systems.
There are two ways around this problem. The first is to hypothesize that objects at the bright-end of the [O III] PNLF are not PNe at all, but rather some sort of symbiotic star (Soker 2006). Such a solution solves the luminosity problem at the expense of continuity: why should such objects have the same maximum luminosity and same luminosity function normalization as normal planetary nebulae? The alternative is to invoke a new channel of stellar evolution involving binary stars. Binary interactions on the red giant or asymptotic giant branches are unlikely to be the answer, since these encounters tend to truncate the stellar evolution process before the creation of a massive core (Iben & Livio 1993). However, encounters on the main sequence, either through conservative mass-transfer between primordial close binaries (McCrea 1964) or through the dynamical evolution of triple systems (Perets & Fabrycky 2009) can create field blue straggler stars, and, as Ciardullo et al. (2005) have pointed out, blue stragglers have the proper number, core properties, and evolutionary timescales to evolve into [O III]-bright planetaries. In fact, if this scenario is correct, and the Kozai (1962) cycle-tidal friction process is responsible for creating blue straggler stars, then many of the brightest PNe we observe should have wide-binary companions (Perets & Fabrycky 2009).
How important is the contribution of blue straggler descendents to the PNLFs of elliptical galaxies? This is difficult to calculate, due to uncertainties in the initial mass-final mass relation at the low-mass end. However, if we assume that old stellar populations are capable of producing cores, and that these cores can, at best, convert ionizing radiation into [O III] flux with 10% efficiency, then PNe from single stars can, theoretically, reach . If the [O III] PNLF extends mag, then this implies that the brightest of planetary nebulae must come from an alternative channel of evolution.
6 Prospects and Difficulties
Over the years, attempts to model the PNLF have grown more and more sophisticated. Simple static models based on arbitrary distributions of central star masses (Jacoby 1989) have been replaced by simulations which use realistic galactic star-formation histories (Marigo et al. 2004) and hydrodynamic star-nebular interactions (Méndez et al. 2008). These analyses have had some success. By including the effects of metallicity on the nebula, Dopita et al. (1992) were able to reproduce the fading of the PNLF cutoff in metal-poor populations (Ciardullo et al. 2002). Similarly, the hydrodynamical models of Méndez et al. (2008) have been able to accurately mimic the shape of the PNLF in young stellar systems, as well as the distribution of PNe in [O III] -H+[N II] emission line space.
The trouble comes when trying to model the behavior of the PNLF with age. Dopita et al. (1992) and Méndez et al. (2008) both limited their analyses to the actively star-forming populations of the Magellanic Clouds, with good reason. When considering single-star evolution, no reasonable initial mass-final mass relation can create the high mass cores needed to power planetaries. This is illustrated vividly by the simulations of Marigo et al. (2004): if the PNLF were populated solely by the remnants of single-stars, would fade by mag in the first Gyr after the cessation of star formation. Clearly in order to reproduce the observed PNLF of old stellar systems, another channel is needed to create PNe with relatively high mass () cores.
Another problem with current PNLF modeling efforts is that none include the effects of circumstellar extinction. Most PNe are surrounded by a circumstellar envelope of neutral gas and dust, and, as Figure 6 illustrates, the extinction associated with this dust is an important contributor to the PNLF’s cutoff. In star-forming systems, a typical [O III] bright planetary will be extinguished by mag (Herrmann & Ciardullo 2009), and reddening values two to three times this number are not uncommon (e.g., Meatheringham & Dopita 1991a, b). A similar range of extinctions have been derived for the PNe of M31’s bulge and M32 (Richer et al. 1999; Jacoby & Ciardullo 1999), thus demonstrating that even in old systems, the effect of dust on the PNLF cutoff cannot be neglected. Of course, because extinction estimates for statistically complete sets of extragalactic PNe are difficult to obtain, fully de-reddened PNLFs are not yet available to confront the models. Fortunately, this will soon change with the publication of the results from the MASH survey of the LMC (Reid & Parker 2009).
Finally, the PNLF models to date have all ignored the information contained in the PNLF’s normalization. A full description of the PNLF must not only explain its shape, but also the lower values of observed in large, metal-rich elliptical galaxies, and the similarity between the values of spheroid and disk populations. This may turn out to be the most difficult challenge of all, if, as currently suggested, there is more than one scenario for planetary nebula formation.
7 Conclusion
Most of the data on extragalactic PNe comes from observations in the [O III] emission line at 5007 Å. But the [O III] PNLF is just a single one-dimensional projection of a more complicated function that distributes objects throughout a multi-dimensional phase-space that includes, for instance, H, H, continuum emission at 4.5, 5.8, and 8.0 m, and the emission-line strengths of nitrogen, sulfur, neon, argon, and helium. Figure 4 displays a different one-dimension projection onto an axis which plots H, while Figure 5 shows a pair of two-dimensional projections onto planes which include the ratio of [O III] to H. A fully successful model of the PNLF needs to not only reproduce these projections, but also make predictions about the distribution of PNe in other phase-space dimensions. Similarly, the large homogeneous surveys now being performed in the Galaxy and the Magellanic Clouds have the potential to populate this PN phase space diagram as never before. The resulting confrontation between theory and observations is sure to generate new insights into the planetary nebula phenomenon.
Acknowledgments
We would like to thank the organizers of the MASH workshop for supporting this review, and the anonymous referee for excellent comments on the first draft of this text. The work was supported by NSF grant AST 06-07416.
References
- Balick & Frank (2002) Balick, B., & Frank, A. 2002, ARA&A, 40, 439
- Bruzual & Charlot (2003) Bruzual, G., & Charlot, S. 2003, MNRAS, 344, 1000
- Buzzoni et al. (2006) Buzzoni, A., Arnaboldi, M., & Corradi, R.L.M. 2006, MNRAS, 368, 877
- Ciardullo (2003) Ciardullo, R. 2003, in Lecture Notes in Physics: Stellar Candles for the Extragalactic Distance Scale, ed. W. Gieren & D. Alloin (Heidelberg: Springer-Verlag), 243
- Ciardullo et al. (2004) Ciardullo, R., Durrell, P.R., Laychak, M.B., Herrmann, K.A., Moody, K., Jacoby, G.H., & Feldmeier, J.J. 2004, ApJ, 614, 167
- Ciardullo et al. (2002) Ciardullo, R., Feldmeier, J.J., Jacoby, G.H., de Naray, R.K., Laychak, M.B., & Durrell, P.R. 2002, ApJ, 577, 31
- Ciardullo & Jacoby (1992) Ciardullo, R., & Jacoby, G.H. 1992, ApJ, 388, 268
- Ciardullo et al. (1989) Ciardullo, R., Jacoby, G.H., & Ford, H.C. 1989, ApJ, 344, 715
- Ciardullo et al. (1989) Ciardullo, R., Jacoby, G.H., Ford, H.C., & Neill, J.D. 1989, ApJ, 339, 53
- Ciardullo et al. (1991) Ciardullo, R., Jacoby, G.H., & Harris, W.E. 1991, ApJ, 383, 487
- Ciardullo et al. (2005) Ciardullo, R., Sigurdsson, S., Feldmeier, J.J., & Jacoby, G.H. 2005, ApJ, 629, 499
- Dopita et al. (1992) Dopita, M.A., Jacoby, G.H., & Vassiliadis, E. 1992, ApJ, 389, 27
- Ferrarese et al. (2000) Ferrarese, L., et al. 2000, ApJS, 128, 431
- González-Solares et al. (2008) González-Solares, E.A., et al. 2008, MNRAS, 388, 89
- Henize & Westerlund (1963) Henize, K.G., & Westerlund, B.E. 1963, ApJ, 137, 747
- Herrmann & Ciardullo (2009) Herrmann, K.A., & Ciardullo, R. 2009, ApJ, 703, 894
- Herrmann et al. (2008) Herrmann, K.A., Ciardullo, R., Feldmeier, J.J., & Vinciguerra, M. 2008, ApJ, 683, 630
- Hui et al. (1993) Hui, X., Ford, H.C., Ciardullo, R., & Jacoby, G.H. 1993, ApJ, 414, 463
- Iben & Livio (1993) Iben, I., Jr., & Livio, M. 1993, PASP, 105, 1373
- Jacoby (1980) Jacoby, G.H. 1980, ApJS, 42, 1
- Jacoby (1989) Jacoby, G.H. 1989, ApJ, 339, 39
- Jacoby & Ciardullo (1999) Jacoby, G.H., & Ciardullo, R. 1999, ApJ, 515, 169
- Jacoby et al. (1990) Jacoby, G.H., Ciardullo, R., & Ford, H.C. 1990, ApJ, 356, 332
- Jacoby & De Marco (2002) Jacoby, G.H., & De Marco, O. 2002, AJ, 123, 269
- Kalirai et al. (2008) Kalirai, J.S., Hansen, B.M.S., Kelson, D.D., Reitzel, D.B., Rich, R.M., & Richer, H.B. 2008, ApJ, 676, 594
- Kozai (1962) Kozai, Y. 1962, AJ, 67, 591
- Kwok (1982) Kwok, S. 1982, ApJ, 258, 280
- Marigo et al. (2004) Marigo, P., Girardi, L., Weiss, A., Groenewegen, M.A.T., & Chiosi, C. 2004, A&A, 423, 995
- Méndez et al. (2008) Méndez, R.H., Teodorescu, A.M., Schönberner, D., Jacob, R., & Steffen, M. 2008, ApJ, 681, 325
- McCrea (1964) McCrea, W.H. 1964, MNRAS, 128, 147
- Meatheringham & Dopita (1991a) Meatheringham, S.J., & Dopita, M.A. 1991, ApJS, 75, 407
- Meatheringham & Dopita (1991b) Meatheringham, S.J., & Dopita, M.A. 1991, ApJS, 76, 1085
- Parker et al. (2006) Parker, Q.A., et al. 2006, MNRAS, 373, 79
- Perets & Fabrycky (2009) Perets, H.B., & Fabrycky, D.C. 2009, ApJ, 697, 1048
- Pottasch (1984) Pottasch, S.R. 1984, in Planetary Nebulae - A Study of Late Stages of Stellar Evolution (Dordrecht: Reidel), 215
- Reid & Parker (2009) Reid, W.A., & Parker, Q.A. 2009, MNRAS, in preparation
- Rejkuba et al. (2004) Rejkuba, M., Greggio, L., & Zoccali, M. 2004, A&A, 415, 915
- Renzini & Buzzoni (1986) Renzini, A., & Buzzoni, A. 1986, in Spectral Evolution of Galaxies, ed. C. Chiosi & A. Renzini (Dordrecht: Reidel), 195
- Richer et al. (1999) Richer, M.G., Stasińska, G., & McCall, M.L. 1999, A&AS, 135, 203
- Schönberner et al. (2007) Schönberner, D., Jacob, R., Steffen, M., & Sandin, C. 2007, A&A, 473, 467
- Soker (2006) Soker, N. 2006, ApJ, 640, 966
- Trager et al. (2000) Trager, S.C., Faber, S.M., Worthey, G., & González, J.J. 2000, AJ, 119, 1645
- Vassiliadis & Wood (1994) Vassiliadis, E., & Wood, P.R. 1994, ApJS, 92, 125