Constraints on Star Forming Galaxies at from HAWK-I -band Imaging of GOODS-South
Abstract
We present the results of our search for high-redshift Lyman-break galaxies over the GOODS-South field. We use HST-ACS data in , , & , VLT-ISAAC and , Spitzer-IRAC 3.6, 4.5, 5.8 and 8.0 data in conjunction with the new HAWK-I -band science verification data to search for dropout galaxies in the redshift range . We survey arcmin2 to (), of which arcmin2 reaches . Candidate and drop-outs were selected on the basis of a colour cut of mag and mag respectively. We find no robust Y-drops () brighter than . In our search for -band dropouts (), we identify four possible candidates, two with -drop colours and clear Spitzer-IRAC detections and two less likely candidates. We also identify two previously-known Galactic T-dwarf stellar contaminants with these colours, and two likely transient objects seen in the -band data. The implications if all or none of our candidates are real on the Ultra-Violet galaxy luminosity functions at are explored. We find our number of -drop candidates to be insufficient based on the expected number of drops in a simple no-evolution scenario from the Lyman-break galaxy luminosity function but we are consistent with the observed luminosity function at (if all our candidates are real). However, if one or both of our best -drop candidates are not galaxies, this would demand evolution of the luminosity function at early epochs, in the sense that the number density of ultra-violet luminous star-forming galaxies at is less than at . We show that the future surveys to be conducted with the ESO VISTA telescope over the next five years will be able to measure the bulk of the luminosity function for both and drop-outs and thus provide the strongest constraints on the level of star-formation within the epoch of reionization.
keywords:
galaxies: evolution – galaxies: formation – galaxies: starburst – galaxies: high redshift – ultraviolet: galaxies1 Introduction
The identification of high-redshift galaxies is crucial to developing our understanding of the early universe, galaxy evolution and the epoch of reionisation. One technique for selecting high-redshift galaxies is to search for Lyman Break Galaxies (LBGs) through the drop-out technique (Guhathakurta, Tyson & Majewski 1990; Steidel, Pettini & Hamilton 1995; Steidel et al. 1996). This relies on finding a significant flux decrement between two broadband filters indicating a spectral break short-ward of Lyman- at 1215.7Å in the rest frame of the galaxy, attributable to Lyman- absorption from intervening clouds of neutral hydrogen at lower redshifts (the Lyman- forest). In higher-redshift galaxies this “Lyman break” is pushed to longer wavelengths.
Recent years have witnessed two key developments in our understanding of the initial phases of galaxy formation. The first is the extension of the Lyman-break selection technique to higher redshifts, so that broad-band colours can be used to identify galaxies at (Stanway, Bunker & McMahon 2003; Bunker et al. 2004). The Lyman-break “-drop” selection has been spectroscopically confirmed to find galaxies at (Bunker et al. 2003; Stanway et al. 2007). The second key development is the revelation that is a crucial transition epoch in the history of the Universe. The discovery of complete absorption by the Lyman- forest (the Gunn-Peterson trough) in the spectra of quasi-stellar objects (QSOs) at (Becker et al. 2001, Fan et al. 2002) indicates a large neutral fraction of hydrogen, and the Wilkinson Microwave Anisotropy Probe (WMAP) results suggest that the Universe was entirely neutral at (Kogut et al. 2003) with a protracted period of reionization (Dunkley et al. 2009). Hence, exploring the epoch is crucial if we are to understand what reionized the Universe, and thus set the stage for galaxy formation at the end of the “Dark Ages”. Specifically, ultra-violet (UV) light from star forming galaxies during this era has been proposed as the most likely reionization mechanism, as the number density of high-redshift active galactic nuclei (AGN) appears too low to be solely responsible (e.g. Dijkstra et al. 2004).
Only a handful of galaxies are known at (Bouwens et al. 2005, 2008; Ota et al. 2008), selected through Lyman-break broad-band imaging and also narrow-band imaging for Lyman- line emitting galaxies. The highest redshift spectroscopically confirmed galaxy currently known was discovered by Iye et al. (2006) at and the highest redshift object is the gamma-ray burst found at (Tanvir et al. 2009). The frontier in spectroscopically confirmed galaxies and large robust samples of Lyman Break galaxies is currently . The data from the new VLT HAWK-I camera (Pirard et al., 2004; Casali et al., 2006) in the -band filter in conjuction with the availability of ISAAC images over most of the ACS/WFC GOODS-South area enables us to push this work even further in lookback time and to explore the redshift range . Constraints have also been placed on the Ultra Violet luminosity function at by Mannucci et al. (2007).
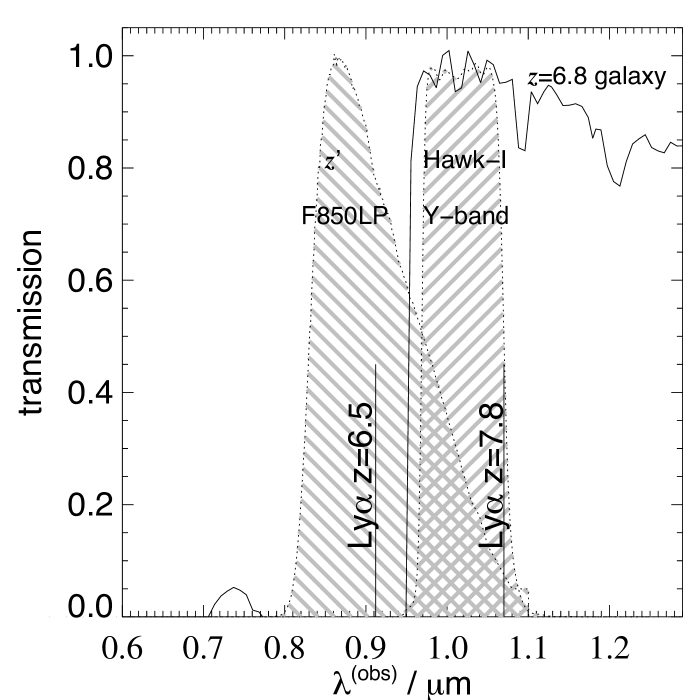
To explore this population further we need a large sample of these galaxies. This has been hampered until now by a lack of sensitivity in the infra-red and the small fields of view available. Now with HAWK-I, an instrument with a large field of view (7.5 x 7.5 arcmin2) on the VLT, an 8-metre class telescope and critically with the -band filter, we can begin to increase the number of Lyman Break candidates at . The -band filter is particularly important because it is a good discriminant of spectral breaks (a sharp cutoff) as opposed to dust reddening, which appears as a more gradual slope, as it is centered on m which is close in wavelength to the filter’s peak transmisison wavelength of m (see Figure 1). The -band filter is also currently being used by UKIRT Infrared Deep Sky Survey (UKIDSS; Lawrence et al. 2007) to search for QSOs at similar epochs (e.g. Venemans et al. 2007).
The structure of the paper is as follows. In Section 2 we describe the imaging data. The construction of our catalogues, survey completeness, our and -drop selection and the likely contaminants are discussed in Section 3. In Section 4 we discuss our candidates and infer constraints on the rest-frame UV luminosity function of star-forming sources. Our conclusions are presented in Section 5. Throughout we adopt the standard “concordance” cosmology of , , and use . We use the magnitude system throughout (Oke & Gunn 1983).
2 Observations and Data Reduction
We analysed -band observations from the ESO/VLT archive obtained as part of HAWK-I science verification program 60.A-9284(B) (Fontana et al. and Venemans et al. – “A deep infrared view on galaxies in the early Universe”). Two areas within the GOODS-South field were imaged, with centres 03:32:41.0 27:51:45 (pointing 1) and 03:32:29.6 27:44:37 (pointing 2, both J2000). The seeing in -band was in the range (FWHM) in the individual exposures, with the stacked image having seeing of .
Individual exposure times were 30 seconds, with 10 such exposures averaged to form a single co-added frame of 300 seconds. A typical sequence was 12 exposures (1 hour), although we used sequences with between 6 and 13 exposures. The telescope was dithered by 5-10′′ between exposures. There were 18 sequences in pointing 1 (comprising 195 frames in all, a total of 16.25 hours), and 14 towards pointing 2 (comprising 138 frames, amounting to 11.5 hours).
The HAWK-I camera was read out in 4 quadrants, each of pixels with a scale pixel-1, and initially these quadrants were reduced individually before final mosaiking. We subtracted the dark current and flat-fielded the data using the average of -band twilight sky flats from the ESO HAWK-I archive. For each sequence of 12 exposures, we then used the DIMSUM package within IRAF to background-subtract the sky, using the xmosaic task. We measured the image shifts interactively using a number of compact, bright but unsaturated sources. Where there were 12 frames in a sequence, we used the average of the 5 frames before and 5 after (with objects masked) to determine the sky level. DIMSUM also rejected many of the cosmic rays present in the images. However, there were various electronic read-out artifacts visible which were pernicious and not removed by DIMSUM. Hence when we combined the 14–18 final frames output by DIMSUM, we used IRAF.imcombine, weighting by the exposure time, with the ccdclip rejection algorithm, using the gain and readnoise properties of the detector and the Poisson noise of the sky background. A detector artifact which was not effectively eliminated by this rejection was a cross-talk effect, whereby ghost images appeared in the same detector row as bright objects. As the apparent spatial position of the cross talk artifacts on the sky remains fixed with respect to the objects (i.e. it moves with the objects on the detector during the dithering pattern), this was not rejected in the co-addition. We eliminated this later by visual inspection and by masking detector rows affected by bright objects.
For each quadrant and for both pointings we then determined the astrometry through comparison with the ESO ISAAC -band image (Retzlaff et al. in prep.) 111We used version 2 – available from http://archive.eso.org/archive/adp/GOODS/ISAACimagingv2.0 using 60–110 objects in each quadrant. A quadratic fit to the distortion produced residuals of between the coordinates in the - and -band images. The iraf.wregister routine was used to linearly interpolate the -band images to map on to the same pixel grid as the -band, with a pixel scale of .
We summed the exposure maps output by DIMSUM using the same measured shifts, creating a map of the total exposure time as a function of position on the sky, and correcting the astrometric distortions as described above. This was then used to inverse-variance weight the images when we combined the four quadrants in both pointings to form a final image mosaic. The 119 arcmin2 of the -band image covered most of the ESO -band and HST ACS GOODS images (97.5% of the HAWK-I -band image overlapped with the ESO -band). We used the GOODS team reductions of the ACS images (Giavalisco et al. 2004), consisting of F450W -band, F606W -band, F775W -band and F850LP -band. The GOODS images had been drizzled from the original ACS pixel scale of on to a grid of pixels. We used version 2.0 of the ACS GOODS images222The GOODS ACS v2 images are available at http://archive.stsci.edu/pub/hlsp/goods/v2/ and adopted the AB magnitude zeropoints re-determined for the v2 release.
At the time of writing, the formal -band zero point for HAWK-I was not available, so we determined the photometric zero point of the -band by measuring the colours of objects in identical apertures of 1 arcsec diameter, and setting the average AB colour of sources with flat spectra between the and -band to be zero. Using our computed zero point, the AB magnitude in the -band is given by
where “ap corr” is the aperture correction in magnitudes, and “count rate” is the number of counts per second recorded. We determined the aperture correction using a 1 arcsec-diameter aperture to be mag for compact but unsaturated sources (see Section 3.1).
The detection limit for a compact source in a 1 arcsec-diameter aperture is mag, however pointing 1 is slightly deeper and reaches mag (). In all, we survey to a maximum depth of , and an area of to . The total area surveyed to was .
In order to identify -band and -band drop-outs through their extreme or colours, we compare the HAWK-I -band image with the GOODS team -band and -band images (taken with VLT-ISAAC and HST-ACS respectively). The limiting magnitudes in GOODS ACSv2 measured in diameter apertures are , , and . We block-averaged the drizzled ACS pixels to produce a -band frame which was registered to the VLT/ISAAC -band. The limiting magnitudes in apertures for the VLT-ISAAC images are and ( AB magnitudes). We also made use of imaging of the GOODS-South field obtained with the Infrared Array Camera (IRAC; Fazio et al. 2004) on board the Spitzer Space Telescope which was conducted as part of the GOODS Legacy program (PID 194, PI Dickinson). IRAC uses four broad-band filters with central wavelengths at approximately 3.6m, 4.5m, 5.8m and 8.0m (channels 1–4). The data were taken over two observing epochs, with the telescope roll angle differing by , and we used the v2 and v3 reductions of the GOODS team, with the data drizzled onto a grid from the original pixels. We measure 5 limiting magnitudes of 24.76, and 24.87 for IRAC channels 1 and 2 respectively, measured in diameter apertures, and 22.77 and 22.81 for IRAC channels 3 & 4 measured in & diameter apertures respectively (these limits include aperture corrections of mag appropriate for unresolved sources, e.g. Eyles et al. 2005; 2007).
3 Selection of -drop and -drop Candidates
3.1 Construction of Catalogues
Candidate selection for all objects in the field was performed using version 2.4.6 of the SExtractor photometry package (Bertin & Arnouts 1996). As we are searching specifically for objects which drop-out at short wavelengths through the Lyman- forest absorption, we used SExtractor in dual-image mode, detecting objects in the longer-wavelength band and measuring the photometry within the same spatial apertures in the drop-out band(s). We produced separate catalogues for the -band drop outs (using the -band as the detection image) and the -band drop-outs (using the -band as the detection image). To reduce the number of spurious sources in the noisy edge regions (where few frames overlap) we used the exposure maps as input weight maps for SExtractor. For object identification, we adopted a limit of at least 5 contiguous pixels above a threshold of per pixel (on the data drizzled to a scale of 015 pixel-1). Spurious detections close to the noise limit were later eliminated through colour cuts and visual inspection.
As high redshift galaxies in the rest-UV are known to be compact (e.g., Ferguson et al. 2004; Bouwens et al. 2004), we used fixed circular apertures in diameter to select our candidates and corrected the aperture magnitudes to approximate total magnitudes for each filter through an aperture correction, determined from bright compact sources. These were measured to be 0.07 mag in -band, 0.4 mag in -band and 0.4 mag in -band. For compact sources, this approach is simpler and more reproducible than using the SExtractor curve-of-growth total magnitudes.
Section 9 in the version 2.0 of the ISAAC -band image produced a number of spurious sources when running SExtractor in dual image mode and weighting on the exposure map. This appeared to be due to an overconfidence in the weight map on section 9. This was corrected for by weighting on the background for this section alone and using the weight map for the rest of the -band image.
3.2 Completeness
The completeness corrections for both the and the -band images were measured in the following way. Approximately 5000 artificial compact sources were created with diameters of 3 pixels and spanning magnitudes between 20 and 30. These objects were then convolved with the PSF and added in to the original image. The new images were run through SExtractor again, using the same criteria that was employed to generate our object list. The resulting catalogues were compared with the list of input ’fake’ sources and a detection was considered to be made if a source was found within 5 pixels of its input position and had a magnitude correct to within a factor of 2 of the input flux. The number of detected sources was then compared to the number of input sources for each magnitude bin.


As described earlier, the -band image consisted of two individual pointings of unequal depth, to measure an accurate completeness limit, the calculations were determined for both pointings separately. The filled circles in Figure 2 show the -band image for Pointing 1 is per cent complete down to a magnitude of and is 50 per cent complete at a magnitude of over the deepest area. The -band image for Pointing 2 (denoted by open diamonds in figure 2) is per cent complete down to a magnitude of and is 50 per cent complete at a magnitude of over the deepest area in that pointing. We also estimate the completeness of the band image with a similar method. Figure 3 shows the -band image is per cent complete to and is 50 per cent complete at .
We calculated our limit in the -band to be 25.9 in pointing 1, which agrees with our 50 per cent completeness limit (Fig. 2). We tested the SExtractor parameters by reducing our detection thresholds and found they had little or no effect on our completeness implying that our original parameters of at least 5 pixels at or above were reasonable and did not eliminate credible sources from our selection.

3.3 -drop Candidate Selection

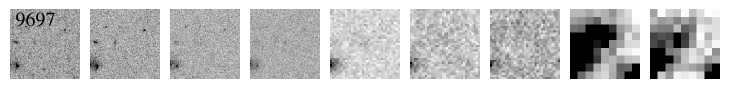
| Our ID | 2200 | 9136 | 9266 | 9697 |
|---|---|---|---|---|
| RA & Dec | 03 32 25.3 -27 52 30.7 | 03 32 17.4 -27 43 43.0 | 03 32 19.2 -27 43 33.4 | 03 32 22.7 -27 43 00.8 |
| 26.87 0.31 | 27.19 0.38 | 28.1 | 27.84 0.65 | |
| 25.70 0.14 | 25.90 0.18 | 25.94 0.19 | 25.29 0.10 | |
| 25.23 0.16 | 24.98 0.23 | 26.18 | 26.0 0.42 | |
| 23.8 0.07 | 24.98 0.32 | 25.42 | 25.42 | |
| 21.4 0.01 | 23.6 0.054 | 25.76 | 24.01 0.07 | |
| 21.1 0.01 | 23.55 0.07 | 25.87 | 24.35 0.13 | |
| 20.53 0.02 | 23.77 | 23.77 | ||
| 20.46 0.02 | 22.24 0.28 | 23.81 | 23.81 | |
| 1.17 | 1.29 | 2.10 | 2.47 |
For our -drop selection, our SExtractor catalogues revealed 278 candidates with aperture corrected colours mag and in the band. We expect that many of these candidates will be low-redshift interlopers such as low-mass stars or red galaxies at , which can produce large colours (in particular due to 4000 Å and Balmer breaks – see Figure 4). We chose this colour cut of mag because although it does not eliminate all of the low redshift interlopers it does omit a significant fraction without excluding potential candidates at . We show the distribution of colours for all of our detected objects in Figure 5. In order to eliminate obvious low-redshift contaminants, we compared our list of -drop candidates to the GOODS MUSIC catalogue (Grazian et al. 2006) with a matching radius of . This catalogue provides photometry from HST-ACS, Spitzer-IRAC, and ground-based -band and VLT-ISAAC imaging, with PSF-matching used to determine accurate colours. The GOODS-MUSIC catalogue includes photometric redshift estimates derived from the 14-band photometry, and the catalogue is a combination of a -band and -band selection.
Of the 278 candidates, 101 appeared in the GOODS-MUSIC catalogue, mostly with photometric redshifts , although there were two with which were identified by Mannucci et al. (2007) as brown dwarfs – these objects are further discussed in Section 4.3.
There was also one other candidate with that was identified in our original search but was found to have a match to GOODS-MUSIC catalogue object 30046. It has detections in the , , , , and Spitzer bands with very strong emission at the Spitzer wavelengths. Its photometric redshift of , along with its detection in the -band and its non-detection at the shorter ACS wavelengths, leads us to classify this object as a possible -drop and therefore remove it from our sample of -drop candidates.

We confirmed that all of the matches to GOODS-MUSIC had detections in one or more of the deep ACS -, - and -bands, ruling out high-redshift interpretations due to the absence of a break at Lyman-. In Figure 6 we show the colours of our -drop candidates with GOODS-MUSIC matches over-plotted with the full GOODS-MUSIC catalogue (with a -band threshold of ). As can be seen, most of our sources have , as would be expected from our selection of , and the bulk lie at (as would be expected for the interloper populations – see Figure 4). The drop candidates that do not lie at or are largely attributable to the GOODS-MUSIC catalogue dealing with total magnitudes, whereas we chose to use aperture magnitudes (more accurate for the expected compact nature of high-redshift galaxies), with large low-redshift galaxies having a greater aperture correction than we adopted. Also, colour gradients within galaxies mean that aperture photometry may select red regions of galaxies (e.g. spiral bulges) as -drop candidates; the HST-ACS -band has better resolution than the ground-based -band so we are sometimes susceptible to edges of large objects as spurious candidates.
For the 177 -drop candidates which did not lie within of a GOODS-MUSIC source, we visually inspected all four HST-ACS wavebands, as well as the HAWK-I -band and the ISAAC and bands, to ascertain whether the -band detection was real, and if there was any detection at other wavelengths. Flux in the ACS -, - or -bands would be incompatible with the source being a -drop Lyman-break galaxy at . We found that 17.5 per cent of the remaining 177 candidates were detector artifacts (most frequently the cross-talk effect due to a bright object in the same detector row, manifesting a positive-negative dipole signal). Ghost image haloes around bright stars accounted for another 14 per cent, and 14 per cent again of the candidates were unreliable due to falling in regions of excess noise (despite using exposure weight maps to cut-down on spurious detections).
To verify the reality of our six remaining -drop candidates, we split the band data in to two halves (in time) and combined the first half and the second half of the data separately. We then measured the band magnitudes of the candidates in both halves of the data (along with some reference star (in case the seeing or magnitude zeropoints differed over time) to check for consistency. Two of the six remaining candidates were eliminated during this process as they were only visible in the second half of the data. These objects appeared very bright in the -band and were undetected in all of the other bands. This prompted us to examine the individual images which revealed the two sources to be time variable. Each night’s data was combined separately and the photometry on the individual nights were measured for each candidate. Both objects were undetected on 2007-10-17, 2007-10-18, and 2007-10-19 but were visible on 2007-12-01 and 2007-12-02 with magnitudes from . The two transient objects have coordinates of and .
Hence we find that 46.7 per cent of the 177 -drop candidates without GOODS-MUSIC matches are spurious. A comparable fraction (50 per cent) had detections visible in the HST-ACS images; it is probable that they did not have corresponding GOODS-MUSIC matches because of the small matching radius we adopted () to cut down on multiple matches. Small astrometric shifts in some regions, the -band and -band magnitude cuts in GOODS-MUSIC, and spatially extended galaxies with colour gradients account for these objects not having GOODS-MUSIC matches. Hence, from an initial colour selection resulting in 278 objects, we have 4 remaining drop-out candidates without GOODS-MUSIC matches. Table 1 contains our list of -drop candidates.
Some of our -drop candidates may simply meet our selection criteria due to photometric scatter. To assess how significant this may be in our dataset we use our parent catalogue of band detected sources over the 90.6 arcmin2, which reaches a 5 depth of mag (see section 2), and randomly redistributed the magnitudes according their corresponding uncertainties in both the and bands and calculated the new colour for each source. We find, on average, that we detect nine objects purely due to photometric scatter in the parent catalogue. However, if we then take the fraction of the total sources that we exclude through our subsequent cuts through matching to the HST-ACS images etc., then we expect approximately 0.2 sources to be spurious in our final candidate list. Therefore, it is conceivable that one of our sources is a product of photometric scatter. Due to the lack of detection in any band other than the -band then Object 9266 is plausibly spurious.
3.4 -drop Candidate Selection
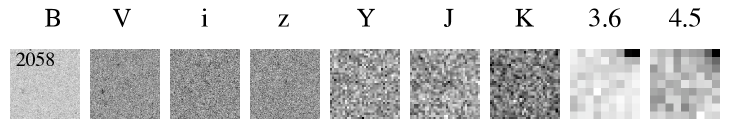
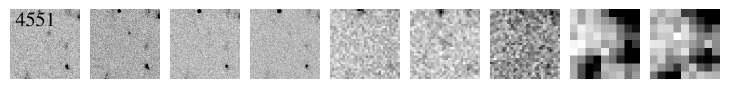
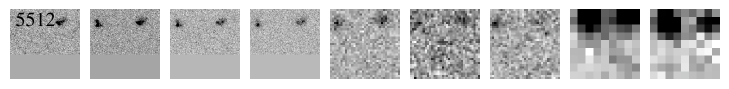
| Our ID | 2058 | 4551 | 5512 | 4532 |
|---|---|---|---|---|
| RA & Dec | 03 32 27.6 -27 51 04.1 | 03 32 16.2 -27 47 39.1 | 03 32 27.5 -27 46 14.7 | 03 32 48.3 -27 47 39.9 |
| 26.6 | 26.6 | 26.6 | 27.47 0.6438 | |
| 25.37 0.19 | 25.07 0.19 | 25.05 0.19 | 25.37 0.19 | |
| 25.42 | 25.42 | 25.42 | 25.42 | |
| 25.76 | 25.76 | 25.76 | 25.76 | |
| 25.87 | 25.87 | 25.87 | 25.87 | |
| 23.77 | 23.77 | 23.77 | ||
| 23.81 | 23.81 | 23.81 | 23.81 | |
| 1.23 | 1.53 | 1.55 | 2.1 |
The -drop candidate selection was carried out in the same manner as the -drop selection. Our criteria for the -drop candidates were a colour difference of , a signal-to-noise ratio in the -band and a value in both the - and -band exposure maps equivalent to a minimum of 2.5 hours of observation in the band. This selection yielded a list of 133 possible -drop candidates. We then compared our list to the GOODS MUSIC catalogue to eliminate the low redshift interlopers from our selection. In all, 98 of our 133 objects had matches within of our candidates. One of these objects had no detection in the bands , or so we kept it in our candidate list. This resulted in 37 -drop candidates. These remaining objects were inspected more closely with postage stamps in , , , , , and bands. We found 16 per cent of our remaining candidates to be ghost image haloes around bright stars, 27 per cent were detections picking up on the edges of bright galaxies in the -band. Another 3 per cent fell on noisy regions of the -band and 43 per cent of our candidates had visible ACS detections. From our original list of 133 candidates only 4 possible -drops remain, and these are listed in Table 2.
4 Discussion
4.1 Candidates
We have four -drop candidates remaining after eliminating artifacts and low-redshift interlopers. Our candidates span a range (after applying our aperture correction), two of which have detections in the -band. Three of the candidates have strong detections in the IRAC wavebands. We obtained photometric redshifts for these objects because the detection at the IRAC wavelengths increases the likelihood of a valid detection and also improves the accuracy of the photometric redshift solutions. We used the publicly available software Hyperz 333 Hyperz is available at http://webast.ast.obs-mip.fr/hyperz/ (Bolzonella, Miralles & Pelló et al. 2000) to derive our photometric redshift estimates in the redshift range . We allowed visual extinction values between and assumed the Calzetti (1997) reddening law. We used the eight Bruzual & Charlot (2003) template spectra provided, using solar metallicity and included the following 11 filters , , , , , , , and the four IRAC channels . We employed option 2 for the error treatment of an undetected source which assumes that the flux in that filter and its error are equal to half the flux of the limiting magnitude (i.e. the error bar ranges from flux=0 to the limiting magnitude in that waveband).
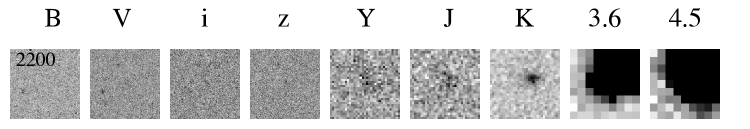
Object 2200
This object displays a strong detection in the , and bands as well as a significant detection in the IRAC channels 1 and 2. There is some flux detected in the -band, however this is to be expected for some candidates as an examination of Figure 1 shows the and filter transmission curves do overlap significantly. This means as the Lyman break moves through the band filter with increasing redshift its contribution to the -band flux will decrease but may not entirely disappear. The band source is slightly offset from the detection in the other wavebands for object 2200, this prompted us to widen our search area in the GOODS-MUSIC catalogue to a radius. This larger radius yielded a match to an object in GOODS-MUSIC with an ID 30199 and . This object was also identified by Stanway et al. (2008) as a possible -drop. However, the detection by Stanway et al. is centered from our source.
This object also has a reported MIPS m detection (source mip003485 in Alonso-Herrero et al. 2006), and coincides with a keV Chandra X-ray source, and hence probably has an AGN contribution. This object has also been presented in Dunlop, Cirasuolo & McLure (2006), their object 2336, who derive a photometric redshift in the range . The photometry presented in Table 1 is for an object at the position of the band source, this is offset from the band source and as such has a fainter magnitude than that given by Dunlop et al. (2006). We believe that the band detection is probably associated with the source, although this requires additional imaging and/or spectroscopy to confirm.
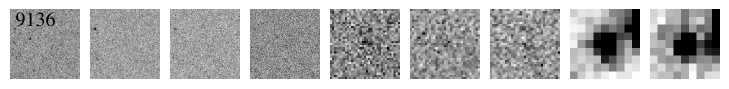
Object 9136
This candidate displays a strong detection in the band and is also detected in the and bands, and like object 2200 it is strongly detected at the IRAC wavelengths. In Figure 7 we show the photometric data points for this object with the best fit galaxy template overlaid. The best fit solution from Hyperz is with a secondary peak in the probability distribution at (Fig. 8). This best fit solution is for a starburst galaxy with . We calculated star formation rates for our objects based on the rest frame UV continuum at Å (see Bunker et al. 2004). For object 9136 we find a star formation rate of M.


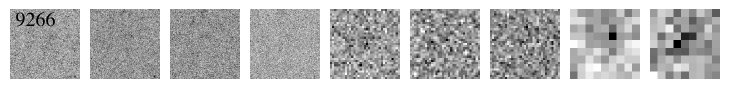
Object 9266
This object is detected in the -band, but not in the - and -bands. However the limits in these bands are fainter than the measured -band magnitude. This could indicate that the object is spurious or a result of line contamination in the band filter, or simply that its continuum is fainter than the and band limits but bright enough to be detected in the -band. We did not fit a photometric redshift for this object due to its limited detections.
Object 9697
This object was previously identified as an -band drop-out in the GOODS ACSv1 data by Bouwens et al. (2006), and is #2226643007 in their catalogue, with , and infrared magnitudes and . The source is detected in the - and -bands and there is also a strong Spitzer detection. However there is a nearby source in the -band unconfirmed at the other wavelengths and another detection to the east in the and bands which, while unassociated with the -band detection, may be at least partially responsible for the IRAC flux as it does fall within the IRAC aperture. However it would be a rather unusual object to be detected in and and the Spitzer bands and undetected in , , , and . The colours appear consistent with a high-redshift interpretation. We also ran Hyperz on this object assuming the Spitzer flux was contributed by our candidate to determine its photometric redshift. In Figure 9 we show the photometry of this object with the best-fit galaxy template overlaid. The best-fit solution was with a secondary peak in the probability distribution at , see Figure 10. This best-fit solution is for an elliptical galaxy with . We calculate the star formation rate based on the UV continuum to be .


Another possibility, other than a high redshift interpretation, is that the objects which are strongly detected in the IRAC bands, 9136, 9697 and 2200 may be similar to IRAC-selected extremely red objects (IEROs) see (Yan et al. 2004). But in the sample discussed by Yan et al. the sources had optical detections which our candidates do not. At the high-redshifts that we estimate for these galaxies, if there was an old stellar population present, the 4000 Å break could fall between the and the m bands. This could explain some of our sources increasing in brightness at the IRAC wavelengths.

We also explored the possibility that our remaining candidates could be brown dwarfs. Patten et al. (2006) presented observationally-derived colours for various spectral types of M, L and T dwarfs in the near-infrared and IRAC bands. In order to rule out our candidates as brown dwarfs we compared their near-infrared colours to the following three colour spaces: ; ; and . We combined the errors on our data points to conservatively explore the colour space covered by our objects and compared them with the expected brown dwarf colours. We found colours indicative of spectral types T2-5 for object 9136 but we found colours indicative of an L8 dwarf and colours of a T7 or T8 dwarf. Each constraint contradicts the next, therefore we find it unlikely that object 9136 is a brown dwarf.
Object 9697 has colours consistent with all M, L and T0-3 spectral types and colours consistent with L5-8 and all T-dwarfs and (at the limit of its errors) colours between and . The plots provided be Patten et al. (2006) indicate that a brown dwarf of type M, L or T will have colours of , so at the extreme of its errors, object 9697 has colours just consistent with an L8 brown dwarf. However when we compared typical colours of brown dwarfs (Hewett et al. 2006) with m colours, see Figure 11, we find that object 9136 lies significantly away from the typical low-mass star colours, again making it unlikely that our objects can be explained as brown dwarfs. A combination of resolution (in the near-infrared bands) and signal-to-noise ratio (in the band) is insufficient to determine whether this object is unresolved, as would be expected for a brown dwarf.
4.2 Plausibility of -drop candidates
Our final list of -drop candidates consists of 4 objects. They span a magnitude range of after applying aperture corrections.
Object 2058 is detected only in the -band with no IRAC source associated.
Object 4551 is also only detected in the -band but falls in a noisy region of the -band image.
Object 5512 falls on the edge of the ACS images.
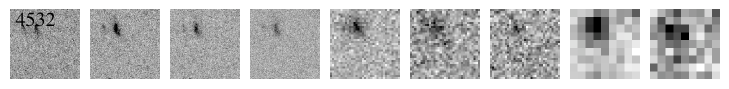
Object 4532 has a -band detection which is possibly associated with the extended edge of a galaxy away. This source is detected in all of the ACS bands and has a match to GOODS-MUSIC object 9610 with a spectroscopic redshift of . It is likely that the large apparent colour recorded at the position of object 4532 is due to worse seeing in the -band than the -band, or perhaps an intrinsic colour gradient in GOODS-MUSIC 9610. Given the proximity of this low-redshift source, it is extremely unlikely that object 4532 is a genuine -drop at .
We find no robust -drop candidates as all of our candidates only appear in the -band image with no significant -band detection which is unexpected as the and -bands probe similar depths. They also have no clear IRAC detection. This could indicate spurious detections in the -band because they are unconfirmed in any other, or it could be the result of line contamination in the -band filter from high equivalent width Lyman . They could also be galaxies with very blue spectra indicating low metallicity and very little or no dust.
In order to assess whether such blue colours could be plausible, we consider two scenarios, one of which has the colour difference produced by a blue spectral slope, the second assumes that the brightness in the -band relative to is attributable to a very strong emission line (e.g. Lyman- at ). We then compare the constraints on the spectral slope and Lyman- equivalent width with the known properties of Lyman-break galaxies at high redshift. If our limits fall outside the range observed in distant galaxies, then the -band detections are probably spurious (i.e., inconsistent with these being -band drop-outs at ).
We assume a simple power law for the spectrum of (or equivalently , where is a spectrum of constant magnitude, flat in ). We place upper limits on the spectral slope of (for sources 4551 and 5512 with ) and (for sources 2058 and 4532 with ); these limits are conservative, because if the Lyman- break occurs in the -band filter (i.e. ) rather than shortward of m then the true spectral slope would be even bluer. Our limits are consistent within the errors with the reported average for -drop galaxies. Stanway, McMahon & Bunker (2005) derive values of from -drop galaxies at , with Bouwens et al. (2008) reporting .
As an alternative to the blue colour being due to a steep blue spectral slope, we now consider whether the apparent flux excess in the -band could be due to emission line contamination. To determine lower limits on the equivalent width of this putative line emission, we assume a spectrum flat in (i.e., constant AB magnitude with wavelength) longward of Lyman-; this is typical of a low-extinction star-forming galaxy. We take our upper limit for the flux density () in the -band as the upper limit on the continuum level in the band filter, and attribute the greater flux density (for objects 4551 and 5512) in the -band ( lower limit) to be due to line emission. The band has a width of 3000 Å, which sets a lower limit on the observed equivalent width of Å (for -drops 4551 & 5512). This corresponds to a rest-frame equivalent width of Å if the line is Lyman- at , where it enters the -band (this limit is conservative because at larger redshifts, an increasing fraction of the -band falls below the Lyman- break, so the contribution of the continuum to the flux density would be even lower and hence the equivalent width higher). These equivalent widths are plausible for the Lyman-break and Lyman- emitter populations at high redshift (e.g., Dawson et al. 2004). We can rule out lower redshift lines with higher confidence (e.g., H at would have an implausibly high Å, and [O II] 3727 Å at would have Å).
We regard the marginal -band detections to be highly suspect, although we cannot eliminate them from our selection based on their blue spectral slopes or high equivalent width line emission falling in the -band. They are unconfirmed in any other band studied here and may be the result of spurious detections. Deeper imaging in , and and/or spectroscopy is required to confirm or disprove the nature of these candidates.
4.3 Discussion of other work
There are a few authors who have provided galaxy candidates at using the Lyman Break technique. As mentioned before, one of our -drop candidates, object 2200 has also been identified by Stanway et al. (2008) but with a slight offset of . Two other objects were also identified as possible high-redshift candidates in that paper, one of which we would not expect to detect because it does not lie within our field and the other object has a signal-to-noise ratio of less than our cut of in the -band. Within the limits of their study, Stanway et al. found the luminosity function at to be consistent with predictions of the luminosity function from Bouwens et al. (2007) and McLure et al. (2009) at . Two other objects within the GOODS-South field were originally flagged by Mannucci et al. (2007) as high-redshift candidates but were later dismissed as brown dwarfs based on their morphologies, Spitzer colours and spectroscopic information. These objects were included in our original catalogues as they do have the colours of high-redshift galaxies, and they were also identified in the GOODS-MUSIC catalogue with photometric redshifts of (objects 11002 & 7004 in the GOODS-MUSIC catalogue). Based on the non-detection of any credible candidates Mannucci et al. placed constraints on the UV luminosity function at and claimed strong evolution in the luminosity function from to . Further evidence for the evolution of the luminosity function from to is presented in Bouwens et al. (2004, 2005, 2008). No robust -drops were presented but a number of -drop candidates were found. However the observations used in the Bouwens et al. (2008) study were much deeper than in other searches and some results even implied evolution from to and a potential luminosity function at was derived while constraints were set on the luminosity function at (the -drop population).
4.4 Implications for the UV Luminosity Function
The number of robust candidates we detect can constrain the UV luminosity functions at . We compute the number of galaxies expected to be selected within our survey area for several luminosity functions, derived from lower-redshift samples. A significant discrepancy between our observed number counts and those predicted would argue for strong evolution in the star-forming population with redshift.
To model the predicted number counts, we first adopt a simple model spectrum of a star-forming galaxy, where the rest-UV spectrum is approximately flat in longward of Lyman- (i.e., where , appropriate for star-forming galaxies at – Stanway, McMahon & Bunker 2005) and is severely attenuated below Lyman- due to the opacity of the intervening neutral hydrogen absorbers (we adopt an absorption of for ). The -band filter is sensitive to the UV continuum longward of Lyman- at , although at the higher redshifts the galaxies would have to be extremely luminous to appear in our magnitude-limited sample – not only is the luminosity distance greater, but also a smaller fraction of the filter bandpass lies above Lyman-. We model this by considering small increments of redshift () between and , and for each redshift bin we calculate the number of galaxies expected as a function of limiting apparent magnitude. We also determine the expected colours to assess whether our colour cut will select star-forming galaxies in that redshift bin. By summing over all the redshift bins, we obtain the expected surface density of -drop galaxies as a function of magnitude. We then consider our exposure maps, and use this to compute the various areas of sky observed to different limiting magnitudes. For each area observed, we correct the predicted number counts for our measured completeness as a function of magnitude (see Section 3.2). By summing the expected number of galaxies above our colour cut () and our significance threshold ( in -band) for each area of the survey, we obtained the total number of -drop star-forming galaxies we would expect to find if the assumed luminosity function is appropriate at .
We can compare the number of expected galaxies derived from models with the number we actually detect. In this paper we will compare two UV luminosity functions, one derived by Steidel et al (1999) for Lyman-break galaxies at (the -band dropouts), and the other by Bouwens et al. (2007) for the Lyman-break population at (the -band dropouts). The Steidel et al. UV luminosity function at has a faint end slope of and yr-1 and Mpc-3, where is derived from the rest-frame UV around Å and has been converted to an effective star formation rate using the relation (Madau, Pozzetti & Dickinson 1998), appropriate for a Salpeter (1955) stellar initial mass function. At the Bouwens et al. luminosity function shows strong evolution in from , with yr-1 (equivalent to at ). The faint end slope is also steeper at () and Mpc-3 (which is ).
For the deepest region of our survey (pointing 1), we expect a -drop surface density brighter than our 50 per cent completeness limit () of and for the Steidel et al. (1999) and Bouwens et al. (2007) luminosity functions respectively. Accounting for completeness and the different depths as a function of survey area, the total numbers expected are or if the or luminosity functions are appropriate for the Lyman-break population at (Figure 14). Clearly, as we have only two robust candidate -drops (and at most three), we can strongly rule out a model where there is no evolution in the rest-frame UV luminosity function from to , as the number of high-redshift galaxies is over-predicted by a factor of 10. There is some evidence for evolution from to : it is likely that some or all of out -drop candidates are not at , and hence the observed number is at least a factor of two less than the prediction based on the luminosity function, although the statistical significance of this is marginal given the small numbers.


The same models were applied for the -drop candidates. Our 50 per cent completeness limit in the -band is at , correcting for incompleteness means we expect to find and -drops for the Steidel et al. and Bouwens et al. luminosity functions respectively (Figure 15). All four of our candidates lie very close to our -band cut and object 4532 is possibly the edge of an extended object away. They are also undetected in -band which is of a similar depth to the -band and hence the sources may be spurious or the result of line contamination in the -band. Although we cannot rule out all of our -band candidates we do not believe them with a high degree of confidence. Thus we are again inconsistent with the Steidel et al. luminosity function implying evolution in the UV luminosity function between and . Within the errors we are consistent with the Bouwens luminosity function at .
At the limit of our survey for the -drop at we begin to probe the Bouwens et al. luminosity function if there is little evolution, but in order to constrain the luminosity function more effectively, deeper and/or wider observations are needed. This is a possibility with the VISTA Deep Extragalactic Observations (VIDEO) and the Ultra-VISTA surveys (Arnaboldi et al. 2007; see also Figures 14 and 15). Due to its large area of sq. degrees, VIDEO will be able to probe the bright end of the luminosity function and after five years will reach limiting magnitudes of and . UltraVISTA goes considerably deeper (to and over 1.5 sq. degrees and and over 0.75 sq. degrees) but over a smaller area than VIDEO, and hence UltraVISTA will be more effective at measuring the position of the break and the slope of the faint end of the luminosity function (see Figure 14).
5 Conclusion
We have searched for high-redshift drop-out galaxies in the GOODS-South field using the new HAWK-I -band data covering arcmin2. We have complemented this data with VLT ISAAC and images in addition to HST-ACS images in , , and along with the deep Spitzer data in these fields. We employed a selection criteria of for the -drops and for the -drops and a . These catalogues were matched to the GOODS-MUSIC catalogue to eliminate objects with optical detections from our candidate lists. Each remaining candidate was inspected by eye to eliminate remaining data artifacts, spurious sources and optical detections. A total of 4 -drop candidates were found within our data. Due to the fact that all of our -drop candidates are very close to our cut and are only significantly detected in the -band, we do not believe any with a high degree of confidence. If none of our -band sources are indeed real, then this demands significant evolution in the UV luminosity function since based on the predictions by Steidel et al.(1999).
We find 4 possible drop candidates, one of which, Object 2200, has a probable low redshift solution of . Another of our candidates, Object 9266, is only detected in the -band. However we have 2 robust candidates, Objects 9136 and 9697, which have significant detections in the IRAC wavebands and photometric redshifts of . Our findings show evolution in the luminosity function since but are, within the Poisson error, consistent with the Bouwens et al. (2007) luminosity function although small number statistics preclude from making any strong statements on the evolution in the Lyman-Break population at . In order to constrain the UV luminosity function at these high redshifts more effectively we need to search over a wider and/or deeper area, this will be possible with the combination of surveys such as VIDEO and Ultra VISTA (Arnaboldi et al. 2007).
Acknowledgments
SH acknowledges a University of Hertfordshire studentship supporting this study and MJJ acknowledges a Research Councils UK fellowship. We thank Ross McLure for useful discussions. This paper is based on observations made with the NASA/ESA Hubble Space Telescope, obtained from the Data Archive at the Space Telescope Science Institute, which is operated by the Association of Universities for Research in Astronomy, Inc., under NASA contract NAS 5-26555. These observations are associated with proposals #9425 & 9583 (the GOODS public imaging survey). We are grateful to the GOODS team for making their reduced images public – a very useful resource. The archival GOODS/EIS infrared images are based on observations collected at the European Southern Observatory, Chile, as part of the ESO Large Programme LP168.A-0485(A) (PI: C. Cesarsky), and ESO programmes 64.O-0643, 66.A-0572 and 68.A-0544 (PI: E. Giallongo).
References
- Alonso-Herrero et al. (2006) Alonso-Herrero, A., et al. 2006, ApJ, 640, 167
- Arnaboldi et al. (2007) Arnaboldi, M., Neeser, M. J., Parker, L. C., Rosati, P., Lombardi, M., Dietrich, J. P., & Hummel, W. 2007, The Messenger, 127, 28
- Becker et al. (2001) Becker, R. H., et al. 2001, AJ, 122, 2850
- Bertin & Arnouts (1996) Bertin, E., & Arnouts, S. 1996, A&AS, 117, 393
- Bolzonella et al. (2000) Bolzonella, M., Miralles, J.-M., & Pelló, R. 2000, A&A, 363, 476
- Bouwens et al. (2004) Bouwens, R. J., Illingworth, G. D., Blakeslee, J. P., Broadhurst, T. J., & Franx, M. 2004, ApJL, 611, L1
- Bouwens et al. (2005) Bouwens, R. J., Illingworth, G. D., Thompson, R. I., & Franx, M. 2005, ApJL, 624, L5
- Bouwens et al. (2006) Bouwens, R. J., Illingworth, G. D., Blakeslee, J. P., & Franx, M. 2006, ApJ, 653, 53
- Bouwens et al. (2008) Bouwens, R. J., Illingworth, G. D., Franx, M., & Ford, H. 2008, ApJ, 686, 230
- Bruzual & Charlot (2003) Bruzual, G., & Charlot, S. 2003, MNRAS, 344, 1000
- Bunker et al. (2004) Bunker, A. J., Stanway, E. R., Ellis, R. S., & McMahon, R. G. 2004, MNRAS, 355, 374
- Calzetti (1997) Calzetti, D. 1997, AJ, 113, 162
- Casali et al. (2006) Casali et al., 2006, SPIE 6269, 29
- Coleman et al. (1980) Coleman, G. D., Wu, C.-C., & Weedman, D. W. 1980, ApJS, 43, 393
- Dawson et al. (2004) Dawson, S., et al. 2004, ApJ, 617, 707
- Dijkstra et al. (2004) Dijkstra, M., Haiman, Z., & Loeb, A. 2004, ApJ, 613, 646
- Dunkley et al. (2009) Dunkley, J., et al. 2009, ApJS, 180, 306
- Eyles et al. (2005) Eyles, L. P., Bunker, A. J., Stanway, E. R., Lacy, M., Ellis, R. S., & Doherty, M. 2005, MNRAS, 364, 443
- Eyles et al. (2007) Eyles, L. P., Bunker, A. J., Ellis, R. S., Lacy, M., Stanway, E. R., Stark, D. P., & Chiu, K. 2007, MNRAS, 374, 910
- Fan et al. (2002) Fan, X., Narayanan, V. K., Strauss, M. A., White, R. L., Becker, R. H., Pentericci, L., & Rix, H.-W. 2002, AJ, 123, 1247
- Fazio et al. (2004) Fazio, G. G., et al. 2004, ApJS, 154, 10
- Ferguson et al. (2004) Ferguson, H. C., et al. 2004, ApJL, 600, L107
- Geballe et al. (2002) Geballe, T. R., et al. 2002, ApJ, 564, 466
- Giavalisco et al. (2004) Giavalisco, M., et al. 2004, ApJL, 600, L93
- Grazian et al. (2006) Grazian, A., et al. 2006, A&A, 449, 951
- Guhathakurta et al. (1990) Guhathakurta, P., Tyson, J. A., & Majewski, S. R. 1990, ApJL, 357, L9
- Hewett et al. (2006) Hewett, P. C., Warren, S. J., Leggett, S. K., & Hodgkin, S. T. 2006, MNRAS, 367, 454
- Iye et al. (2006) Iye, M., et al. 2006, Nature, 443, 186
- Kirkpatrick et al. (2000) Kirkpatrick, J. D., et al. 2000, AJ, 120, 447
- Knapp et al. (2004) Knapp, G. R., et al. 2004, AJ, 127, 3553
- Kogut et al. (2003) Kogut, A., et al. 2003, ApJS, 148, 161
- Lawrence et al. (2007) Lawrence, A., et al. 2007, MNRAS, 379, 1599
- Leggett et al. (2000) Leggett, S. K., et al. 2000, ApJL, 536, L35
- Leggett et al. (2001) Leggett, S. K., Allard, F., Geballe, T. R., Hauschildt, P. H., & Schweitzer, A. 2001, ApJ, 548, 908
- Leggett et al. (2002) Leggett, S. K., et al. 2002, ApJ, 564, 452
- Madau et al. (1998) Madau, P., Pozzetti, L., & Dickinson, M. 1998, ApJ, 498, 106
- Mannucci et al. (2007) Mannucci, F., Buttery, H., Maiolino, R., Marconi, A., & Pozzetti, L. 2007, A&A, 461, 423
- McLure et al. (2009) McLure, R. J., Cirasuolo, M., Dunlop, J. S., Foucaud, S., & Almaini, O. 2009, MNRAS, 395, 2196
- Oke & Gunn (1983) Oke, J. B., & Gunn, J. E. 1983, ApJ, 266, 713
- Ota et al. (2008) Ota, K., et al. 2008, ApJ, 677, 12
- Patten et al. (2006) Patten, B. M., et al. 2006, ApJ, 651, 502
- Pirard et al. (2004) Pirard et al., 2004, SPIE 5492, 510
- Salpeter (1955) Salpeter, E. E. 1955, ApJ, 121, 161
- Stanway & Bunker (2007) Stanway, E. R., & Bunker, A. J. 2007, Nuovo Cimento B Serie, 122, 1189
- Stanway et al. (2008) Stanway, E. R., Bremer, M. N., Squitieri, V., Douglas, L. S., & Lehnert, M. D. 2008, MNRAS, 386, 370
- Stanway et al. (2003) Stanway, E. R., Bunker, A. J., & McMahon, R. G. 2003, MNRAS, 342, 439
- Stanway et al. (2007) Stanway, E. R., et al. 2007, MNRAS, 376, 727
- Stanway et al. (2005) Stanway, E. R., McMahon, R. G., & Bunker, A. J. 2005, MNRAS, 359, 1184
- Steidel et al. (1996) Steidel, C. C., Giavalisco, M., Dickinson, M., & Adelberger, K. L. 1996, AJ, 112, 352
- Steidel et al. (1995) Steidel, C. C., Pettini, M., & Hamilton, D. 1995, AJ, 110, 2519
- Tanvir et al. (2009) Tanvir, N. R., et al. 2009, arXiv:0906.1577
- Venemans et al. (2007) Venemans, B. P., McMahon, R. G., Warren, S. J., Gonzalez-Solares, E. A., Hewett, P. C., Mortlock, D. J., Dye, S., & Sharp, R. G. 2007, MNRAS, 376, L76
- Yan et al. (2004) Yan, H., et al. 2004, ApJ, 616, 63