Formation and Evolution of Dust in Type IIb
Supernova with
Application to the Cassiopeia A Supernova Remnant
Abstract
How much amount and what size of dust are formed in the ejecta of core-collapse supernovae (CCSNe) and are injected into the interstellar medium (ISM) depend on the type of CCSNe through the thickness of outer envelope. Recently Cas A was identified as a Type IIb SN (SN IIb) that is characterized by the small-mass hydrogen envelope. In order to clarify how the amount of dust formed in the ejecta and supplied into the ISM depends on the type of CCSNe, we investigate the formation of dust grains in the ejecta of a SN IIb and their evolution in the shocked gas in the SN remnant (SNR) by considering two sets of density structures (uniform and power-law profiles) for the circumstellar medium (CSM). Based on these calculations, we also simulate the time evolution of thermal emission from the shock-heated dust in the SNR and compare the results with the observations of Cas A SNR. We find that the total mass of dust formed in the ejecta of a SN IIb is as large as 0.167 but the average radius of dust is smaller than 0.01 m and is significantly different from those in SNe II-P with the massive hydrogen envelope; in the explosion with the small-mass hydrogen envelope, the expanding He core undergoes little deceleration, so that the gas density in the He core is too low for large-sized grains to form. In addition, the low-mass hydrogen envelope of the SN IIb leads to the early arrival of the reverse shock at the dust-forming region. If the CSM is more or less spherical, therefore, the newly formed small grains would be completely destroyed in the relatively dense shocked gas for the CSM hydrogen density of cm-3 without being injected into the ISM. However, the actual CSM is likely to be non-spherical, so that a part of dust grains could be ejected into the ISM without being shocked. We demonstrate that the temporal evolution of the spectral energy distribution (SED) by thermal emission from dust is sensitive to the ambient gas density and structure that affects the passage of the reverse shock into the ejecta. Thus, the SED evolution well reflects the evolution of dust through erosion by sputtering and stochastic heating. For Cas A, we consider the CSM produced by the steady mass loss of yr-1 during the supergiant phase. Then we find that the observed infrared SED of Cas A is reasonably reproduced by thermal emission from the newly formed dust of 0.08 , which consists of the 0.008 shock-heated warm dust and 0.072 unshocked cold dust.
1 Introduction
Core-collapse supernovae (CCSNe) have been considered to be one of important sources of interstellar dust. They eject a large amount of heavy elements synthesized during their stellar evolution and explosive burning, and form dust grains inside the dense, metal-rich He core in the expanding ejecta. Meanwhile, the reverse and forward shocks driven by the encounter of the ejecta materials with the surrounding medium propagate into the SN ejecta and the interstellar medium (ISM), respectively, producing the hot gas plasma within the supernova remnant (SNR). The dust grains formed in the He core, before being dispersed into the interstellar space, pass through the shock-heated gas and suffer from erosion and destruction by sputtering due to collisions with the energetic ions. Since the efficiency of destruction of dust grains heavily depends on their composition and size, what composition and what size of dust condense in the ejecta should be clarified for understanding the properties and amount of dust finally injected from CCSNe into the ISM.
Observations of nearby CCSNe have reported increasing evidence for dust formation in the ejecta (see Kozasa et al. 2009 for review). Nevertheless, the composition and size of newly formed dust have not been specified except for two cases; SN 2004et (Kotak et al. 2009) and SN 2006jc (Sakon et al. 2009; Smith et al. 2008; Mattila et al. 2008). The masses of dust formed in the SN ejecta are estimated to be less than from the observations by usually assuming that the ejecta is optically thin for thermal emission of dust. However, newly formed dust may reside in optically thick clumps (e.g., Miekle et al. 2007). Moreover, some species of dust grains can cool down quickly after the formation (Nozawa et al. 2008), so that near- to mid-infrared (IR) observations could miss the cold dust. Hence, the derived mass of dust could be the lower limit in some cases, and the sophisticated radiative transfer calculations (e.g., Sugerman et al. 2006; Ercolano et al. 2007) referring to the observational data at UV/optical to far-IR wavelengths would be required to deduce the properties and mass of dust formed in the ejecta from observations.
Theoretical studies have shown that various species of dust grains with the radii of 0.001–1 m and total mass of 0.1–1 can condense in the ejecta of Type II-P SNe (SNe II-P) retaining the massive hydrogen envelope (Kozasa et al. 1989, 1991; Todini & Ferrara 2001; Nozawa et al. 2003). Adopting the results of dust formation calculations, a semi-analytical model (Bianchi & Schneider 2007) and a numerical simulation (Nozawa et al. 2007) investigated the survival of dust in the SNRs and found that dust mass injected into the uniform ISM is 0.01–0.8 for the ambient hydrogen density of 10–0.1 cm-3. This mass of dust supplied by SNe II-P is still large enough to explain a huge quantity of dust in excess of observed for the host galaxies of quasars at redshift (Morgan & Edmunds 2003; Maiolino et al. 2006; Dwek et al. 2007), though it is proposed that asymptotic giant branch stars can also contribute to dust enrichment even in such an early epoch (Valiante et al. 2009).
Recently Kozasa et al. (2009) have suggested that how much amount and what size of dust are formed in the ejecta and are injected into the ISM depend on the type of CCSNe, reflecting the thickness of the H-rich envelope. The less massive outer envelope leads to extremely high expansion velocity of the He core unless the kinetic energy of explosion is very low, and makes the gas density in the expanding ejecta of the He core too low for large-sized grains to be produced. Furthermore, the low-mass outer envelope can allow the early arrival of the reverse shock at the dust-forming region and result in efficient destruction of newly formed dust in the shock-heated gas with high density. Because a significant fraction of CCSNe (0.3) explode as hydrogen/helium-poor CCSNe such as SNe Ib/Ic and SNe IIb (Prieto et al. 2008; Smartt et al. 2009; Boissier & Prantzos 2009), it is essential to investigate how the formation and destruction processes of dust depend on the type of CCSNe, in order to reveal the role of CCSNe as sources of interstellar dust.
It should be mentioned here that dust grains embedded in the postshock gas are eroded by sputtering and are heated up by collisions with the hot gas, radiating their thermal emission at IR wavelengths. Since the destruction efficiency and heating rate of dust are sensitive to grain size as well as gas density, the IR spectral energy distributions (SEDs) by thermal emission from dust in SNRs can be a diagnostic of the size and temperature of dust, and therefore provide key information on the nature of dust formed in the ejecta, density structure in the ambient medium, and destruction and heating processes of dust. In particular, young SNRs that originated from SNe with the low-mass envelope are ideal ones to compare the observed IR SEDs with calculated ones; the reverse shock can quickly arrive at the He core and heat up newly formed dust before the forward shock sweeps up a considerable amount of circumstellar/interstellar dust, so that we can mainly see the IR emission from dust grains condensed in the ejecta. In this sense, Cassiopeia A (Cas A) SNR is one of the best targets for this study because the type of the Cas A SN is recently identified as Type IIb by a striking similarity between the optical spectrum of scattered light echo of Cas A SN and the time-averaged spectrum of SN IIb 1993J (Krause et al. 2008), and the presence of dust freshly formed in the ejecta has been confirmed by IR observations (e.g., Rho et al. 2008).
In this paper we explore the formation of dust in a SN IIb and the evolution of the dust inside the SNR, with the aim of revealing the composition, size, and mass of dust ejected from hydrogen-deficient CCSNe. In addition, the time evolution of thermal emission from dust within SNRs is calculated and is compared with the observations of Cas A to discuss the composition and amount of dust. In § 2 we perform the calculation of dust formation in the ejecta of a SN IIb whose progenitor has lost most of the hydrogen envelope during the evolution (Nomoto et al. 1993; Podsiadlowski et al. 1993). In § 3 we investigate the evolution of the newly formed dust in the gas heated by the reverse and forward shocks and its dependence on the ambient gas density and structure. Then, following the calculations of dust evolution in SNRs, we present the temporal evolution of IR emission from collisionally heated dust in the hot gas in § 4, and compare the results with the observations of Cas A in § 5. We summarize our results in § 6.
2 Formation of Dust in the Ejecta of SN IIb
In the ejecta of SNe, dust formation takes place within the He core where the densities of condensible elements are high enough to advance the formation and growth of seed nuclei through collisions with the relevant gas species. Formation processes of dust grains are influenced by the time evolution of the density and temperature of the gas as well as the elemental composition in the ejecta (Kozasa et al. 1989). In this section, we describe the model of the dust formation calculation for a SN IIb and present the results of the calculations.
2.1 Model of SN IIb and Calculation of Dust Formation
The calculation of dust formation is carried out by applying the theory of non-steady state nucleation and grain growth developed by Nozawa et al. (2003). The theory takes into account chemical reactions at condensation, considering that the kinetics of nucleation and grain growth is controlled by the key species defined as the gas species with the least collisional frequency among the reactants (Kozasa & Hasegawa 1987; Hasegawa & Kozasa 1988). Given the elemental composition of the gas in the ejecta as well as the time evolution of the gas density and temperature, the theory allows us to determine the condensation time, chemical composition, size distribution, and mass of dust that condenses in the ejecta (see Nozawa et al. 2003 for details).
In the calculation of dust formation, we adopt the model of the SN IIb with the zero-age main-sequence mass of 18 and metallicity of . The ejecta mass is , the mass of hydrogen envelope is , the kinetic energy of explosion is ergs, and the synthesized 56Ni mass is 0.07 . These model parameters are invoked to reproduce the light curve of SN 1993J by referring to the SN model in Shigeyama et al. (1994). Note that the mass of ejecta in this model is in good agreement with the ejecta mass of Cas A ( 2–4 ) estimated from the studies of shock dynamics (Borkowski et al. 1996; Chevalier & Oishi 2003; Laming & Hwang 2003) and from X-ray observations (Vink et al. 1996; Favata et al. 1997; Willingale et al. 2003).
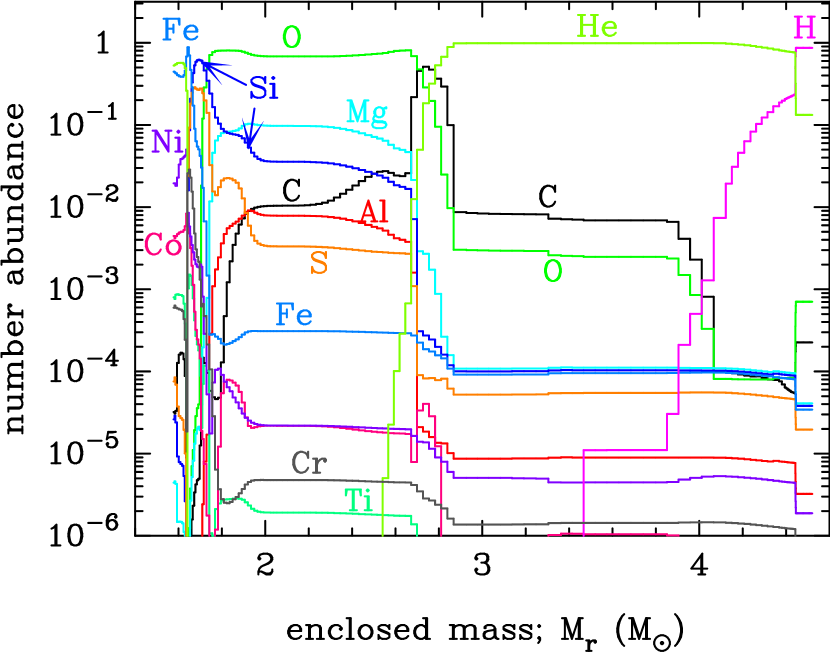
In Figure 1 we show the elemental composition in the ejecta of the SN IIb model at 600 days after the explosion, taking the decay of radioactive elements into account. In Table 1 we also present the mass of the main refractory species in the ejecta. We assume that the elemental distribution in the ejecta remains an onion-like structure without any mixing, which is consistent with the theoretical model of mixing in SN 1993J; Iwamoto et al. (1997) have shown with the 2D simulation that the deceleration of the He core by the thin H-rich envelope is so weak that the growth of the Rayleigh-Taylor instability is too slow to cause substantial mixing in the ejecta, in contrast to SN 1987A which has a thick H-rich envelope (e.g., Hachisu et al. 1990, 1992). Although the jet formation in the explosion suggested from the observations of Cas A can lead to macroscopic mixing (e.g., Tominaga 2009), a simple argument of molecular diffusion has shown that mixing at the atomic level is extremely ineffective before the condensation of dust grains in the ejecta (Deneault et al. 2003). Indeed, the observations of Cas A at various wavelengths have suggested that the mixing in the ejecta should not be at atomic level but at the macroscopic level (e.g., Willingale et al. 2002; Fesen et al. 2006b; Ennis et al. 2006). From Figure 1, we can see the layered structure of elemental composition with the very thin hydrogen envelope at the outermost ejecta, which is followed by C-rich (C/O 1) He layer, O-rich layer, Si-S-Fe layer, and Fe-Ni layer inwardly.
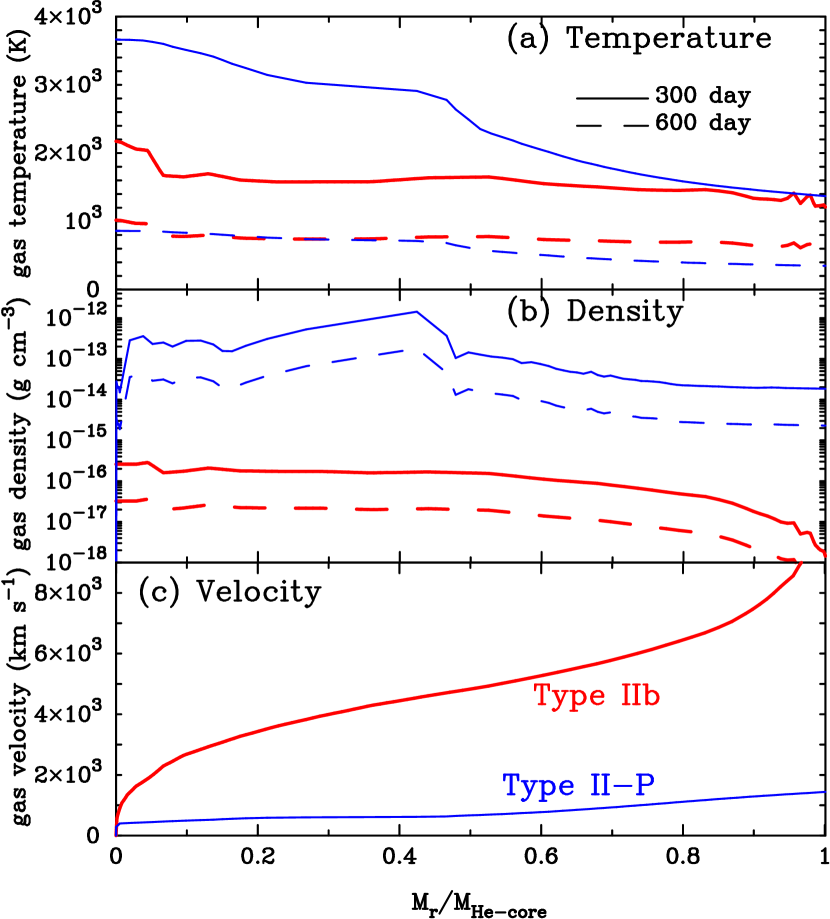
The distributions of gas temperature and density in the ejecta of the SN IIb at 300 days and 600 days are shown in Figures 2a and 2b, compared with those for the SN II-P model of and = 13.2 with the same and as those of the SN IIb model (Umeda & Nomoto 2002). The gas density scales as with the time after the explosion, and the time evolution of gas temperature is mainly regulated by the energy deposited from radioactive elements (i.e. ). It should be noted that the gas density in the He core of the SN IIb is about three orders of magnitude lower than that in the SN II-P. The reason for this is that, since almost all of the explosion energy are deposited into the He core without the thick hydrogen envelope, the resulting expansion velocity of the gas in the He core of the SN IIb is much higher than that of the SN II-P, as shown in Figure 2c.
Based on the hydrodynamic and nucleosynthesis models for the SN IIb, we calculate dust formation. Dust formation proceeds through the formation and growth of seed nuclei as the gas cools down. The number of seed nuclei is evaluated by calculating the non-steady state nucleation rate (Eq (5) in Nozawa et al. 2003) being coupled with the time evolution of the gas temperature and the number density of the key species. In the calculations, it is assumed that without coagulation the seed nuclei grow homogeneously at a rate controlled by the collisions of the key species with the sticking probability of unity. We also assume that the formation of CO and SiO molecules is complete; all C (Si) atoms are locked in CO (SiO) molecules in the case where the number density of C (Si) atoms is lower than that of O atoms. Under this assumption, C-bearing grains can condense only in the He layer with C/O 1. Depletion or rarefaction of the key species due to the grain growth or the expansion of the ejecta, respectively, causes the process of nucleation and grain growth to cease in less than a few tens of day since the onset of nucleation.
2.2 Results of Dust Formation Calculation
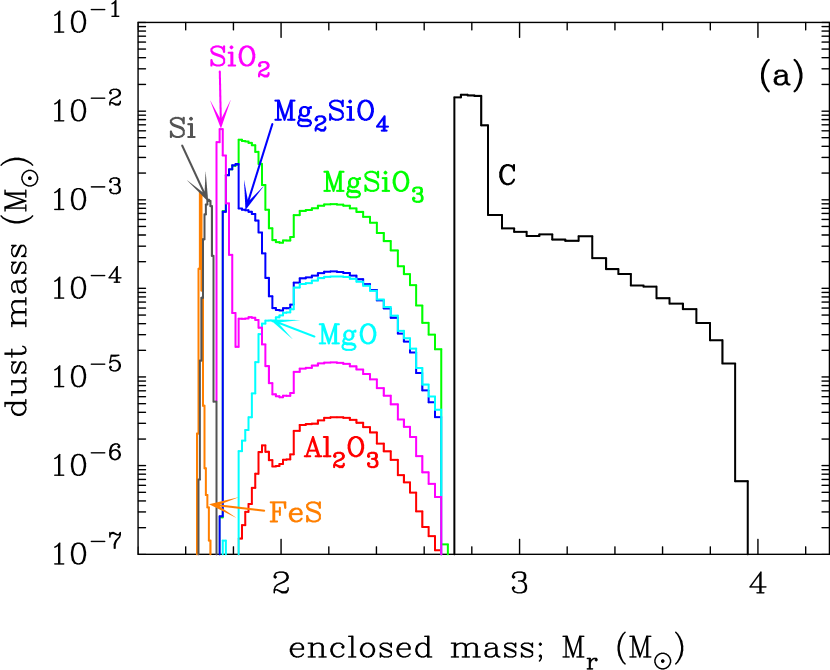
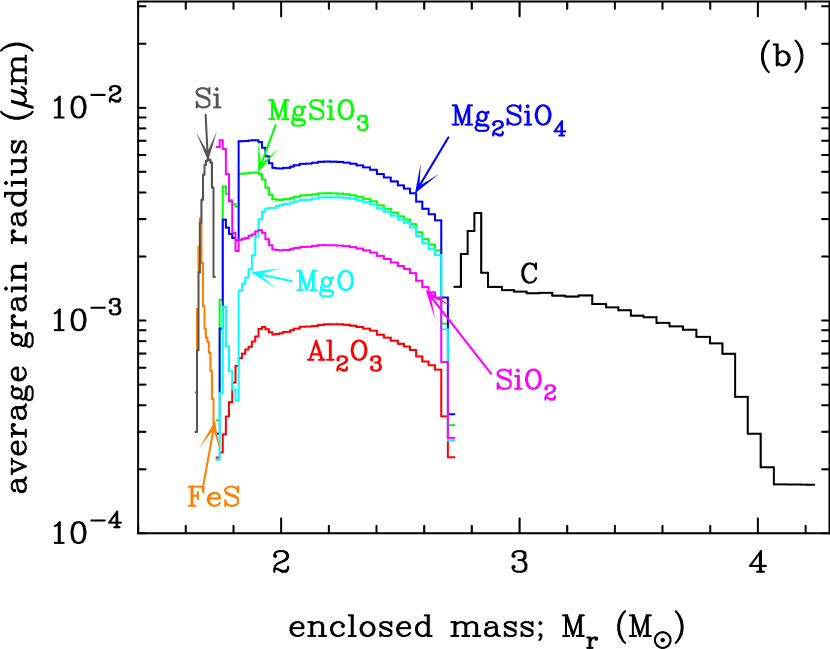
The simulation results of dust formation in the SN IIb are illustrated in Figures 3a and 3b, where the mass distribution and average radius of each dust species formed in the ejecta are given as a function of enclosed mass , respectively. Without any mixing of elements, different species of dust condense according to the elemental composition of the gas in each layer: C grains in the He layer, silicates (MgSiO3, Mg2SiO4, and SiO2) and oxides (Al2O3, and MgO) in the O-rich layer, and FeS and Si grains in Si-S-Fe layer. The typical times (gas temperatures) at which dust grains condense in the ejecta are 300–350 days (1400–1700 K) for C grains, 350–500 days (1100–1400 K) for silicate and oxide grains, and 600–700 days (800–900 K) for Si and FeS grains. In the innermost Fe-Ni layer, neither Fe nor Ni grains can be formed because the gas density becomes too low before the gas cools down to the temperatures (800 K) at which these grains can condense. Fe atoms residing in both the O-rich and He layers are not abundant enough to be locked in grains as Fe-bearing dust (see Fig. 1). Except for Fe grains, the major species of dust formed in the SN IIb are the same as those for the unmixed cases in SNe II-P with in Nozawa et al. (2003).
The mass of each dust species formed in the ejecta of SN IIb is presented in Table 2, together with the ratio of its mass to the total dust mass (see Table 1 for the mass and mass fraction of refractory elements locked in dust grains). The total mass of newly formed dust is 0.167 , which is more than two orders of magnitude larger than the dust mass estimated from a handful of observations of nearby dust-forming SNe. C grains are the most dominant species in mass, with the mass of 0.07 , and the bulk of them is in the innermost He layer at 2.7–2.9 (see Fig. 3a), where the mass fraction of available C atoms locked in C grains is 0.4–1. The masses of MgSiO3, Mg2SiO4, and SiO2 are 0.055 , 0.017 , and 0.016 , respectively, and these silicate grains account for more than 50 % of the total dust mass. The mass distributions of silicate grains are influenced by the abundance of SiO molecules (namely Si atoms, see Fig. 1), and fairly concentrate at 1.7–1.9 with the mass fraction of the preexisting SiO molecules locked in silicate grains 0.4–0.8. The condensation efficiency, defined as the ratio of the total dust mass to the total metal mass, is 0.13 for the SN IIb and lies in the range of those estimated for SNe II-P (0.05–0.25, Nozawa et al. 2003).
It should be emphasized here that, as can be seen from Figure 3b, the average radii of all grain species formed in the SN IIb are below 0.01 m and are much smaller than those ( m) of dust grains formed in SNe II-P (Nozawa et al. 2003). This difference is caused by the difference in the gas density within the expanding ejecta of the He core. In general, a larger supercooling necessary for dust grains to condense in a gas with lower density leads to the formation of a large number of seed nuclei and results in smaller average radii even if all available gaseous atoms are used up for the growth of seed nuclei (, where is the mass fraction of key species locked in a given grain species). As was discussed in Kozasa et al. (1989), in the condition that the number density of key species is so low that the collision timescale of key species is longer than the expansion timescale of the gas, neither a significant number of seed nuclei can condense nor nucleated grains can grow to sufficiently large radii via accretion onto the surface of the grains.
2.3 Dependence of Grain Radius on SN Parameters
Here we briefly discuss how our results on the dust formation are affected by the model parameters of SN explosion, in particular focusing on the kinetic energy of the explosion . A lower leads to a higher He core density, thus making it possible for more dust grains with larger radii to condense if the time evolution of the gas temperature could not be affected by the explosion energy. At a fixed time , the gas density is scaled by the expansion velocity as for a given mass and density structure of the ejecta. Since and roughly (Nozawa et al. 2003), we find . Thus, even for the extremely low explosion energy of ergs, the increase in the average grain radii is as small as a factor of 3. In addition, if we consider (1–4) ergs estimated for Cas A (Willingale et al. 2003; Chevalier & Oishi 2003; Laming & Hwang 2003; Young et al. 2006), grain radii only reduce by a factor of , compared with those given in Figure 3b.
In reality, however, the assessed variation of the grain radius is suppressed by the dependence of the time evolution of gas temperature on ; with the same amount of 56Ni in the ejecta, the lower (higher) explosion energy can cause the gas temperature to decrease more slowly (more quickly) because of more (less) efficient energy deposition in the ejecta with the higher (lower) gas density. This leads to the later (earlier) condensation of dust, which compensates for the increase (decrease) in the gas density. Consequently, the condensation of dust occurs at the similar gas density, and not only the radius but also the mass of dust formed in the ejecta is almost the same, regardless of the explosion energy (see Appendix A in Nozawa et al. 2003), as long as the range of variation of is not extremely large. The qualitative analysis indicates that grain radius is insensitive to the explosion energy, and that our results on dust formation are robust for the expected variation of model parameters for Cas A SN.
On the other hand, it should be noted that grain radius is greatly affected by the structure of the progenitor star resulting from the presence or absence of the massive outer envelope; as seen from Figure 2c, the He-core velocity of the SNe IIb with the thin hydrogen envelope is 5–10 times higher than that of the SN II-P with the thick envelope. The higher velocity of the SN IIb leads to a few orders of magnitude lower gas density and thus produces about one order of magnitude smaller dust grains than the SN II-P. Nozawa et al. (2008) have also pointed out the effect of the lack of the outer envelope on the size of newly formed dust in Type Ib SN 2006jc, applying the SN model by Tominaga et al. (2008). They found that too low gas density in the He core, which is caused by the absence of the outer envelope, prevents dust grains with the radii larger than 0.01 m from forming within the He core. These results indicate that the radii of dust grains formed in SNe IIb and SNe Ib/Ic are to be generally smaller than those in SNe II-P with the thick outer envelope.
Our results demonstrate that the composition and mass of dust grains formed in the ejecta are almost independent of the type of CCSNe and the initial metallicity of the progenitors because the distribution and yield of metals in the He core are similar. On the other hand, their radii strongly depend on the type of CCSNe; SNe with the lower-mass envelope produce much smaller dust grains ( m) than SNe II-P with the much more massive envelope. As shown in the next section, small sizes of newly formed dust grains will determine their subsequent fates within the SNR.
3 Evolution of Dust in Type IIb SNR
Dust grains formed in the He core initially comove with the gas without suffering from any processings. Upon encountering the reverse shock, the gas is quickly decelerated, while the dust grains decouple from the gas with high velocities relative to the gas, and intrude into the hot plasma region created by the passage of the reverse and forward shocks. These shocked dust grains are decelerated by the drag force, eroded by thermal and/or kinetic sputtering, and heated up by collisions with the hot gas. The motion, destruction, and heating of dust depend on not only the properties of dust but also the density and temperature in the postshock gas. In this section, applying the result of the dust formation calculation, we examine the evolution of the dust in the hot gas within SNRs and its dependence on the gas density and structure in the CSM.
3.1 Model of Calculations for Destruction and Motion of Dust in SNRs
The calculations of dust evolution within SNRs follow the method described by Nozawa et al. (2007); dust grains are treated as test particles, and the motion and destruction of dust are pursued by calculating self-consistently the erosion due to sputtering and deceleration due to the gas drag together with the time evolution of gas temperature and density in the spherical symmetry shock. We make use of the size distribution and spatial distribution of each dust species obtained in the last section as the initial conditions, and adopt the model of the SN IIb used in § 2 as those for the velocity and density structure in the ejecta.
For the structure of circumstellar medium (CSM), which affects the evolution of SNRs and thus has critical impacts on the evolution of dust, we consider two sets of density profile. One is the uniform CSM with the hydrogen number densities of = 0.1, 1, and 10 cm-3, assuming that the gas in the CSM has the solar composition and are fully ionized. For the other CSM density profile, we consider the density structure produced by the steady stellar wind during the evolution of the progenitor; the density profile is represented in terms of hydrogen number density as
| (1) | |||||
where cm is the radius of the freely expanding outermost ejecta at yr after the explosion in the present model, and is the radius such that cm-3. The coefficient is given as
| (2) |
where is the mass-loss rate, is the stellar wind velocity, is the mean molecular weight, and and are the mass and the number abundance of hydrogen atom, respectively. In the calculations, we consider three cases of , and 200 cm-3; for example, the case of = 30 cm-3 with 10 km s-1 corresponds to yr-1, which is the mass-loss rate of Cas A’s progenitor suggested from the analysis of shock dynamics by Chevalier & Oishi (2003).
The CSM models used in the calculations are listed in Table 3, and the uniform CSM and the stellar wind CSM () are referred to as the model A and B, respectively, with the value of or attached for each case. In the calculations, the spatial bin for hydrodynamic calculation is linearly divided into 2510 bins, and the size bin of dust is logarithmically divided into 80 bins for the range of 1 Å to 1 m. We assume that the gas in the CSM has a temperature of K and that the ejecta collide with the CSM at yr after the SN explosion. We have confirmed that the moderate changes of the CSM gas temperature (103–105 K) do not influence the results of calculations. The calculations are performed up to –106 yr, depending on the CSM density.
3.2 Results of Dust Evolution Calculation
3.2.1 Penetration of the Reverse Shock into the Ejecta
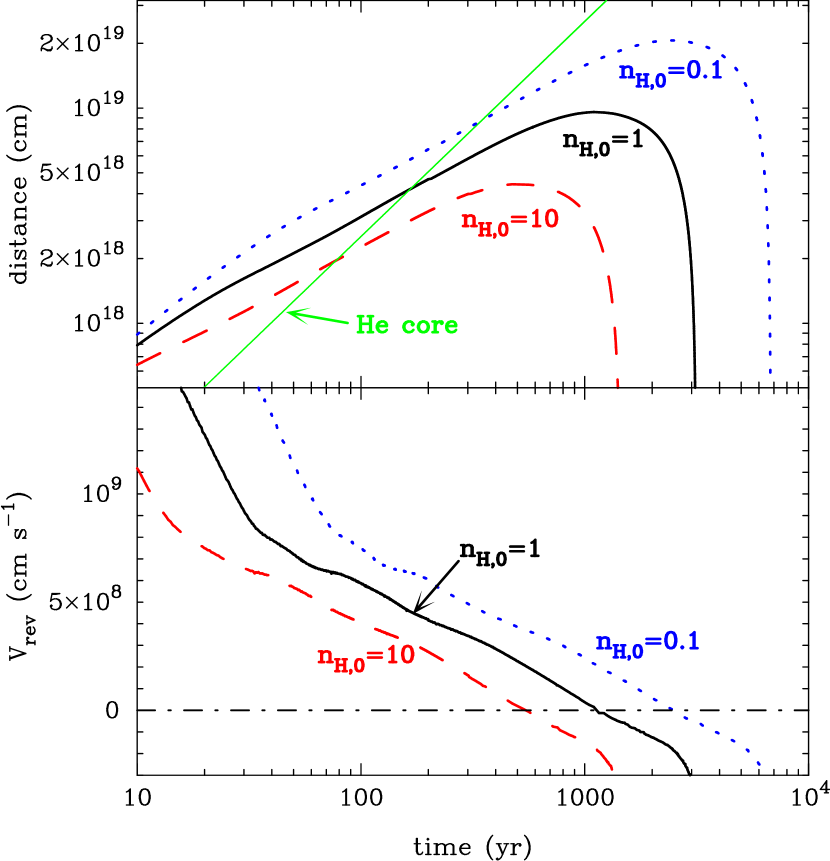
We first describe how the penetration of the reverse shock depends on the gas density in the CSM. Figure 4 exhibits the time evolution of radius and velocity of the reverse shock for the uniform CSM models A0.1, A1, and A10 with 0.1, 1, and 10 cm-3, respectively. In the upper panel, we also show the trajectory of the boundary between the He core and the hydrogen envelope, for a reference, assuming that the boundary is not decelerated even after the collision with the reverse shock.
The interaction of the SN ejecta with the ambient medium generates the forward shock running into the CSM to compress the ambient medium. The shocked hot ambient gas thrusts the ejecta in turn, driving the reverse shock that propagates into the ejecta but initially expands outward in the Eulerian coordinate. For the higher CSM density, the forward shock acquires a lower velocity, and the denser shocked gas is produced behind the forward shock. Accordingly, the reverse shock travels through the ejecta with a smaller outward velocity so that the unshocked ejecta can catch up with the reverse shock at earlier times (see Figure 4). Thus, the time at which the reverse shock collides with the He core is earlier for the higher gas density in the CSM: 355 yr, 155 yr, and 75 yr for the model A0.1, A1, and A10, respectively. For the stellar wind CSM, the collision times are earlier than for the uniform CSM models because of higher ambient density at the time of the ejecta-CSM interaction: 63 yr, 48 yr, and 45 yr for the model B30, B120, and B200 with 30, 120, and 200 cm-3 (see Table 3).
Note that these collision times for the remnant of Type IIb SN (hereafter Type IIb SNR) are a few tens times earlier than those for Type II-P SNRs, for which (1.5–10) yr for the CSM densities of 10–0.1 cm-3 (Nozawa et al. 2007). The earlier arrival of the reverse shock at the He core in Type IIb SNR is due to its much thinner hydrogen envelope than that of Type II-P SNR and the resulting higher expansion velocity of the He core (see Figure 2c). As shown below, the thickness of the hydrogen envelope has great effects on the evolution of dust in SNRs.
3.2.2 Destruction of dust for the uniform CSM
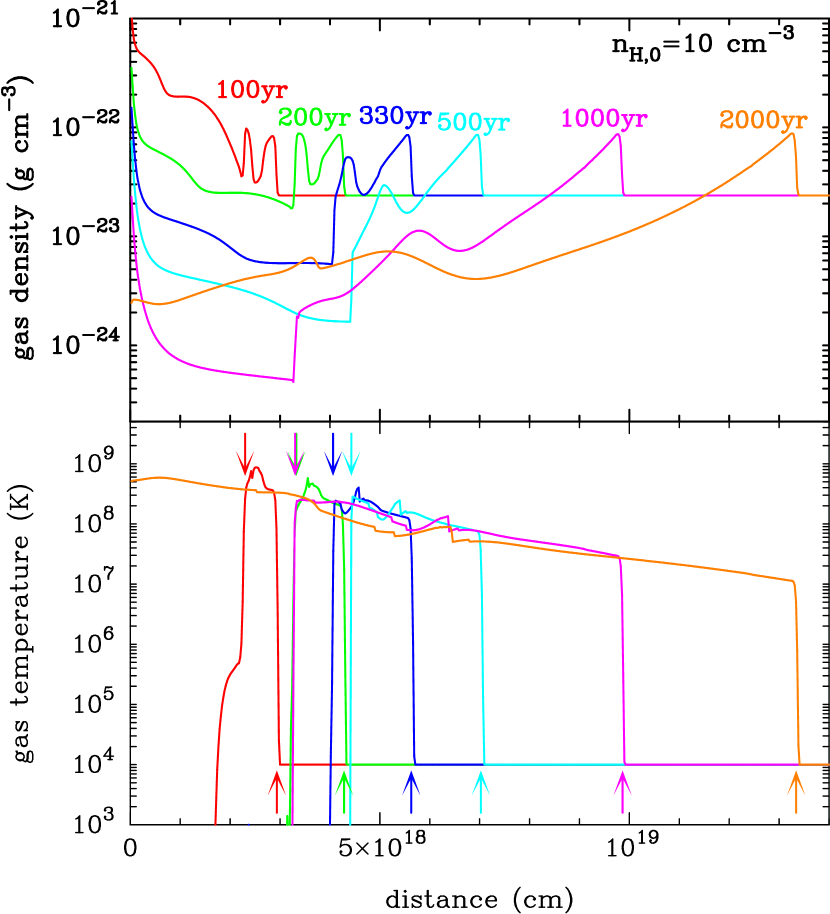
Figure 5 shows the time evolution of gas density (upper panel) and temperature (lower panel) within Type IIb SNR for the model A10 (uniform CSM with = 10 cm-3). The gas densities behind the reverse and forward shocks, whose positions are depicted by the downward- and upward-pointing arrows in the lower panel, respectively, increase by a factor of about 4, compared with the unshocked ones. The temperature of the gas swept up by both the shocks rises up to 107 K and remains over 106 K by yr. Dust grains staying in this hot gas are subject to the destruction by sputtering.
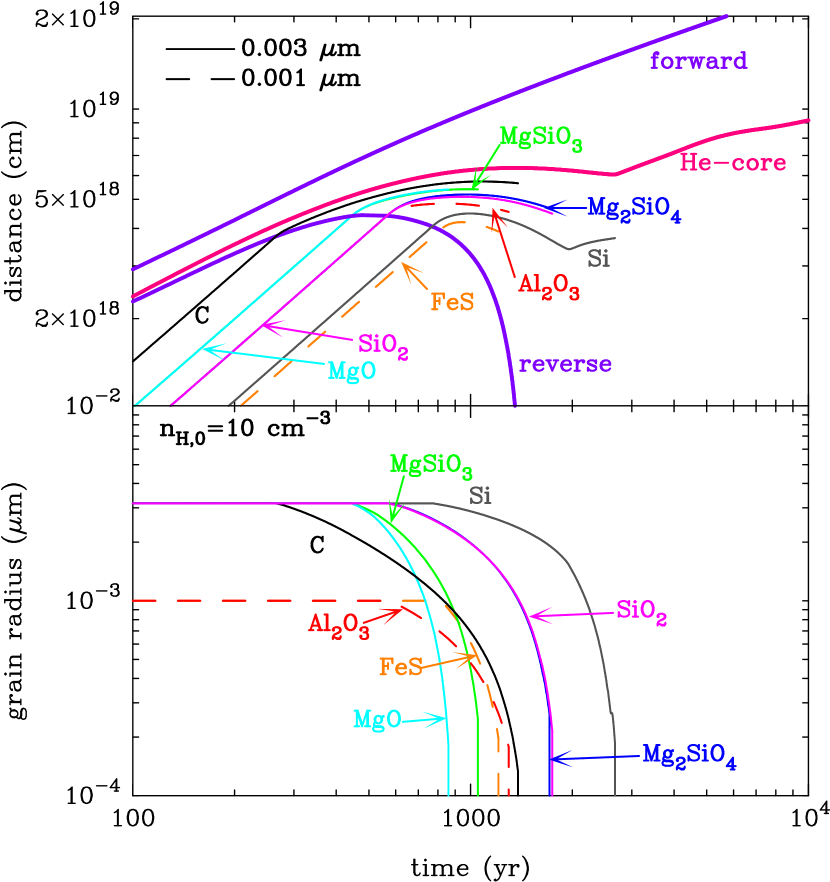
Figure 6 presents the time evolution of positions (upper panel) and radii (lower panel) of dust grains with the initial radii of 0.001 m (for Al2O3 and FeS) and 0.003 m (for the other grains) for the model A10, together with the trajectories of the reverse and forward shocks in the upper panel. In this model, the reverse shock encounters the He layer at yr, the O-rich layer at yr, and the Si-rich layer at yr. Once newly formed dust grains intrude into the shocked gas, they are efficiently decelerated by the gas drag and are quickly trapped in the hot plasma. These grains are completely destroyed and are not injected into the ISM. Actually all newly formed grains are destroyed in the postshock gas for most of the models considered in this paper. One of the reasons for this is that the radii of newly formed grains are considerably small; since the deceleration rate of dust is inversely proportional to the grain radius (e.g., Nozawa et al. 2007), dust grains with the radii of 0.01 m are easily captured by the shock-heated gas and are destroyed by thermal sputtering. Another reason is that the reverse shock can reach the He core more than 20 times earlier for SN IIb than for SNe II-P as mentioned above; although the initial gas density in the ejecta of the SN IIb is three orders of magnitude lower than those in SNe II-P (see Fig. 2b), at such an early time, the gas density in the He core of the SN IIb is still higher by a factor of 10 than those in SNe II-P at several thousands years. This leads to the frequent collisions between dust and gas and causes the efficient deceleration and destruction of dust.
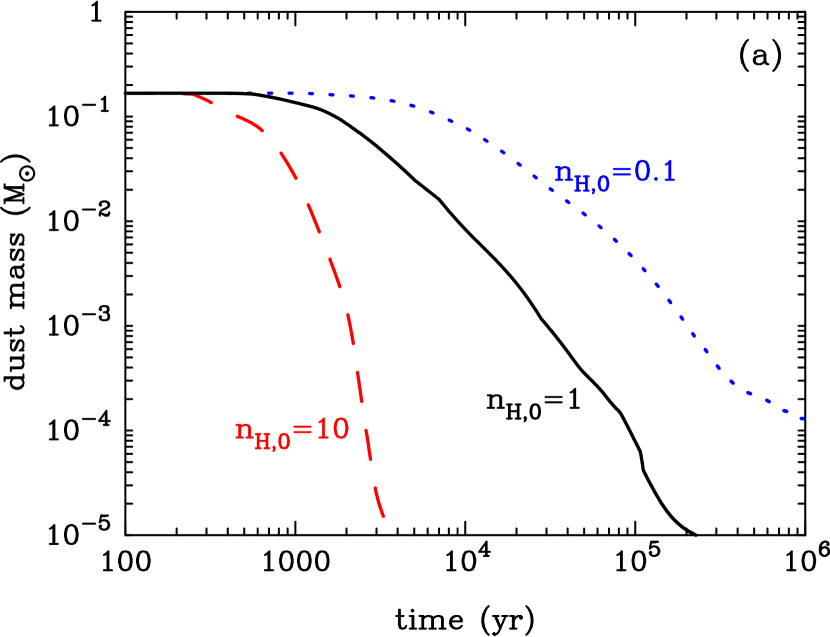
In Figure 7a we compare the time evolution of the total dust mass for the uniform CSM with = 0.1, 1, and 10 cm-3. We can see that dust grains are destroyed more efficiently and quickly for higher CSM density. This is because the increase of the gas density in the CSM leads to the earlier arrival of the reverse shock at the dust-forming region, which keeps the gas density in the He core high enough for dust grains to be eroded by sputtering effectively. For = 0.1 cm-3, C grains of 10-4 can survive at yr, while all dust grains are destroyed within yr for = 1 cm-3 and yr for = 10 cm-3.
3.2.3 Destruction of dust for the stellar wind CSM
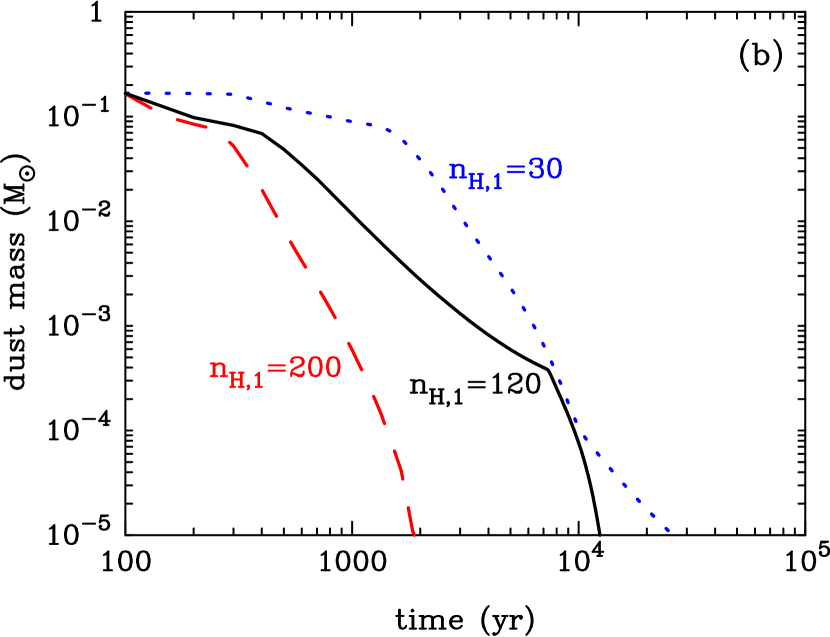
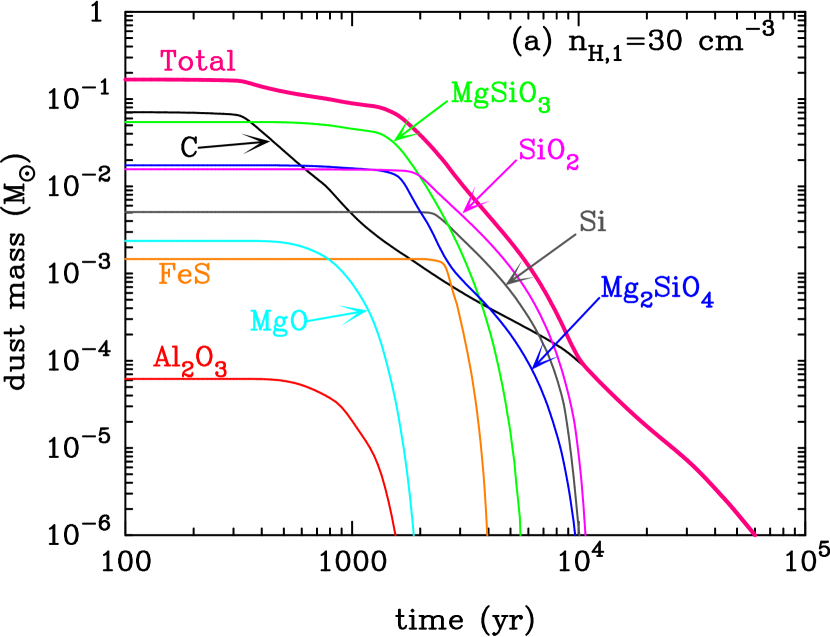
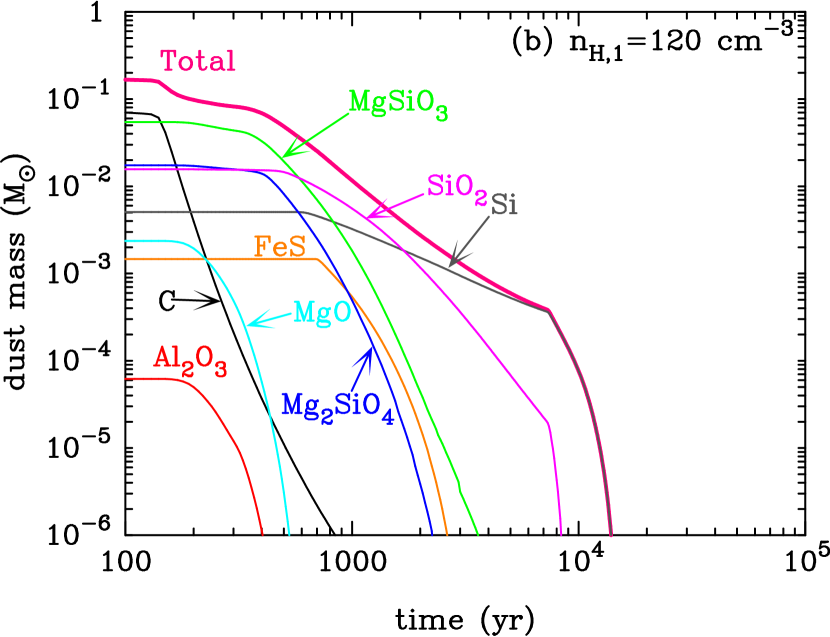
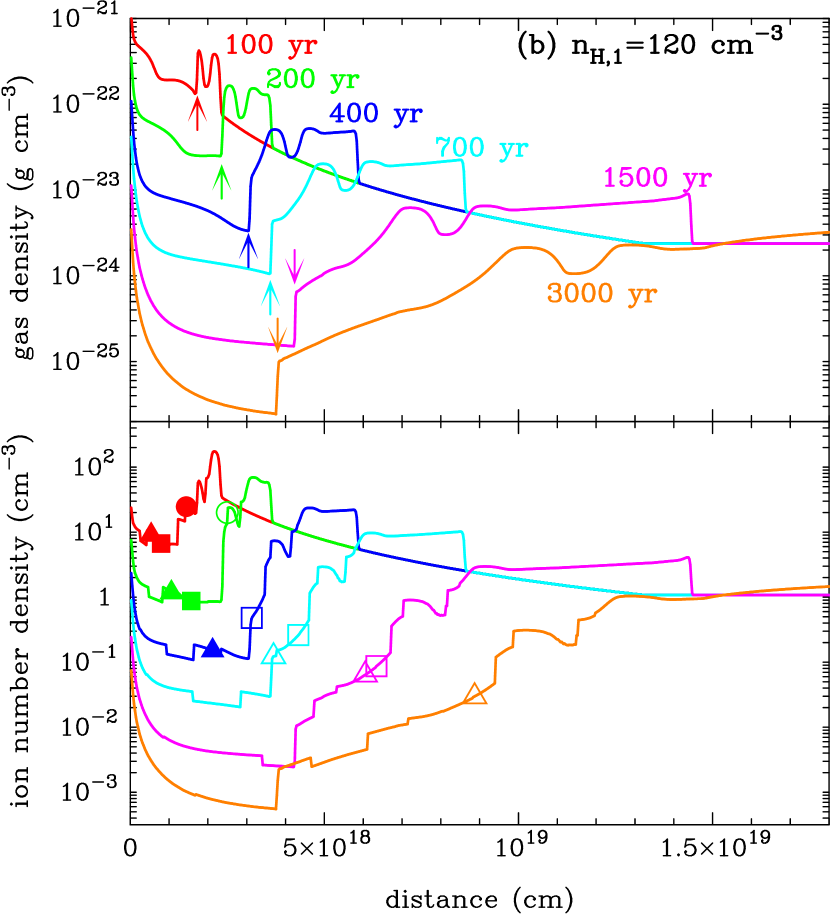
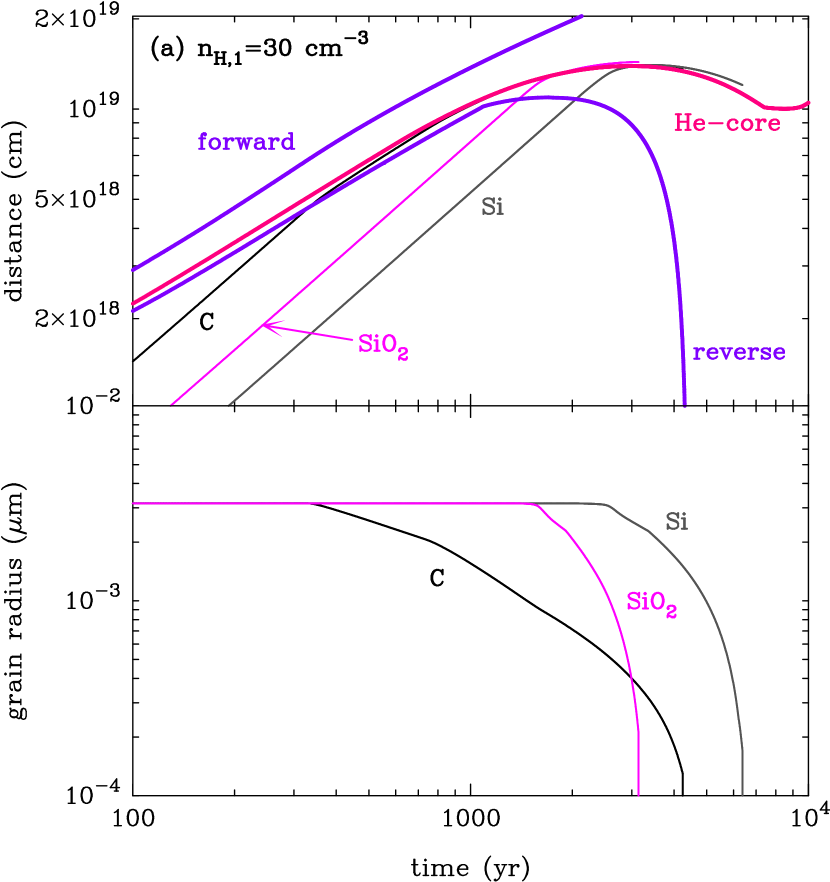
Figure 7b shows the evolution of the total dust mass in SNRs for the stellar wind CSM () models. For these models, dust grains are completely destroyed before yr. However, the evolution of dust in SNRs shows the different behavior as shown in Figures 8a and 8b, where the time evolutions of mass of each dust species for the model B30 and B120 are presented. For the model B30 with = 30 cm-3, a small amount of C grains survive after yr, whereas the other grain species are completely destroyed before yr. In the case of the model B120 with the CSM gas density four times higher than that for B30, C grains are destroyed quickly after the collision with the reverse shock, whereas the masses of some dust species such as SiO2 and Si grains decrease more slowly than those for B30.
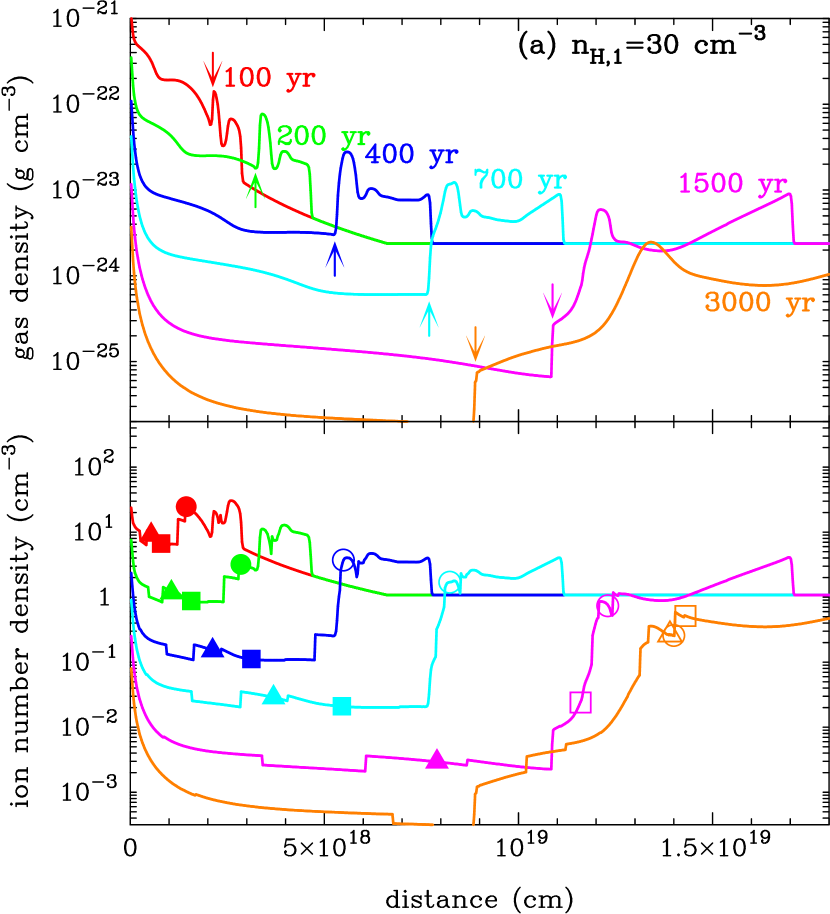
In order to explain these different behaviors of dust evolution, we show the time evolutions of density structure within SNRs for B30 and B120 in Figure 9a and 9b, respectively. Since the deceleration and erosion rates are dependent on the number density of ion, the time evolutions of the total ion number density, , are given in the lower panel in Figure 9, along with the positions of C, SiO2, and Si grains with the initial radii of 0.003 m. We also present the time evolutions of positions and radii of these C, SiO2, and Si grains in Figure 10.
For the model B30 (Figs. 9a and 10a), the SNR expands into the CSM with the density profile of during only 340 yr, and then propagates into the ISM with the constant density of cm-3. Thus, one might guess that the evolution of dust in the SNR may be quite similar to that for the model A1 with the uniform CSM of cm-3. However, as presented in Figure 7, dust grains in the ejecta are completely destroyed about 10 times earlier for B30 than for A1, because the gas density behind the reverse shock for B30 is about 8 times higher than for A1 at yr due to the fast passage of the reverse shock into the ejecta (see Table 3). In addition, the density of gas in the region swept up by the reverse shock at the initial phase remains to be quite high ( cm-3) even after yr (see Fig. 9a; hereafter, such a region is referred to as the dense gas region). As can be seen in Fig. 10a, dust grains are trapped in the dense gas region shortly after their collisions with the reverse shock and are completely destroyed by thermal sputtering. C grains formed in the inner C-rich region of the He layer collide with the reverse shock at an early epoch ( yr) and are eroded by sputtering in the denser gas than those for SiO2 and Si grains formed inside the O-rich layer. However, C grains can survive for a relatively long period, compared with SiO2 and Si grains (see Fig. 8a), because the erosion rate of C grains is smaller than the other grain species by a factor of about 5 (Nozawa et al. 2006).
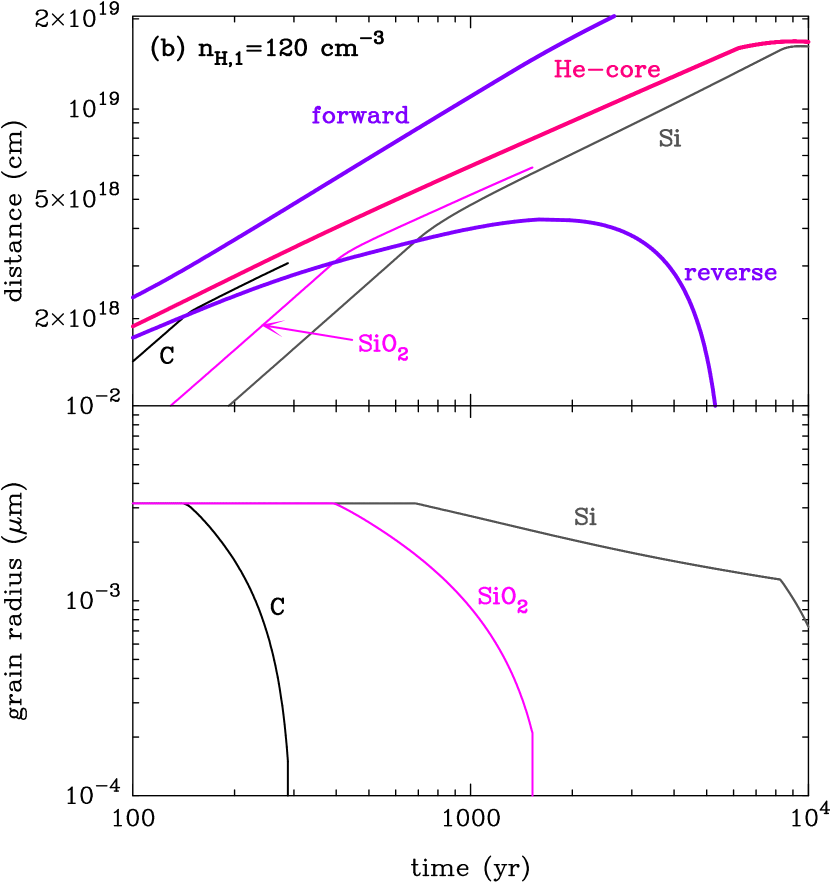
In the case of the model B120 (Figs. 9b and 10b), the reverse shock more quickly penetrates into the ejecta than B30, which results in the extended shocked region between the reverse shock front and the dense gas region (see Fig. 9b). C grains collide with the reverse shock at yr and are immediately destroyed in the shocked gas with times higher density than that for B30. SiO2 and Si grains, which encounter the reverse shock at yr and yr, respectively, intrude into the 30–40 times denser postshock gas than the cases for B30. However, the gas density is not high enough for the SiO2 and Si grains to be trapped and completely destroyed. Instead, upon collisions with the reverse shock, these grains are greatly decelerated by the gas behind the reverse shock, which prevents them from attaining the dense gas region in a short time; SiO2 grains are finally trapped in the extended shocked region and are destroyed without arriving at the dense gas region. Si grains are eroded slowly passing through the extended shocked region until they can reach the dense gas region at yr.
For the model B200, the reverse shock can propagate into the ejecta even earlier than B120. Hence, the gas density behind the reverse shock is so high that all grain species are trapped and are quickly destroyed once they are swept up by the reverse shock. These results demonstrate that the evolution of dust within SNRs strongly depends on the gas density and structure in the CSM, as well as on the composition of dust grains and their initial position in the ejecta.
In Table 3 we summarize the total mass of surviving dust in Type IIb SNRs at yr for the CSM models considered in this paper. For all CSM models except for the model A0.1, dust grains formed in the ejecta are completely destroyed before yr. Even for the model A0.1, the destruction efficiency , defined as the ratio of to the initial dust mass , is less than , in contrast to the case of SNe II-P with the thick hydrogen envelope, for which 2–80 % of dust grains can survive for the ISM with 10–0.1 cm-3 (Nozawa et al. 2007). As shown above, the difference in the evolution of dust between SNe IIb and SNe II-P SNRs is caused by the thickness of outer envelope; for SNe II-P retaining the massive hydrogen envelope, the radii of newly formed grains are larger than 0.01 m, and the arrival time of the reverse shock at the dust-forming region inside the He core is retarded, both of which act against the destruction of dust grains by sputtering. Therefore, how much amount of dust is injected into the ISM strongly depends on the type of SNe through the thickness of outer envelope, even if a large amount of dust grains can form in the ejecta of CCSNe. From the results of the present calculations, we conclude that low-mass envelope SNe such as SNe IIb and SNe Ib/c cannot be main contributors of interstellar dust as long as the gas density in the CSM is not too low ( cm-3).
4 IR Thermal Emission from dust in Type IIb SNRs
Dust grains bathed in the shocked gas inside SNRs are heated up by collisions with the hot gas and emit their thermal radiation at IR wavelengths. If the collisional heating rate and radiative cooling rate of dust are balanced, the dust can acquire the equilibrium temperature. However, in a rarefied hot plasma such as SNRs, small-sized dust grains undergo stochastic heating, which influences the emissivity and the resulting SED (e.g., Dwek 1986). In this section, based on the results of simulation of dust evolution presented in § 3 and taking account into stochastic heating, we calculate the SED by thermal emission from shock-heated dust within SNRs. The SNRs are placed at a distance of 3.4 kpc in order to compare with the observations of Cas A SNR in the next section.
4.1 Calculation of stochastic heating
The heating and thermal emission of dust are calculated by using the output of the dust evolution simulations: density and temperature of the gas as well as size, velocity relative to the gas, and number density of each dust species in each spatial bin as a function of time. We employ a Monte-Carlo method to calculate the temperature distribution functions of dust grains by stochastic heating. In the calculations, we consider only collisions with electrons for the heating of dust; under the present situation in which dust grains are quickly trapped in the hot gas, collisions with ions are much less frequent, and the heating of dust is dominated by collisions with electrons.
The fraction of incident energy that is deposited into a grain is calculated following the prescription by Dwek (1987a), and the stopping range of an electron for each grain species is calculated by the approximation formula which we derived based on those by Tabata et al. (1972) and Iskef et al. (1983). The heat capacity of each grain species is taken from Takeuchi et al. (2005), and the optical constants are taken from the following sources: C (Edo 1983), Al2O3 (Toon et al. 1976 for m and Begemann et al. 1997 for m), MgSiO3 (Dorschner et al. 1995, but the optical constants of Mg2SiO4 are used for m, see Hirashita et al. 2008), Mg2SiO4 (Semenov et al. 2003), SiO2 (Philipp 1985), MgO (Roessler & Huffman 1991), FeS (Semenov et al. 2003), Si (Piller 1985). We re-bin the size of dust into 12 bins from 1 Å to 0.1 m and divide the shocked region into 20 spatial bins weighted by the mass of the gas, because the calculation is too time-consuming. We have verified that even if the number of re-binned size (spatial) bin increases to 20 (50), the resulting SEDs are virtually the same.
4.2 Time evolution of thermal emission from dust
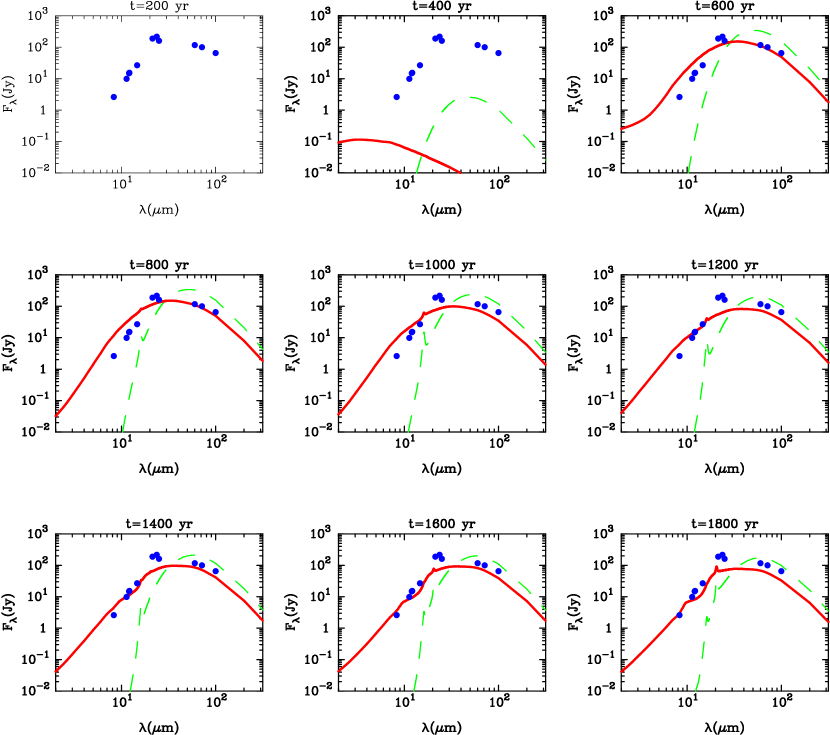
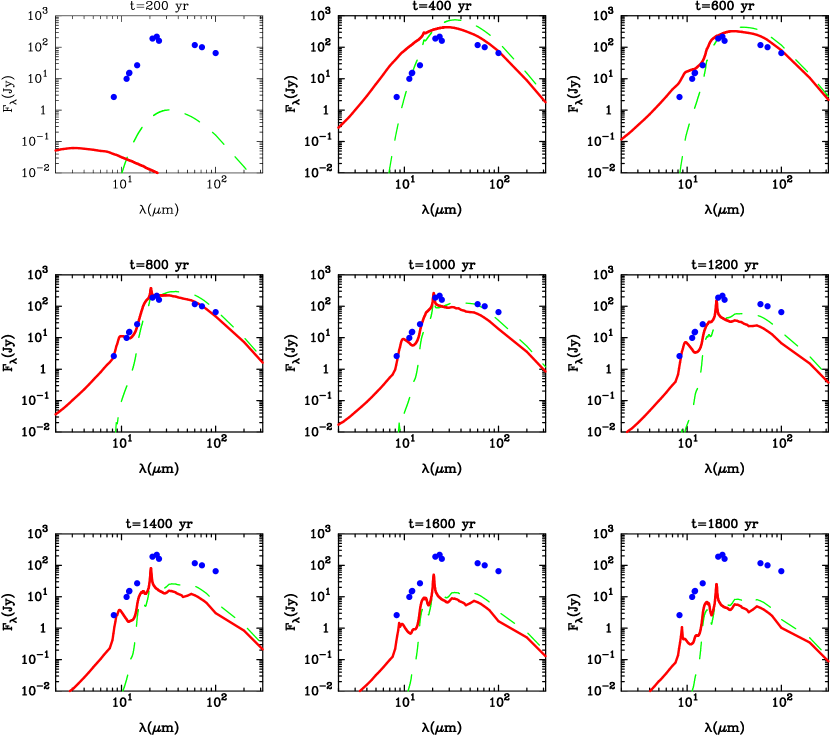
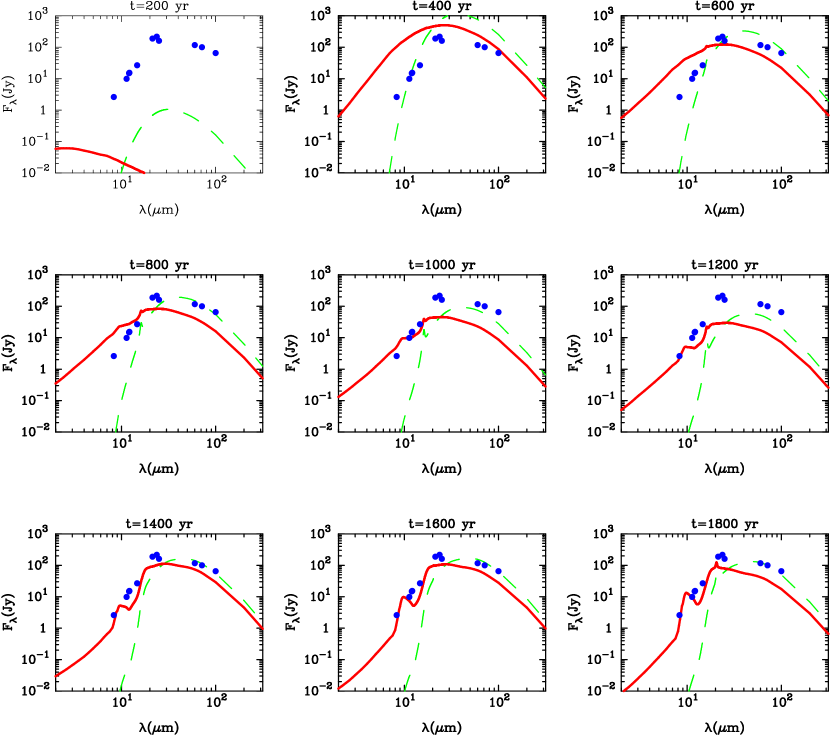
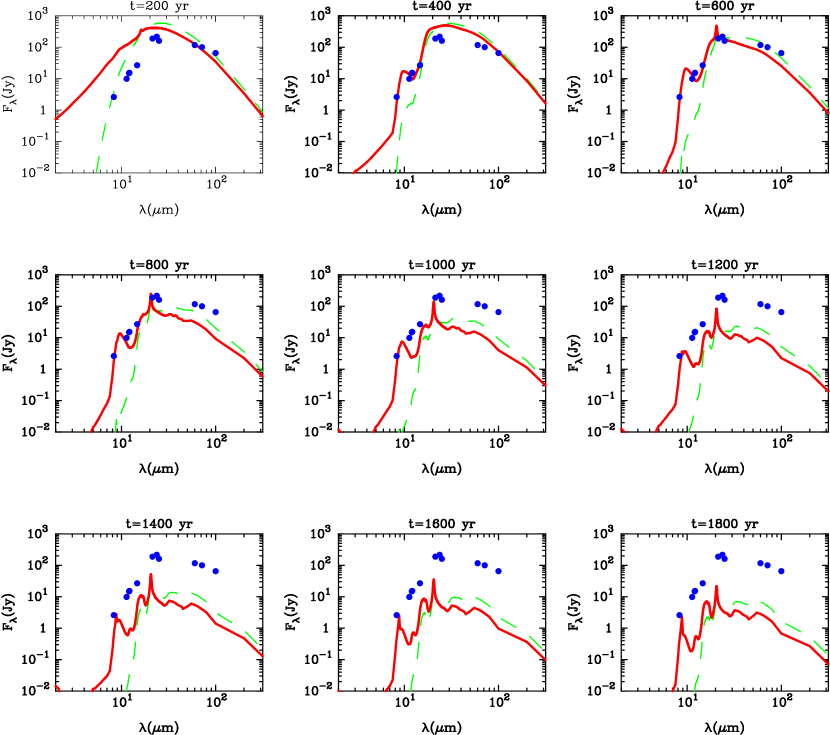
Figures 11–14 show the time evolution of SEDs by thermal emission from shocked dust for different CSM models every 200 yr in the range from 200 yr to 1800 yr after the explosion. In these figures, the solid curves display the SEDs taking into account stochastic heating, and the dashed curves the SEDs calculated by assuming the equilibrium without stochastic heating. We can see that the SEDs taking account of the stochastic heating are strongly different from those with the equilibrium temperatures, especially at wavelengths shorter than m. This implies that the effect of stochastic heating is very important in modelling the IR SED by dust emission within SNRs, as demonstrated by Dwek (1986).
For the model A1 with the uniform gas density (Fig. 11), the reverse shock hits the He core at yr after the explosion. The mass of C grains formed in the outer C-rich region of the He layer is too small ( ) to emit the thermal emission significantly during 200–400 yr. At yr, thermal emission from a large amount of C grains formed in the inner C-rich part of the He layer always dominates the SED, because the gas density in the SNR is not high enough to destroy C grains efficiently. The reverse shock reaches the O-rich layer at yr, but the emission features of silicate and oxide grains are inconspicuous, being overwhelmed by thermal emission from C grains.
For the higher CSM density of the model A10 (Fig. 12), C grains are more efficiently destroyed by sputtering than those in the model A1, and the emission features from other dust species get prominent with time. The reverse shock encounters the O-rich layer at yr, and the emission feature of Mg-silicates (MgSiO3 and Mg2SiO4) around m begins to be noticeable at yr. The feature of SiO2 at m is outstanding after yr, and the emission features from Si and FeS grains appear after yr. Because of the efficient destruction of dust, the thermal emission continues to decrease with time.
In the case of the model B30 with the stellar wind’s density profile (Fig. 13), the reverse shock collides with the He core at yr, which is earlier than in the model A10. Thermal emission from C grains dominates the SED by yr, and after then the contributions from Mg-silicates become recognizable. However, stochastic heating of small C grains still contributes to the SED at m, because some C grains can survive even after yr owing to the low gas density ( cm-3) at a large distance in comparison with the model A10. We can see that the flux densities significantly increase between 1200 yr and 1400 yr in this model. This is due to the fact that during this time interval, the reverse shock has swept up the ejecta region where a large amount of silicate grains are formed ( , see Fig. 3a). The dust grains swept up by the shocks continue to be eroded by sputtering, while the reverse shock continues to intrude into the inner He core and to supply newly formed dust grains to the shocked gas. Thus, the time evolution of SEDs is determined by the balance between the amount of dust destroyed in the hot gas and the amount of dust swept up by the reverse shock.
For the model B120 (Fig. 14), the reverse shock can quickly propagate into the ejecta, and arrives at the He core, O-rich layer, Si-rich layers at 48 yr, 150 yr, and 560 yr, respectively. Thus, we can see the quick evolution of the SED characterized by the features of various grains species. Since the gas density is significantly high, especially at an early phase, C grains are quickly destroyed as can be seen from the evolution of SED at m, and the excess by stochastic heating of small C grains disappears at yr.
The results of calculations clearly demonstrate that the time evolutions of IR emission from dust heated up in SNRs are sensitive to the density of gas as well as the density profile in the surrounding medium. The ambient gas density controls the passage of the reverse shock into the ejecta and affects the destruction by sputtering and stochastic heating of dust in the hot gas. Hence, the resulting IR SED well reflects the evolution of dust in SNRs and also holds key information on the density structure in the ambient medium. In other words, the temporal evolution of SED from dust in shock-heated gas can be a very useful probe for investigating the properties of dust in SNRs as well as the density structure in the CSM and thus the mass-loss history of the progenitor star during the late phase of its evolution.
5 Applications to the Cas A SNR
In this section, we apply the results of calculation for dust evolution and the resulting SEDs presented in § 3 and § 4 to Cas A SNR, to give an insight into the composition and mass of dust residing in Cas A SNR and to get an implication on the mass-loss rate of the progenitor. After briefly summarizing the observed characteristics of Cas A relevant to this study, we present the comparison of the calculated SEDs with the observed one.
5.1 Cas A SNR
Cas A is one of the best studied Galactic SNRs at a broad range of wavelengths spanning from radio to -ray. Its estimated age is 330 years (Fesen et al. 2006a; Thorstensen et al. 2001), and the distance to Cas A is determined to be 3.4 kpc from the proper motion of fast moving knots (FMKs, Reed et al. 1995). The X-ray observations with the Chandra have resolved the radii of the reverse and forward shocks to be and , respectively (Gotthelf et al. 2001), which correspond to pc and pc at a distance of 3.4 kpc.
Recently Krause et al. (2008) obtained an optical spectrum of Cas A SN around the maximum brightness via the scattered light echo, and concluded that the Cas A SN was of Type IIb, originated from a supergiant that had lost most of its hydrogen envelope prior to the explosion as has been suggested by the close binary scenario for SNe IIb (e.g., Nomoto et al. 1995). The numerical simulations (Chevalier & Oishi 2003; Young et al. 2006) and the discovery of FMKs containing some hydrogen (Fesen & Becker 1991; Fesen 2001) also seem to strongly support this conclusion.
The presence of dust formed in the ejecta has been confirmed by the IR observations with the IRAS (Dwek et al. 1987b), the ISO (Lagage et al. 1996), and the Spitzer (Hines et al. 2004). The IR spectra of FMKs taken by the ISO allowed us to examine the composition of dust, leading to the conclusion that the main species of newly formed dust in Cas A are silicate and/or oxide grains (Arendt et al. 1999; Douvion et al. 2001).
There has been a continuing controversy about the amount of dust residing in Cas A SNR; the dust mass derived from the observations described above was smaller than . Rho et al. (2008) estimated the mass of dust to be 0.02–0.054 from the spectral mapping covering the entire region of Cas A by the Spitzer. Based on the submillimeter (submm) observation with the SCUBA, Dunne et al. (2003) have reported the detection of 2–4 of cold dust in Cas A. Dwek (2004) argued that this cold dust emission is ascribed to metallic needles of formed in the ejecta. On the other hand, the MIPS 160 m map of Cas A, complemented by CO and OH line observations, have demonstrated that the detected submm emission is originated from interstellar dust in the foreground molecular clouds (Krause et al. 2004), and the mass of cold dust associated with Cas A is estimated at most to be 0.2 (Krause et al. 2004) and 1.5 (Wilson & Bartlra 2005).
Although the existence of a peculiar species of cold dust with 1 is also proposed from submm polarization (Dunne et al. 2009), we do not here consider the measurements at wavelengths longer than 160 m. In what follows, we compare the calculated SEDs with the synchrotron-subtracted IR flux densities at 8–100 m taken from the photometric observations tabulated in Hines et al. (2004).
5.2 Comparison with the observations of Cas A
5.2.1 IR emission from shock-heated newly formed dust
We first compare the results for the uniform CSM with the observations of Cas A. For cm-3, IR emission is dominated by stochastically heated small C grains throughout the age of the remnant, as shown in § 4.2. This causes the excess emission over the observed SED at m until yr, and the calculated SED cannot reproduce the observational data. The fact that the C grain-dominated IR SED does not match with the IR measurements of Cas A is also pointed out by Bianchi & Schneider (2007).
For the case of = 10 cm-3, the calculated SED at yr is in good agreement with the IR observations of Cas A (see Fig. 12). The mass of shock-heated dust at yr is 0.048 , which is consistent with the dust mass of 0.02–0.054 in Cas A estimated from the observations with the Spitzer (Rho et al. 2008). The comparison strongly suggests that the dominant species of dust responsible for the observed SED are silicate grains and that the reverse shock has already reached the inner O-rich layer in the ejecta. However, the remnant age of 800 yr is much older than the age of Cas A, and the SED at yr does not agree with the observations. We also found that any uniform CSM models with gas density higher than cm-3 cannot reproduce the observed SED, partly because the dust grains are quickly destroyed and partly because the temperature of dust is too high. Thus, we conclude that thermal emission of dust grains heated up in SNRs expanding into the uniform CSM cannot explain the observed IR SED of Cas A.
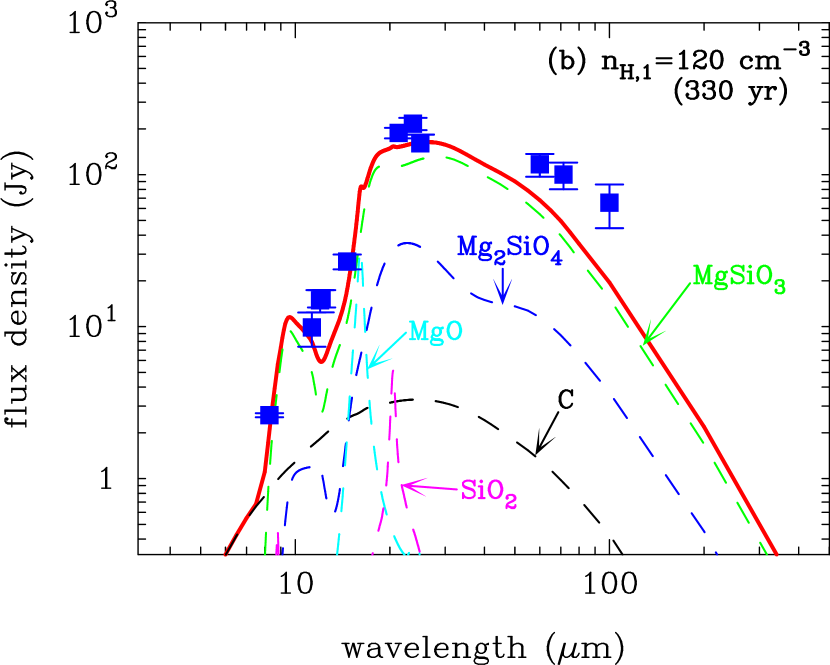
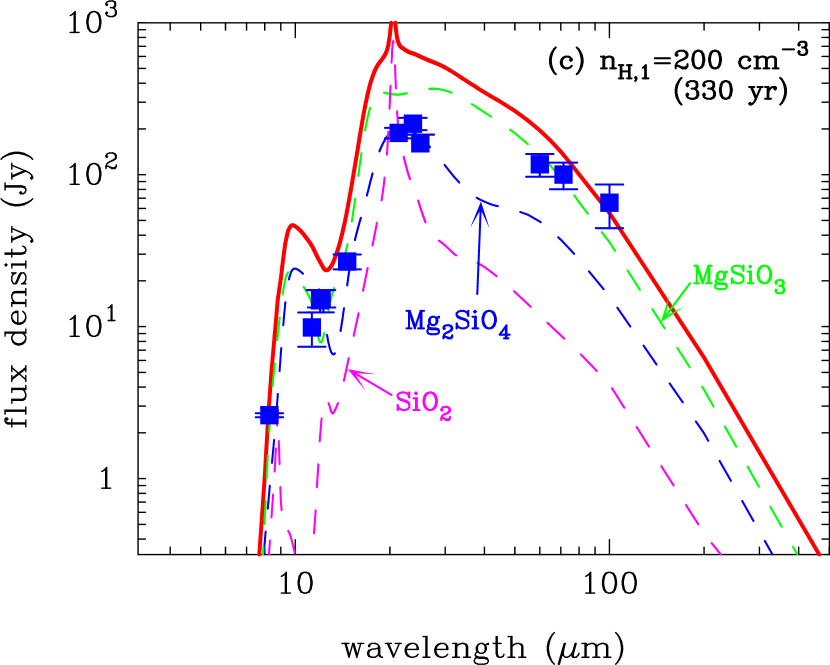
Next we move to the comparison of the results for the CSM density structure of . Figures 15a–15c present the calculated SEDs at yr for = 30, 120, and 200 cm-3. In these figures, we also show the contribution of each dust species to the total flux densities. Note that the SEDs calculated without stochastic heating are not shown in these figures, since they can never reproduce the observations of Cas A for any CSM models.
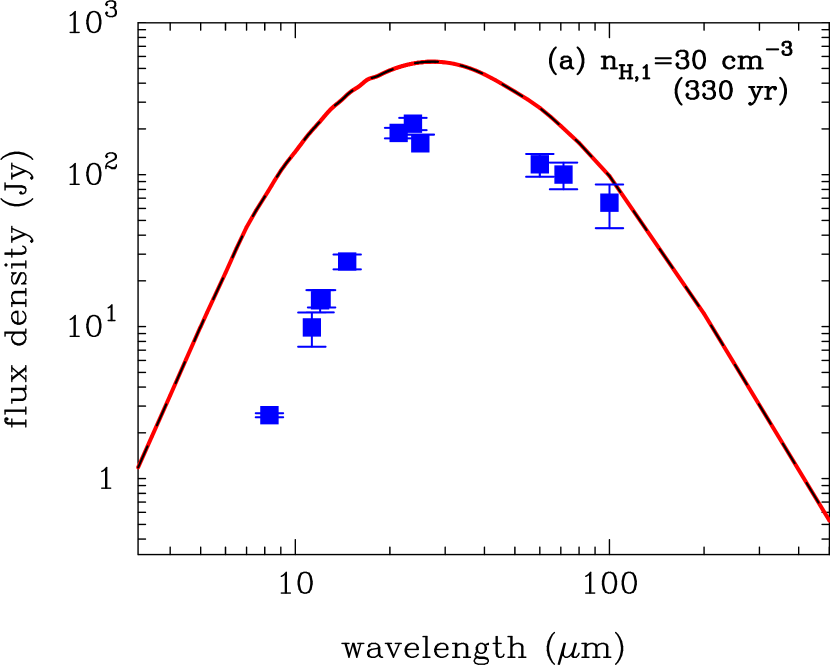
The case of cm-3 corresponds to yr-1 for km s-1, and the density structure has been suggested by Chevalier & Oishi (2003) to reproduce the observed radii of the reverse and forward shocks derived from the X-ray observations (Gotthelf et al. 2001). Our simulation also approximately reproduces the observed shock radii for Cas A: 1.5 pc for the reverse shock and 2.2 pc for the forward shock. However, in this case, the reverse shock has not yet reached the O-rich layer at yr (see Table 3). The calculated flux densities from the shock-heated C grains of 0.05 are much higher than the observations at the whole mid-IR wavelengths.
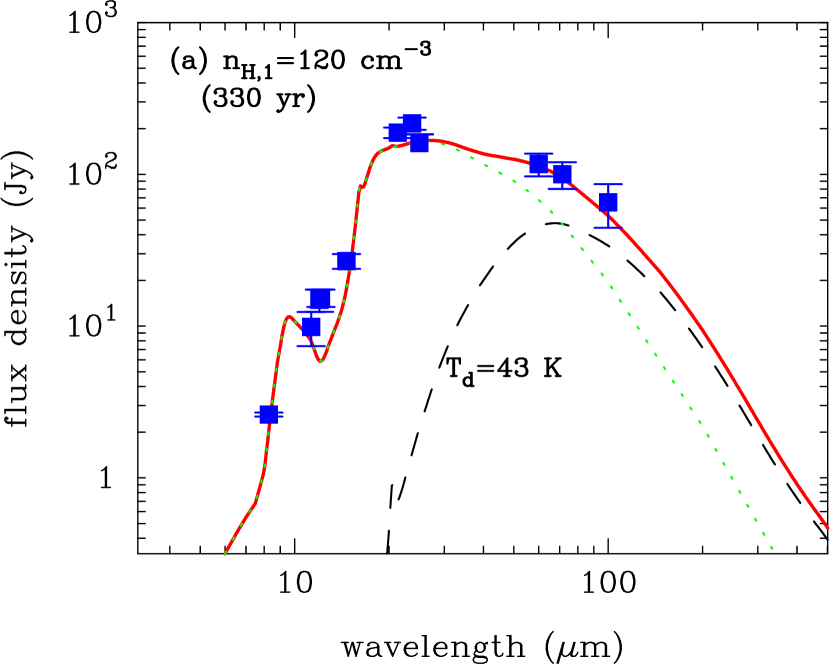
With cm-3, the calculated SED reasonably reproduces the observed SED at m, although there is some discrepancy at m. The SED also predicts the considerably lower flux densities at m, which can be recovered by considering the unshocked dust as will be discussed later. The dust species most contributing to the SED is MgSiO3, which is one of the major grain species in Cas A presumed from the IR spectra (Douvion et al. 2001; Rho et al. 2008). Mg2SiO4, SiO2, and MgO grains more or less contribute to the SED, and C grains partly contribute at m as well. The total mass of shocked dust grains is 0.008 , which is smaller than the estimate by Rho et al. (2008) but is larger than those by the other IR observations.
For cm-3, the calculated SED does not match with the observations, especially at 20–60 m. In this case, the reverse shock invades deeper layers in the ejecta and sweeps up larger mass (0.028 ) of silicate grains, compared with the case of cm-3. Therefore, the derived SED produces the much more flux densities than the observations. We also calculate the thermal emission from shocked dust for the denser CSM than cm-3, but the outcomes suffer from much less flux densities at m because of the efficient destruction of dust and the relatively high temperature of dust. In addition, in such dense cases, the shock radii are much smaller than the observations. Hence, we conceive that the cases of cm-3 are unlikely as the density structure around Cas A.
In summary, our results indicate that the stellar wind’s density profile with cm-3 is most favorable to account for the observed IR emission at the age of Cas A. The corresponding mass-loss rate yr-1 is at most a factor 4 higher than the mass-loss rates estimated for SNe IIb: (3–4) yr-1 (Suzuki & Nomoto 1995; Fransson et al. 1996) deduced for SN 1993J (at cm) and yr-1 for Cas A (Chevalier & Oishi 2003). In view of the uncertainties involved in the density gradient and clumpiness in the CSM, these estimated mass loss rates can be regarded as being consistent. On the other hand, the result for cm-3 predicts quite smaller shock radii than those for Cas A (see Table 3). The discrepancy in the shock radii as well as the mass-loss rate could be considered to be partly caused by the difference in the explosion energy and the thickness of the hydrogen envelope of the SN model used in this study.
It should be emphasized that the IR emission from newly formed dust grains that are heated up in the hot plasma inside SNRs can reproduce the mid-IR ( 8–30 m) SED of Cas A without any fine-tuning. On the other hand, the obtained results for cm-3 significantly underestimate the flux densities at longer wavelengths ( m). Although the thermal emission from cooler dust in the dense optically emitting knots is expected to mitigate this difference, modelling of such a dust emission may need a sophisticated radiative transfer simulation and is beyond the scope of this paper. Hereafter, we discuss the contributions from the following two potential sources to the observed SED at m: (1) the circumstellar (CS) dust grains that was formed in the mass-loss wind during the evolution of the progenitor star and then were swept up by the forward shock, and (2) the newly formed dust that were formed in the ejecta but have not been yet swept up by the reverse shock.
5.2.2 Contribution from preexisting CS dust
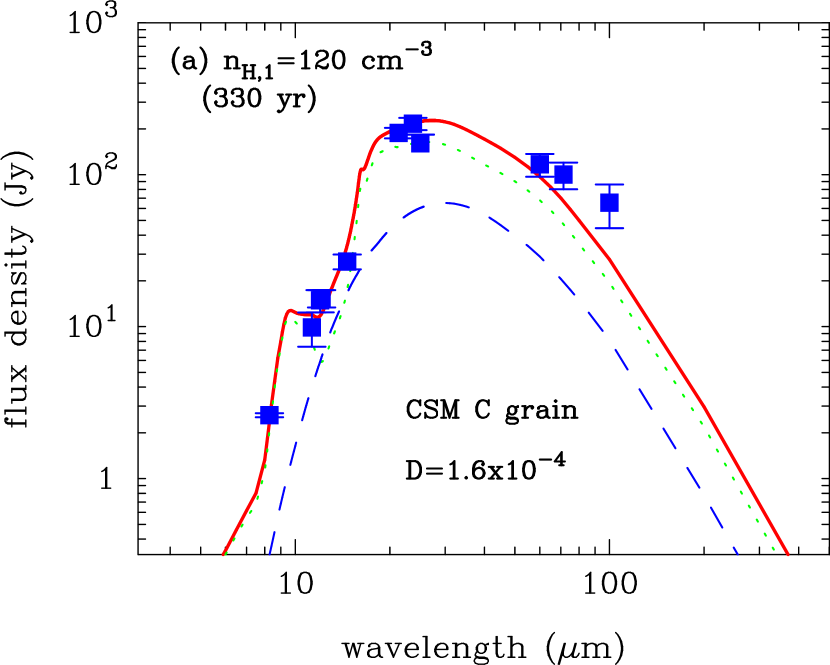
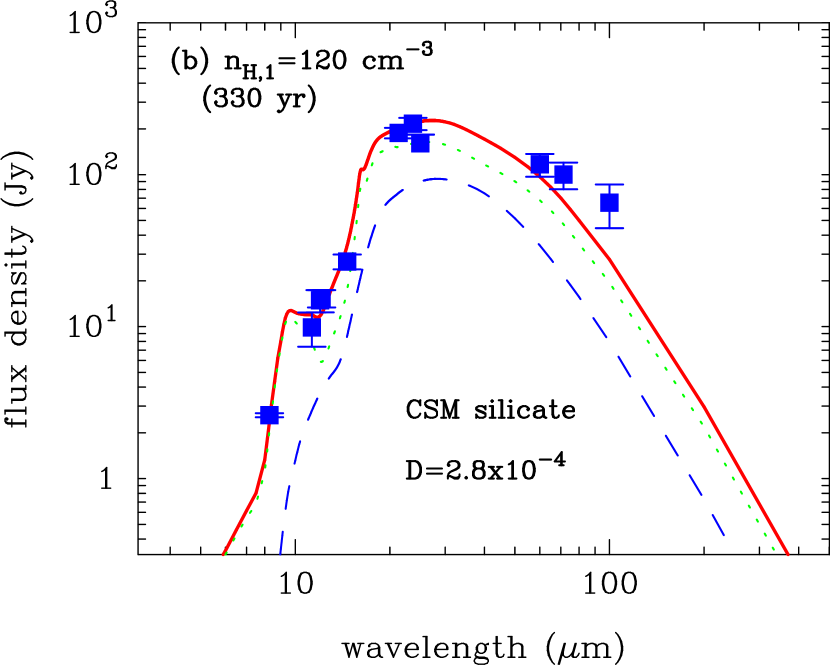
In order to examine the contribution from the preexisting CS dust, we simulate the destruction and heating of the shocked CS dust for the density structure of the CSM corresponding to the mass-loss rate of yr-1. The composition of the CS dust is considered to be either carbonaceous or silicate depending on the C/O ratio in the stellar wind. Carbonaceous grains condense in C/O , which is realized in the winds of carbon-rich Wolf-Rayet stars. Silicate grains are expected to form in the wind of a supergiant, where the abundance ratio of heavy elements is nearly solar with C/O . Although a supergiant is a more likely progenitor of Cas A (§ 5.1), we consider here, as the dust composition in the CSM, both amorphous carbon and astronomical silicate, for which the optical constants are taken from Edo (1983) and Draine & Lee (1984), respectively. For the size distribution of dust, we adopt the MRN size distribution (, Mathis et al. 1977) with the upper and lower limits of m and m, respectively. The dust-to-gas mass ratio in the CSM is assumed to be constant and is taken as a free parameter.
Figure 16 illustrates the contribution from CS carbon (Fig. 16a) and astronomical silicates (Fig. 16b) for the case of cm-3, where the ejecta-dust and CS dust components are depicted by the dotted and dashed lines, respectively. The dust-to-gas mass ratios adopted here are for carbon and for silicate because higher dust-to-gas mass ratios cause the excess emission over the observed SED at m. At yr, the masses of shock-heated CS carbon and silicate grains are and , respectively, and both grain species have typical temperature of 100 K. Thus, we can see that both grain species can only contribute to the SED at m with the peaks around m, and cannot compensate the flux densities at m. This means that the observed SED cannot be improved by the contributions from CS grains even if we consider any mixture of these CS grains and dust-to-gas mass ratios different from those considered here. Therefore, we suppose that the IR emissions from shocked CS grains should not significantly contribute to the IR SED of Cas A and that a small content of CS dust may be due to low condensation efficiency of dust in the mass-loss wind and/or due to partial destruction of CS dust by the strong radiation associated with the shock breakout at the explosion (e.g., Blinnikov et al. 1998). We emphasize that the thermal emission from CS dust alone can never reproduce the observations of Cas A for any models considered in this paper.
5.2.3 Contribution from unshocked ejecta-dust
As shown in § 5.2.1, in the case of cm-3, only 0.008 of newly formed dust grains is heated in the shocked gas at yr, and 0.072 of dust grains remains cold without being swept up by the reverse shock (see Table 3). These unshocked dust grains are expected to be heated up by absorbing the X-ray and UV/optical photons generated from the shock-heated plasma and dense knots, and they may radiate their thermal emission with the higher temperature than that (20 K) in the diffuse ISM and contribute to the SED at IR wavelengths. In fact, the presence of cold dust in the unshocked ejecta of Cas A SNR has been suggested from the association of a “featureless dust” component with the Si II emission from the central part of the remnant (Rho et al. 2008). Since the dedicated calculations of radiative transport at X-ray to optical wavelengths is beyond the scope of this paper, we evaluate the contribution of the unshocked dust to the IR SED, assuming the same temperature for all unshocked grains.
Figure 17 shows the contribution from unshocked newly formed dust, together with the contribution of shock-heated warm dust at 330 yr (Fig. 17a) and 340 yr (Fig. 17b) for cm-3. The age of 340 yr is the expected age of Cas A in the case where the forward shock has not been decelerated (Thorstensen et al. 2001; Fesen et al. 2006a). As can be seen from the figures, if the unshocked dust grains are heated up to a temperature around 40 K, their thermal emission can significantly contribute to flux densities at m and can successfully reproduce the observations of Cas A. Thus, the IR SED observed for Cas A can be naturally explained by the shocked warm component and unshocked cold component of newly formed dust obtained by a series of our calculations. We also mention that the calculated IR emission from shocked warm dust at yr slightly increases from that at yr, giving a better fit at m. This indicates that the IR flux from Cas A can change during a short time interval of 10 yr.
Finally, it should be pointed out here the followings: We show that the IR observations of Cas A are successfully reproduced by 0.008 shocked dust and 0.072 unshocked dust, considering the destruction and heating of newly formed dust in the SNR for cm-3. Although the derived dust mass in Cas A SNR is superficially large enough to explain a vast amount of dust observed in the host galaxies of high-redshift quasars at , these dust grains would be completely destroyed in yr and could not be supplied into the ISM, as demonstrated in § 3.2, if the CSM would be more or less spherical. We also should note that if the CSM would not be spherical, a part of dust grains in the unshocked ejecta could be ejected into the ISM.
6 Conclusion
We investigate the formation of dust in the ejecta of a hydrogen-poor SN IIb, adopting the SN model with ergs, , and . Then we explore the evolution of newly formed dust in the hot gas inside the SNR by considering the two sets of density profile for the spherical CSM. Based on the results of dust evolution in SNRs, we also calculate the time evolution of thermal emission from the shocked dust within the SNR and compare the results with the observations of Cas A. The results of our calculations are summarized as follows.
(1) In the unmixed ejecta of the SN IIb, various dust species can condense depending on the elemental composition in each layer at 300–700 days after the explosion. The total mass of newly formed dust is as large as 0.167 , and the composition and mass of dust formed in the SN IIb are similar to those in SNe II-P. However, the mass of the hydrogen envelope of the SN IIb is too small to significantly decelerate the expansion of the He core. Thus, the gas density in the He core is too low for large-sized grains to be produced, and the resulting average radius of dust is confined to be smaller than 0.01 m. We propose that the size of dust formed in the SNe with the low-mass envelope such as SNe IIb as well as the envelope-stripped SNe Ib/Ic is much smaller than that formed in SNe II-P with the massive hydrogen envelope.
(2) The evolution of dust within SNRs is strongly affected by the mass of the outer envelope and the gas density in the CSM. The less massive outer envelope and/or the denser CSM lead to the earlier arrival of the reverse shock at the He core, and causes the quicker and more efficient destruction of newly formed dust in the denser hot gas. In the Type IIb SNR, as a result of the small size of dust and the early propagation of the reverse shock into the dust-forming region, all newly formed dust grains are destroyed in the shocked gas without being injected into the ISM for the ambient gas density of cm-3. If the CSM is more or less spherical, our results imply that low-mass envelope SNe do not play a major role in the dust enrichment in the ISM.
(3) The time evolution of IR SEDs by thermal emission from shocked dust in SNRs well reflects the evolution of dust through the erosion by sputtering and stochastic heating. The destruction and heating processes of dust in the hot gas are heavily affected by the ambient gas density that affects the passage of the reverse shock into the ejecta. Thus, the comparison of theoretically modelled SEDs and observed IR SEDs can be used to diagnose the size and mass of dust in SNRs and the density structure surrounding the SNe. These in turn provide us with some hints on the formation process of dust in the ejecta and the mass-loss activity of the progenitor stars during the late evolution.
(4) The IR SED observed for Cas A can be reasonably reproduced by the shocked warm dust with and unshocked cold dust with , both of which were newly formed in the ejecta. The CSM density required to reproduce the observed SED corresponds to the steady stellar wind of a supergiant with the mass-loss rate of yr-1. This mass-loss rate is consistent with those estimated for the progenitors of SN 1993J and Cas A within a factor of 2–4. It should be emphasized that these conclusions are the natural outcomes derived by the self-consistent treatments of formation, destruction, and heating of dust given in this study.
The result of the dust formation calculation shows that the total mass of dust formed in the ejecta is 0.167 , which is much larger than the mass estimate of dust deduced from the observations of nearby dust-forming SNe. From the comparison of calculated SEDs with the observed SED, we predict that in Cas A SNR about a half of newly formed dust grains has already been swept up by the reverse shock and most of them had been destroyed, while the other half has not yet been swept up by the reverse shock. The mass of this unshocked dust (0.072 ) is in good agreement with the upper mass limit of cold dust (0.2 ) in Cas A estimated by Krause et al. (2004). On the other hand, our calculation demonstrates that all dust grains formed in Cas A might be completely destroyed later on and might not be injected into the ISM, if the CSM would be more or less spherical (see below). Thus, the SN IIb that formed Cas A might not be a representative of SNe as major sources of interstellar dust, but Cas A could have remained as a unique and ideal object for investigating formation and evolution processes of dust in SNe.
We should bear in mind that all calculations here are performed for the spherically symmetric forward and reverse shocks propagating into the homogeneous CSM and stratified ejecta, respectively. In the binary scenario for SNe IIb (Nomoto et al. 1995, 1996), the formation of aspherical CSM is predicted to be as follows. The close binary consists of a massive SN IIb progenitor and a small-mass companion star. In the common envelope phase, the companion star spirals into the envelope of the SN IIb progenitor, which causes extensive mass loss from the H-rich envelope of the progenitor in the direction of equatorial plane. The resultant CSM might have a ring-like structure as seen in SN 1987A, a torus, or a thick disk. In reality, the CSM around SN 1993J is considered to be more like torus shape (e.g., Fransson et al. 2005). Then since the ejecta of polar direction cannot strongly interact with the CSM (e.g., Maeda et al. 2002), the ejecta of SN 1993J can be composed of the reverse-shocked ejecta and the unshocked ejecta. Thus, if CSM is spherical, dust can be totally destroyed. If CSM is non-spherical like SN 1993J, unshocked dust can partially be ejected.
In addition, the IR and X-ray observations of Cas A have shown that the ejecta of Cas A are very clumpy and asymmetric (Willingale et al. 2002; Ennis et al. 2006; Smith et al. 2009) with the inverted compositions as represented by Fe-rich materials overtaking the outer layer (e.g., Hughes et al. 2000). This indicates that some dust species may encounter the reverse shock at different times and different gas densities than suggested in this paper. Furthermore, if newly formed grains would reside in dense clumps, it might be possible that a part of them can survive the destruction and be injected into the ISM. Although the mass of shocked and visible material is believed to roughly account for all the mass ejected in the explosion, the IR spectral mapping observations of the entire region of Cas A SNR suggest the presence of unshocked ejecta materials in the central region of the remnant (Rho et al. 2008; Smith et al. 2009). However, it has been difficult to estimate how much amount of dust is there in the unshocked region from the observations covering the wavelengths of m, as pointed out by Rho et al. (2008). Since the mass of dust in Cas A is likely to be dominated by the unshocked low-temperature dust, the comprehensive far-IR observations at m are necessary to reveal the mass of dust formed in the Cas A SN. 111After this paper was submitted, an article by Sibthorpe et al. (2009) appeared on astro-ph (arXiv/0910.1094), reporting the presence of a cool emission component peaked near the center of Cas A in the 90 m image obtained by the AKARI. They suggest that this emission comes from unshocked newly formed dust in Cas A and estimate its mass to be 0.03–0.06 . Unfortunately, Cas A suffers from the contamination from the interstellar dust in the foreground molecular clouds, but the Herschel will be able to give more critical clues on the mass of cold dust in Cas A.
References
- Arendt et al. (1999) Arendt, R. G., Dwek, E., & Moseley, S. H. 1999, ApJ, 521, 234
- Begemann et al. (1997) Begemann, B., Dorschner, J., Henning, Th., Mutschke, H., Gütler, J., Kömpe, C., & Nass, R. 1997, ApJ, 476, 199
- Bianchi & Schneider (2007) Bianchi, S., & Schneider, R. 2007, MNRAS, 378, 973
- Blinnikov et al. (1998) Blinnikov, S. I., Eastman, R., Bartunov, O. S., Popolitov, V. A., & Woosley, S. E. 1998, ApJ, 496, 454
- Boissier & Prantzos (2009) Boissier, S., & Prantzos, N. 2009, A&A, 503, 137
- Borkowski (1996) Borkowski, K. J., Szymkowiak, A. E., Blondim, J. M., & Sarazin, C. L. 1996, ApJ, 466, 866
- Chevalier & Oishi (2003) Chevalier, R. A., & Oishi, J. 2003, ApJ, 593, L23
- Deneault et al. (2003) Deneault, E. A.-N., Clayton, D. D., Heger, A. 2003, ApJ, 594, 312
- Dorschner et al. (1995) Dorschner, J., Begemann, B., Henning, Th., Jäger, C., & Mutschke, H. 1995, A&A, 300, 503
- Douvion et al. (2001) Douvion, T., Lagage, P. O., & Pantin, E. 2001, A&A, 369, 589
- Draine & Lee (1984) Draine, B. T. & Lee, H. M. 1984, ApJ, 285, 89
- Dunne et al. (2003) Dunne, L., Eales, S., Ivison, R., Morgan, H., & Edmunds, M. 2003, Nature, 424, 285
- Dunne et al. (2009) Dunne, L., et al. 2009, MNRAS, 394, 1307
- Dwek et al. (1986) Dwek, E., 1986, ApJ, 302, 363
- Dwek et al. (2004) Dwek, E., 2004, ApJ, 607, 848
- Dwek et al. (1987a) Dwek, E., 1987a, ApJ, 322, 812
- Dwek et al. (1987b) Dwek, E., Dinerstein, H. L., Gillett, F. C., Hauser, M. G., & Rice, W. L. 1987b, ApJ, 315, 571
- Dwek et al. (2007) Dwek, E., Galliano, F., & Jones, A. P. 2007, ApJ, 662, 927
- Edo (1983) Edo, O. 1983, PhD Dissertation, Dept. of Physics, University of Arizona
- Ennis et al. (2006) Ennis, J. A., Rudnick, L., Reach, W. T., Smith, J. D., Rho, J., DeLaney, T., Gomez, H., & Kozasa, T. 2006, ApJ, 652, 376
- Ercolano et al. (2007) Ercolano, B., Barlow, M. J., & Sugerman, B. E. K. 2007, MNRAS, 375, 753
- Fabata et al. (1997) Fabata, F., Vink, J., Dal Fiume, D., Parmar, A. N., Santangelo, A., Mineo, T., Preite-Martinez, A., Kaastra, J. S., & Bleeker, J. A. M. 1997, A&A, 324, L49
- Fesen & Becker (1991) Fesen, R. A., & Becker R. H. 1991, ApJ, 593, L23
- Fesen (2001) Fesen, R. A., 2001, ApJS, 133, 161
- Fesen et al. (200a) Fesen, R. A., Hammell, M. C., Morse, J., Chevalier, R. A., Borkowski, K. J., Dopita, M. A., Gerardy, C. L., Lawrence, S. S., Raymond, J. C., & van den Bergh, S. 2006a, ApJ, 636, 859
- Fesen et al. (2006b) Fesen, R. A., Hammell, M. C., Morse, J., Chevalier, R. A., Borkowski, K. J., Dopita, M. A., Gerardy, C. L., Lawrence, S. S., Raymond, J. C., & van den Bergh, S. 2006b, ApJ, 645, 283
- Fransson et al. (1996) Fransson, C., Lundqvist, P. & Chevalier, R. A. 1996, ApJ, 461, 993
- Fransson et al. (2005) Fransson, C., et al. 2005, ApJ, 622, 991
- Gotthelf et al. (2001) Gotthelf, E. V., Koralesky, B., Rudnick, L., Jones, T. W., Hwang, U., & Petre, R. 2001, ApJ, 552, L39
- Hachisu et al. (1990) Hachisu, I., Matsuda, T., Nomoto, K., & Shigeyama, T. 1990, ApJ, 358, L57
- Hachisu et al. (1992) Hachisu, I., Matsuda, T., Nomoto, K., & Shigeyama, T. 1992, ApJ, 390, 230
- Hasegawa & Kozasa (1988) Hasegawa, H., & Kozasa, T. 1988, Prog. Theor. Phys. Suppl., 96, 107
- Hines et al. (2004) Hines et al., 2004, ApJS, 154, 290
- Hirashita et al. (2008) Hirashita, H., Nozawa, T., Takeuchi, T. T. & Kozasa, T., 2008, MNRAS, 384, 1725
- Hughes et al. (2000) Hughes, J. P., Rakowski, C. E., Burrows, D. N., & Slane, P. O. 2000, ApJ, 528, L109
- Iskef et al. (1983) Iskef, H., Cunningham, J. W., & Watt, D. E., 1983, Phys. Med. Biol., 28, 535
- Iwamoto et al. (1997) Iwamoto, K., Young, T., Nakasato, N., Shigeyama, T., Nomoto, K., Hachisu, I., & Saio, H. 1997, ApJ, 477, 865
- Kotak et al. (2009) Kotak, R., et al. 2009, ApJ, 704, 306
- Kozasa & Hasegawa (1987) Kozasa, T., & Hasegawa, H. 1987, Prog. Theor. Phys.,77, 1402
- Kozasa et al. (1989) Kozasa, T., Hasegawa, H., & Nomoto, K. 1989, ApJ, 344, 325
- Kozasa et al. (1991) Kozasa, T., Hasegawa, H., & Nomoto, K. 1991, A&A, 249, 474
- Kozasa et al. (2009) Kozasa, T., Nozawa, T., Tominaga, N., Umeda, H., Maeda, K., & Nomoto, K. 2009, in ASP Conf. Ser., Cosmic Dust - Near and Far, eds. Th. Henning, E. Grüm, & J. Steinacker (San Francisco, CA: ASP), in press (arXiv/0903.0217)
- Krause et al. (2004) Krause, O., Birkmann, S. M., Rieke, G. H., Lemke, D., Klaas, U., Hines, D. C., & Gordon, K. D. 2004, Nature, 432, 596
- Krause et al. (2008) Krause, O., Birkmann, S. M., Usuda, T., Hattori, T., Goto, M., Rieke, G. H., & Misselt, K. A. 2008, Science, 320, 1195
- Lagage et al. (1996) Lagage, P. O., Claret, A., Ballet, J., Boulanger, F., Césarsky, C. J., Césarsky, D., Fransson, C., & Pollock, A. 1996, A&A, 315, L273
- Laming & Hwang (2003) Laming, J. M., & Hwang, U. 2003, ApJ, 597, 347
- Maeda et al. (2002) Maeda, K., Nomoto, K., Nakasato, N., & Suzuki, T. 2002, in ASP Conf. Ser. 271, Neutron Stars in Supernova Remnants, ed. P.O. Slane & B.M. Gaensler (San Francisco: Astr. Soc. Pacific), 379
- Maiolino et al. (2006) Maiolino, R., Nagao, T., Marconi, A., Schneider, R., Bianchi, S., Pedani, M., Pipino, A., Matteucci, F., Cox, P., & Caselli, P. 2006, MmSAI, 77, 643
- Mathis et al. (1977) Mathis, J. S., Rumpl, W., & Nordsieck, K. H. 1977, ApJ, 217, 425
- Mattila et al. (2008) Mattila, S., et al. 2008, MNRAS, 389, 141
- Meikle et al. (2007) Meikle, W. P. S., et al. 2007, ApJ, 665, 608
- Morgan & Edmunds (2003) Morgan, H. L., & Edmunds, M. G. 2003, MNRAS, 343, 427
- Nomoto et al. (1993) Nomoto, K., Suzuki, T., Shigeyama, T., Kumagai, S., Yamaoka, H. & Saio, H. 1993, Nature, 364, 507
- Nomoto et al. (1995) Nomoto, K., Iwamoto, K., & Suzuki, T. 1995, Phys. Rep., 256, 173
- Nomoto et al. (1996) Nomoto, K., Iwamoto, K., Suzuki, T., Pols, O. R., Yamaoka, H., Hashimoto, M., Hoeflich, P., & van den Heuvel, E. P. J. 1996, in IAU Symposium 165, Compact Stars in Binaries, eds. J. van Paradijs, E. P. J. van den Heuvel, & E. Kuulkers (Dordrecht: Kluwer Academic Publishers), 119
- Nozawa et al. (2008) Nozawa, T., et al. 2008, ApJ, 684, 1343
- Nozawa et al. (2006) Nozawa, T., Kozasa, T., & Habe, A. 2006, ApJ, 648, 435
- Nozawa et al. (2007) Nozawa, T., Kozasa, T., Habe, A., Dwek, E., Umeda, H., Tominaga, N., Maeda, K., & Nomoto, K. 2007, ApJ, 666, 955
- Nozawa et al. (2003) Nozawa, T., Kozasa, T., Umeda, H., Maeda, K., & Nomoto, K. 2003, ApJ, 598, 785
- Philipp (1985) Philipp, H. R. 1985, in Handbook of Optical Constants of Solids, ed. E. D. Palik, Academic Press, San Diego, p. 719
- Piller (1985) Piller, H. 1985, in Handbook of Optical Constants of Solids, ed. E. D. Palik, Academic Press, San Diego, p. 571
- Podsiadlowski et al. (1993) Podsiadlowski, Ph., Hsu, J. J. L., Joss, P. C., & Ross, R. R. 1993, Nature, 364, 509
- Prieto et al. (2008) Prieto, J. L., Stanek, K. Z., & Beacom, J. F. 2008, ApJ, 673, 999
- Reed et al. (1995) Reed, J. E., Hester, J., Fabian, A. C., & Winkler, P. F. 1995, ApJ, 440, 706
- Rho et al. (2008) Rho, J., Kozasa, T., Reach, W. T., Smith, J. D., Rudnick, L., DeLaney, T., Ennis, J. A., Gomez, H. & Tappe, A. 2008, ApJ, 673, 271
- Roessler & Huffman (1991) Roessler, D. M., & Huffman, D. R. 1991, in Handbook of Optical Constants of Solids II, ed. E. D. Palik, Academic Press, San Diego, p. 919
- Sakon et al. (2009) Sakon, I., et al. 2009, ApJ, 692, 546
- Semenov et al. (2003) Semenov, D., Henning, Th., Helling, Ch., Ilgner, M., & Sedlmayr, E. 2003, A&A, 410, 611
- Shigeyama et al. (1994) Shigeyama, T., Suzuki, T., Kumagai, S., Nomoto, K., Saio, H., & Yamaoka, H. 1994, ApJ, 420, 341
- Sibthorpe et al. (2009) Sibthorpe, B., et al. 2009, ApJ, submitted (arXiv/0910.1094)
- Smartt et al. (2009) Smartt, S. J., Eldridge, J. J., Crockett, R. M., & Maund, J. R. 2009, MNRAS, 395, 1409
- Smith et al. (2008) Smith, N., Foley, R. J., & Filippenko, A. V. 2008, ApJ, 680, 568
- Smith et al. (2009) Smith, J. D. T., Rudnick, L., DeLaney, T., Rho, J., Gomez, H., Kozasa, T., Reach, W. T., & Isensee, K. 2009, ApJ, 693, 713
- Sugerman et al. (2006) Sugerman, B. E. K., et al. 2006, Science, 313, 196
- Suzuki & Nomoto (1995) Suzuki, T., & Nomoto, K. 1995, ApJ, 455, 658
- Tabata et al. (1972) Tabata, T., Ito, R., & Okabe, S. 1972, Nucl. Instrum. Methods, 103, 85
- Takeuchi et al. (2005) Takeuchi, T. T., Ishii, T. T., Nozawa, T., Kozasa, T. & Hirashita, H. 2005, MNRAS, 362, 592
- Thorstensen et al. (2001) Thorstensen, J. R., Fesen, R. A., & van den Bergh, S. 2001, AJ, 122, 297
- Todini & Ferrara (2001) Todini, P., & Ferrara, A. 2001, MNRAS, 325, 726
- Tominaga (2009) Tominaga, N. 2009, ApJ, 690, 526
- Tominaga et al. (2008) Tominaga, N., et al. 2008, ApJ, 687, 1208
- Toon, Pollack, & Khare (1976) Toon, O. B., Pollack, J. B., & Khare, B. N. 1976, J. Geophys. Res., 81, 5733
- Umeda & Nomoto (2002) Umeda, H., & Nomoto, K. 2002, ApJ, 565, 385
- Valiante et al. (2009) Valiante, R., Schneider, R., Bianchi, S., & Andersen, A. C. 2009, MNRAS, 397, 1661
- Vink et al. (1996) Vink, J., Kaastra, J. S., & Bleeker, J. A. M. 1996, A&A, 307, L41
- Willingale et al. (2002) Willingale, R., Bleeker, J. A. M., van der Heyden, K. J., Kaastra, J. S., & Vink, J. 2002, A&A, 381, 1039
- Willingale et al. (2003) Willingale, R., Bleeker, J. A. M., van der Heyden, K. J., & Kaastra, J. S. 2003, A&A, 1021, 1028
- Wilson & Batrla (2005) Wilson, T. L., & Batrla, W. 2005, A&A, 430, 561
- Young et al. (2006) Young, P. A., Fryer, C. L., Hungerford, A., Arnett, D., Rockefeller, G., Timmes, F. X., Voit, B., Meakin, C., & Eriksen, K. A. 2006, ApJ, 640, 891

| species | () | () | |
|---|---|---|---|
| (1) | (2) | (3) | (4) |
| C | 0.621 | ||
| O | 0.063 | ||
| Mg | 0.192 | ||
| Al | 0.004 | ||
| Si | 0.292 | ||
| S | 0.016 | ||
| Fe | 0.012 | ||
| others | 0 | 0 | |
| Total | 1.30 | — |
Note. — Col. (1): Species of the main heavy element in the ejecta of the SN IIb. Col. (2): Mass of each heavy element (). Col. (3): Mass of each element that is locked up in dust grains at the time of dust formation (). Col. (4): Mass fraction of each element that is locked up in dust grains at the time of dust formation ().
| dust species | () | ||
|---|---|---|---|
| (1) | (2) | (3) | (4) |
| C | 0.054 | ||
| Al2O3 | |||
| MgSiO3 | 0.042 | ||
| Mg2SiO4 | 0.013 | ||
| SiO2 | 0.012 | ||
| MgO | |||
| FeS | |||
| Si | |||
| Total | 0.167 | 0.128 |
Note. — Col. (1): Species of dust formed in the ejecta of the SN IIb. Col. (2): Mass of each grain species (). Col. (3): Ratio of mass of each dust species to the total dust mass (). Col. (4): Ratio of mass of each dust species to the total metal mass ().
| CSM model | |||||||||
|---|---|---|---|---|---|---|---|---|---|
| (yr) | (yr) | (yr) | () | () | (pc) | (pc) | () | () | |
| (1) | (2) | (3) | (4) | (5) | (6) | (7) | (8) | (9) | (10) |
| A0.1 | 335 | 1300 | 3400 | 2.76 | 3.46 | 0.0 | 0.167 | ||
| A1 | 155 | 590 | 1550 | 0.0 | 0.0 | 1.98 | 2.52 | 0.167 | |
| A10 | 75 | 270 | 700 | 0.0 | 0.0 | 1.32 | 1.83 | 0.038 | 0.094 |
| B30 | 63 | 340 | 1850 | 0.0 | 0.0 | 1.51 | 2.20 | 0.048 | 0.111 |
| B120 | 48 | 150 | 560 | 0.0 | 0.0 | 0.93 | 1.67 | 0.008 | 0.072 |
| B200 | 45 | 120 | 370 | 0.0 | 0.0 | 0.70 | 1.50 | 0.028 | 0.011 |
Note. — Col. (1): Name of the CSM models considered in this paper. The labels A and B represent the uniform CSM and the stellar wind CSM (), respectively, and the attached number denotes the value of for model A and model B (see text). Cols. (2), (3), and (4): Times at which the reverse shock encounters the He core, O-rich layer, and Si-rich layer, respectively. Col. (5): Mass of surviving dust at yr. Col. (6): Ratio of surviving dust mass to the initial dust mass . Cols. (7) and (8): Radii of the reverse and forward shocks at 330 yr. Col. (9): Mass of warm dust heated up by the shock at 330 yr. Col. (10): Mass of unshocked cold dust at 330 yr.