Prompt-photon production in DIS
Abstract
Prompt-photon cross sections in deep inelastic scattering were measured with the ZEUS detector at HERA using an integrated luminosity of . Measurements of differential cross sections are presented for inclusive prompt-photon production as a function of , , and . Perturbative QCD predictions and Monte Carlo predictions are compared to the measurements.
1 Introduction
In the study of high energy collisions involving hadrons, events in which isolated high-energy photons (often referred to as prompt photons if originating from quarks) are observed provide a direct probe of the underlying parton process, since the emission of these photons is unaffected by parton hadronisation. Isolated high-energy photon production has been studied in hadronic collisions[2] and collisions in both the photoproduction [3] and deep inelastic scattering (DIS) [4] regimes. The present results are compared to theoretical predictions and also to Monte Carlo (MC) models .
2 Theoretical Predictions
The cross sections for isolated photon production have been calculated to order by Gehrmann-De Ridder et al. (GGP) [5]. In the approach of GGP, three contributions to the scattering cross-section for are considered at leading order () in the electromagnetic coupling. One of these contributions comes from the radiation of a photon from the quark line (called QQ photons) and a second from the radiation from the lepton line (called LL photons). The third contribution is an interference term between photon emission from lepton and quark lines, called LQ photons by GGP. In this analysis the contribution of the LQ term is reduced to a negligible level by combining and data (the LQ term changes sign when is replaced by ) and by requiring that the outgoing photon is well separated from both outgoing electron and quark. Therefore this analysis took into account LL and QQ photons only.
A calculation based on QED contributions to the parton distributions has been made by Martin et al. (MRST) [6]. In the approach of MRST a resummed version of the LL contribution is calculated. A photon parton component of the proton arises as a direct consequence of including QED corrections in parton distribution functions. This leads to a DGLAP-resummed enhancement of the LL prediction relative to that of GGP due to the inclusion of QED Compton scattering, , where the is a constituent of the proton. A measurement of the isolated high-energy photon production cross section therefore provides a direct constraint on the density of the photon within the proton. The non-collinear QQ component is not included in the MRST model and so the transverse momentum of the scattered electron is expected to balance approximately that of the isolated photon. The analysis presented here does not impose this constraint.
3 Data samples and Monte Carlo event simulation
The measurements are based on a data sample corresponding to an integrated luminosity of , taken between 2003 and 2007 with the ZEUS detector at HERA. The sample is a sum of of data and of data with centre-of-mass energy 111Hereafter ’electron’ refers both to electrons and positrons unless specified..
DIS events with QQ photon emission were simulated by the MC program Pythia 6.416 [7]. The LL photons radiated at large angles from the incoming or outgoing electron were simulated using the generator Djangoh6 [8], an interface to the MC program Heracles 4.6.6 [9]; higher-order QCD effects were simulated using the colour dipole model of Ariadne 4.12[10]. Hadronisation of the partonic final state was performed by Jetset [11]. These samples were used to study the event-reconstruction efficiency as well as providing the MC templates for the signal extraction in Section 5 and the MC predictions seen in Section 3.
The NC DIS background used in Section 5 was simulated using Djangoh6, within the same framework as the LL events.
4 Event selection and reconstruction
The kinematics were reconstructed from the scattered electron222The definitions of , and as reconstructed using the scattered electron are , and where () is the four-momentum of the incoming (outgoing) lepton, is the four vector of the outgoing photon and is the four-momentum of the incoming proton. and the kinematic region was chosen.
Scattered-electron candidates were and required to lie within the polar angle range , to ensure that they were well measured in the rear calorimeter (RCAL), and have energy, , greater than . To reduce backgrounds from non- collisions and suppress deeply virtual compton scattering [12] to a negligible level additional cuts were made on the reconstructed vertex position, tracks and energy sums.
Photon candidates were identified as CAL energy flow objects (EFOs [13]) with reconstructed transverse energy within the range and pseudorapidity within the range . It was also required that at least of the reconstructed energy was measured in the barrel electromagnetic calorimeter (BEMC) and that the photon candidate was well isolated from reconstructed tracks.
Jet reconstruction was performed on all EFOs in the event, including the photon candidate, using the cluster algorithm [14] in the longitudinally invariant inclusive mode [15]. Further isolation was imposed by requiring that the energy of the photon-candidate EFO contributed at least of the total energy of the jet to which it was assigned.
5 Photon signal extraction
The event sample selected according to the criteria in Section 4 is dominated by background events, most notably neutral current (NC) DIS events where a genuine electron candidate is found in the RCAL and neutral mesons such as and decay to photons producing photon-candidate EFOs in the BEMC. The photon signal was extracted from the background using BEMC energy-cluster shapes. Two shape variables were considered:
-
•
the variable , where is the position of the centre of the th cell, is the centroid of the cluster, is the width of the cell in the direction, is the energy recorded in the cell and the sum runs over all BEMC cells in the EFO;
-
•
the ratio of the highest-energy BEMC cell in the EFO to its total EMC energy, .
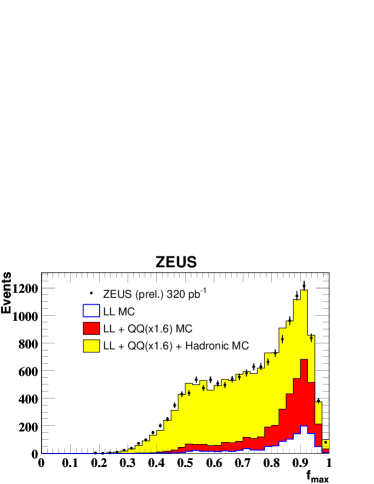
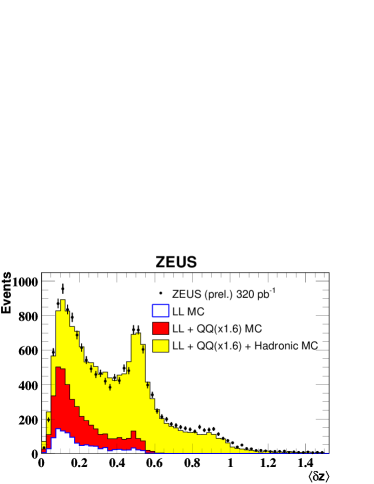
The distributions of and in data and MC are shown in Fig. 1. The distribution exhibits a double-peaked structure with the first peak at , associated with the signal, and a second peak at , dominated by the background. The distribution shows a single peak at corresponding to the photon signal, and presents a “shoulder” extending down to , which is dominated by the hadronic background.
The number of isolated-photon events contributing to Fig. 1 and in each cross-section bin was determined by a fit to the distribution in the range using MC-derived templates for the LL and QQ signal distributions and the background as described in Section 3. In performing the fit, the LL contribution was kept constant at its MC predicted value and the other components were varied. The final cross sections were derived from the fitted events per bin using the MC detailed in Section 3 and the bin-by-bin unfolding method.
6 Results and Conclusions
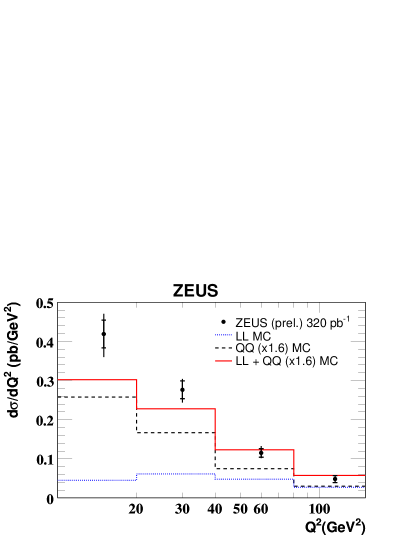
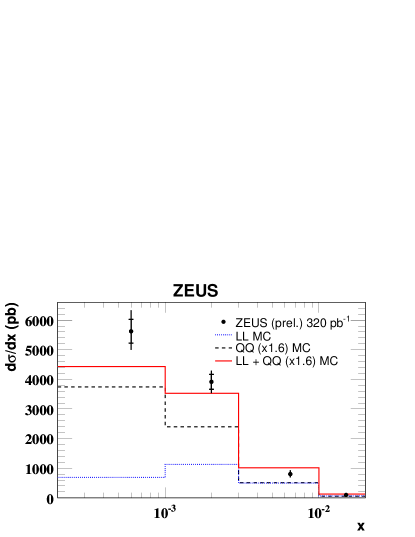
The differential cross sections as a function of , , and are shown in Fig. 2. The predictions for the sum of the expected LL contribution from Djangoh6 and a factor of approximately 1.6 times the expected contribution from Pythia agree well with the measurements, except for an excess at the lowest (and associated lowest ).
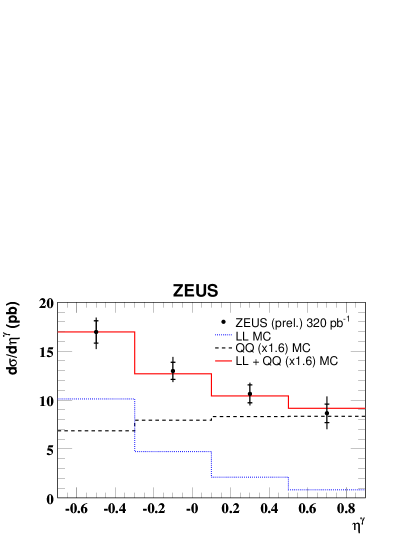
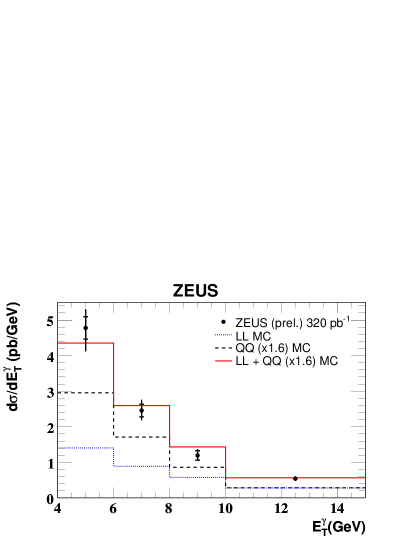
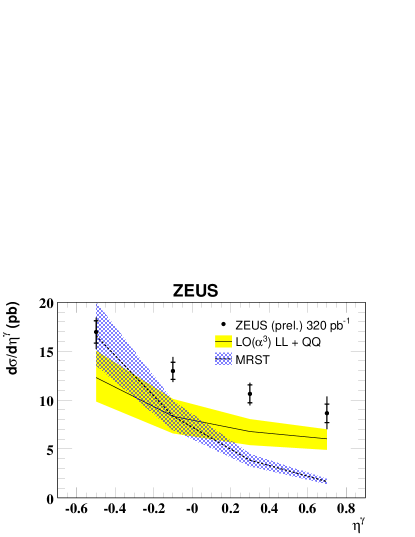
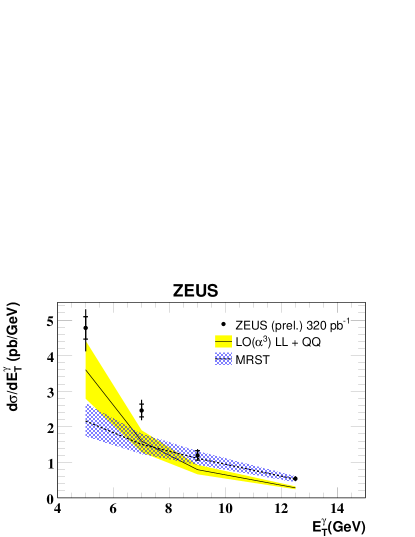
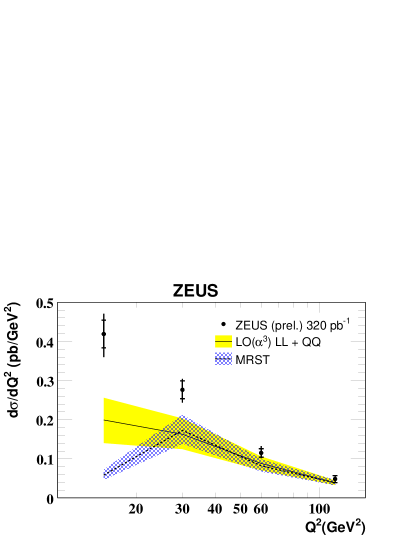
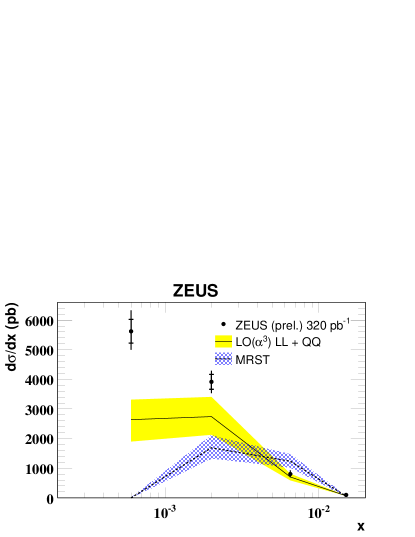
The differential cross sections as a function of , , and are compared to theoretical predictions in Fig. 3. The theoretical predictions from GGP describe the shape of the and distributions well, but the central value of the predictions typically lies below the measured cross sections. The calculations fail to reproduce the shape in . As with the MC comparison, the measured cross section is larger than the theoretical prediction; this is reflected in an excess of data over theory at low-. The MRST predictions fail to reproduce the shapes of the measured differential cross sections. However they agree with the measurements at large values of and , for backward and for high values of where the the LL cross section is expected to be a larger fraction of the total.
7 Acknowledgements
We would like to thank T. Gehrmann, W.J. Stirling and R. Thorne for their predictions and many useful discussions. We would also like to thank DESY directorate for their support and the members of the ZEUS collaboration whose effort over many years has made measurements such as this possible.
References
-
[1]
Slides:
http://indico.cern.ch/contributionDisplay.py?contribId=2823&sessionId=3&confId=53294 -
[2]
E. Anassontzis et al., Z. Phys.C13 277 (1982);
CDF Coll., F. Abe et al., Phys. Rev. Lett. 73 2662 (1994);
CDF Coll., D. Acosta et al., Phys. Rev. Lett. 95 022003 (2005);
DØ Coll., B. Abbott et al., Phys. Rev. Lett. 84 2786 (2000);
DØ Coll., V.M. Abazov et al., Phys. Lett. B 639 151 (2006).
-
[3]
ZEUS Coll., J. Breitweg et al., Phys. Lett. B 413 201 (1997);
ZEUS Coll., J. Breitweg et al., Phys. Lett. B 472 175 (2000);
ZEUS Coll., S. Chekanov et al., Phys. Lett. B 511 19 (2001);
ZEUS Coll., S. Chekanov et al., Eur. Phys. J. C49 511 (2007);
H1 Coll., A. Aktas et al., Eur. Phys. J. C38 437 (2004). -
[4]
ZEUS Coll., S. Chekanov et al., Phys. Lett. B 595 85
(2004);
H1 Coll., F.D. Aaron et al., Eur. Phys. J. C54 371 (2008). -
[5]
G. Kramer A. Gehrmann-De Ridder and H. Spiesberger., Nucl. Phys. B 578 326 (2000);
T. Gehrmann A. Gehrmann-De Ridder and E. Poulsen., Phys. Rev. Lett. 96 132002 (2006);
T. Gehrmann A. Gehrmann-De Ridder and E. Poulsen., Eur. Phys. J. C 47 395 (2006). -
[6]
A.D. Martin et al., Eur. Phys. J. C39 155 (2005);
W.J. Stirling and R. Thorne, private communication (2008). - [7] T. Sjöstrand et al., Comp. Phys. Comm. 135 238 (2001).
- [8] G.A. Schuler K. Charchula and H. Spiesberger., Comp. Phys. Comm. 81 381 (1994).
-
[9]
H. Spiesberger A. Kwiatkowski and H.-J. Möhring., 69 155 (1992);
Also in Proc. Workshop Physics at HERA, eds. W. Buchmüller and G.Ingelman, (DESY, Hamburg, 1991). - [10] L. Lönnblad., Comp. Phys. Comm. 71 15 (1992).
- [11] T. Sjöstrand., Comp. Phys. Comm. 39 347 (1986).
-
[12]
H1 Coll. C. Adloff et al., Phys. Lett. B 517 47 (2001);
ZEUS Coll., S. Chekanov et al., JHEP 05 108 (2009). -
[13]
ZEUS Coll., J. Breitweg et al., Eur. Phys. J. C 1 81 (1998);
ZEUS Coll., J. Breitweg et al., Eur. Phys. J. C 6 43 (1999). - [14] S.D. Ellis and D.E. Soper., Phys. Rev. D 48 3160 (1993).
- [15] S. Catani et al., Nucl. Phys. B 406 187 (1993).