Now at ]Department of Physics and Astrophysics, University of Delhi, Delhi 110007, India.
Now at ]Center for Cosmology and Astro Particle Physics, Ohio State University, Columbus, Ohio 43210, USA.
Now at ]Department of Physics, Penn State University, State College PA 16802 .
Now at ]Physics Department, St. John Fisher College, Rochester, New York 14618 USA.
Now at ]Department of Physics and Astronomy, University of Pennsylvania, Philadelphia, PA 19104-6396
Now at ]Nuclear Nonproliferation Division, Threat Reduction Directorate, Los Alamos National Laboratory, Los Alamos, New Mexico 87545, USA.
The MINOS Collaboration
Observation of muon intensity variations by season with the MINOS far detector
Abstract
The temperature of the upper atmosphere affects the height of primary cosmic ray interactions and the production of high-energy cosmic ray muons which can be detected deep underground. The MINOS far detector at Soudan MN, USA, has collected over 67 million cosmic ray induced muons. The underground muon rate measured over a period of five years exhibits a 4% peak-to-peak seasonal variation which is highly correlated with the temperature in the upper atmosphere. The coefficient, , relating changes in the muon rate to changes in atmospheric temperature was found to be: (stat.) (syst.). Pions and kaons in the primary hadronic interactions of cosmic rays in the atmosphere contribute differently to due to the different masses and lifetimes. This allows the measured value of to be interpreted as a measurement of the K/ ratio for 7 TeV of , consistent with the expectation from collider experiments.
pacs:
95.55.Vj, 98.70.Vc, 98.70.Sa, 14.44.AqI Introduction
When very high energy cosmic rays interact in the stratosphere, mesons are produced in the primary hadronic interaction. These mesons either interact and produce lower energy hadronic cascades, or decay into high energy muons which can be observed deep underground. While the temperature of the troposphere varies considerably within the day, the temperature of the stratosphere remains nearly constant, usually changing on the timescale of seasons (with the exception of the occasional Sudden Stratospheric Warming Osprey et al. (2009)). An increase in temperature of the stratosphere causes a decrease in density. This reduces the chance of meson interaction, resulting in a larger fraction decaying to produce muons. This results in a higher muon rate observed deep underground Barrett et al. (1952); Ambrosio et al. (1997); Bouchta (1999). The majority of muons detected in the MINOS far detector are produced in the decay of pions, although the decays of kaons must be considered for a more complete description of the flux Adamson et al. (2007a).
MINOS is a long baseline neutrino oscillation experiment Adamson et al. (2008, 2006), with a neutrino source and near detector at Fermi National Accelerator Laboratory in Batavia, IL, USA, and a far detector at the Soudan Underground Mine State Park in northern Minnesota, USA. This paper describes cosmic ray data taken in the far detector, a scintillator and steel tracking calorimeter located 0.72 km underground (2080 mwe, meters water equivalent) Michael et al. (2008). It has a 5.4 kton mass and a Rebel (2004) acceptance. Because of its depth, MINOS detects cosmic-ray muons with energy at the surface, E0.73 TeV. These high energy muons are mostly the result of the decays of the mesons produced in the primary hadronic interaction. This, coupled with the large acceptance, makes it possible to detect small seasonal temperature fluctuations in the upper atmosphere. The far detector is the deepest underground detector with a magnetic field, allowing the separation of particles by charge.
The MINOS data are correlated with atmospheric temperature measurements at the Soudan site provided by the European Centre for Medium-Range Weather Forecasts (ECMWF) ECM (Available from http://badc.nerc.ac.uk/data/ecmwf-op/). This temperature data set has higher precision than any other used for the seasonal variation analysis Barrett et al. (1952); Bouchta (1999); Ambrosio et al. (2003); Cini Castagnoli and Dodero (1967); Humble et al. (1979); Cutler et al. (1981); Sherman (1954); Fenton et al. (1961); Andreyev et al. (1987). The 67.32 million muon events used in this analysis were collected over five years, from August 1, 2003 to July 31, 2008, a period that includes five complete annual cycles. The seasonal variations in muon intensity were compared to a theoretical model which extends the pion-only model of Ambrosio et al. (1997) to include the contribution from kaons.
II The Experimental Effective Temperature Coefficient
II.1 Experimental Intensity
The underground muon intensity depends on the threshold energy and the cosine of the zenith angle . The change in underground muon intensity variations as a function of temperature was derived following the formalism of Barrett et al. (1952); Ambrosio et al. (1997). The change in the surface muon intensity, occurring at the MINOS far detector site can be written as:
| (1) |
where is the change in atmospheric temperature at atmospheric depth , and the weight reflects the temperature dependence of the production of mesons in the atmosphere and their decay into muons that can be observed in the far detector. A temperature coefficient can be defined as:
| (2) |
where is the muon intensity evaluated at a given value of atmospheric temperature . The phenomenological relationship between the atmospheric temperature fluctuations and muon intensity variations can now be written as:
| (3) |
The atmosphere consists of many levels that vary continuously in both temperature and pressure. To simplify calculations, the atmosphere is approximated by an isothermal body with an effective temperature, , obtained from a weighted average over the atmospheric depth:
| (4) |
An “effective temperature coefficient”, can then be defined
| (5) |
With these definitions in place, the relationship between atmospheric temperature fluctuations and muon intensity variations can now be written as:
| (6) |
The configuration and geometric acceptance of the far detector remain constant over time. Therefore, the rate, of muons observed in the detector is proportional to the incident muon intensity and varies with the effective atmospheric temperature as follows:
| (7) |
In practice, the observed muon rates and the temperature data are averaged over the period of a day. The effective temperature is obtained from a weighted average of temperature measurements obtained at a set of discrete pressure levels.
The weight can be written as the sum , representing the contribution of pions and kaons to the overall variation in muon intensity. The weights are given by Grashorn (2008); Grashorn et al. (2009):
| (8) |
where
| (9) |
The parameters include the amount of inclusive meson production in the forward fragmentation region, masses of mesons and muons, and muon spectral index; the input values are = 1 and = Grashorn (2008); Grashorn et al. (2009), where is the K/ ratio. The parameters reflect the relative atmospheric attenuation of mesons; The threshold energy, , is the energy required for a muon to survive to a particular depth; The attenuation lengths for the cosmic ray primaries, pions and kaons are , and respectively with . The muon spectral index is given by . The meson critical energy, , is the meson energy for which decay and interaction have an equal probability. Since the distribution has a long tail (Fig. 3), the value of used here is the median. The values for these parameters can be found in Table 1.
| Parameter | Value |
|---|---|
| 1 Grashorn (2008); Grashorn et al. (2009) | |
| Grashorn (2008); Grashorn et al. (2009) | |
| 0.149 Gaisser (1990) 0.06 Barr et al. (2006) | |
| 1.460 0.007 Grashorn (2008); Grashorn et al. (2009) | |
| 1.740 0.028 Grashorn (2008); Grashorn et al. (2009) | |
| 120 g/cm2 Gaisser (1990) | |
| 180 g/cm2 Gaisser (1990) | |
| 160 g/cm2 Gaisser (1990) | |
| 0.7850.14 TeV | |
| 1.70.1 Adamson et al. (2007a) | |
| 0.1140.003 TeV Grashorn (2008); Grashorn et al. (2009) | |
| 0.8510.014 TeV Grashorn (2008); Grashorn et al. (2009) |
Since the temperature is measured at discrete levels, the integral is represented by a sum over the atmospheric levels :
| (10) |
where is evaluated at . The temperature and pressure vary continuously through the atmosphere. Fig. 1 (solid line) shows the average temperature from 2003-2008 above Soudan as a function of pressure level in the atmosphere ECM (Available from http://badc.nerc.ac.uk/data/ecmwf-op/). The height axis on the right represents the average log-pressure height, the height of a pressure level relative to the surface pressure, corresponding to the average temperatures plotted here. The dashed line is the weight as a function of pressure level , obtained from Eq. 8 and normalized to one, used to calculate the effective temperature.
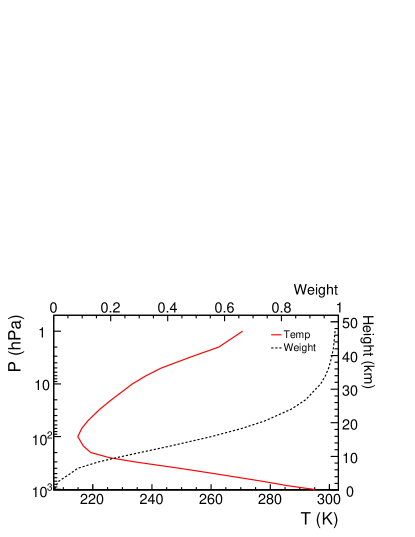
The dashed weight curve in Fig. 1 shows that the temperature fluctuations higher in the atmosphere have a greater effect on the production of muons visible at a depth of 2100 mwe. High energy mesons produced at the top of the atmosphere are more likely to decay, producing muons visible to MINOS, than those produced lower in the atmosphere. Note that the expression used to calculate in the pion scaling limit, ignoring the kaon contribution, is the same as the MACRO calculation Ambrosio et al. (1997). The effective temperature coefficient, , is a function of both the muon threshold energy and the K/ ratio. As the energy increases, the muon intensity becomes more dependent on the meson critical energy, which in turn is proportional to the atmospheric temperature. The effective temperature coefficient thus reflects the fraction of mesons that are sensitive to atmospheric temperature variations, and for energies much greater than the critical energy, the value of approaches unity. At the depth of the MINOS far detector, the vertical muon threshold energy lies between the pion and kaon critical energies. Therefore, because the muon energy is close to the parent meson’s energy, a larger K/ ratio results in a smaller value of .

II.2 The Data
The muon data for this analysis were accumulated over a five year span, beginning on August 1, 2003. Data quality cuts were performed to ensure a clean sample of muons (Pre-Analysis cuts) Adamson et al. (2007a)
-
1.
Require that all detector readout and sub-systems were functioning normally
-
2.
Remove runs with anomalous cosmic ray rates, greater than 1 Hz
-
3.
Remove events that had many hits assigned to incorrect channels (properly demultiplexed Adamson et al. (2007a))
-
4.
Remove muons induced by NuMI beam interactions with timing cuts Adamson et al. (2008).
After all cuts were applied the initial sample of 68.66 million muons was reduced to 67.32 million muons Grashorn (2008). A plot of the time between consecutive muon arrivals in the MINOS data is shown in Fig. 2. The distribution is well described by a Poisson distribution Ahlen et al. (1992); Grashorn (2008) with mean rate = 0.4692 0.0001 Hz, demonstrating the absence of short-timescale systematic effects on the data. The average muon rate was calculated for each day by dividing the number of observed muons by the detector livetime.
The energy spectra for the observed muons can be seen in Fig. 3.
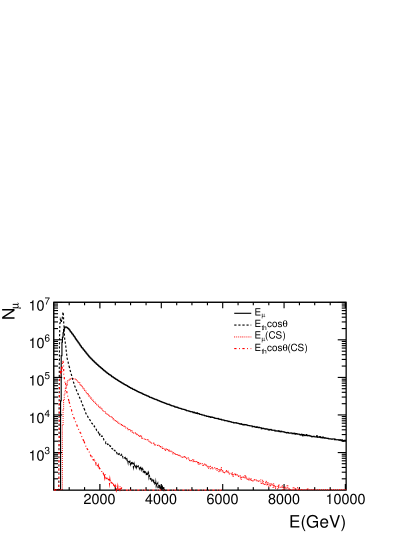
The solid line is , which was used to determine the value used in Eq. 8. The dashed line is the distribution of muon surface energies, , in far detector, which has a much longer tail than the distribution of threshold energies. Also shown are (dot-dash line), the distribution of after charge-separation cuts have been applied, and (dotted line), the distribution of after the charge-separation cuts (see Sec. II.3) have been applied. Note that the charge-separation cuts have been applied, but the distributions shown include both muon species. The distribution is peaked, with a median value =0.7950.14 TeV. This distribution, with its rapid fall-off, reflects the rock overburden surrounding the far detector.
The temperature data for the Soudan site was obtained from ECMWF, which collates a number of different types of observations (e.g. surface, satellite and upper air sounding) at many locations around the globe, and uses a global atmospheric model to interpolate to a particular location. For this analysis, the ECMWF model produced atmospheric temperatures at 21 discrete pressure levels: 1000, 925, 850, 700, 500, 400, 300, 250, 200, 150, 100, 70, 50, 30, 20, 10, 7, 5, 3, 2 and 1 hPa (1 hPa = 1.019 g/cm2), at four times, 0000 h, 0600 h, 1200 h and 1800 h each day. The effective temperature, , was calculated four times each day using Eq. 10. A mean value and error was obtained from these four daily measurements.The ECMWF temperature data was cross-checked using the Integrated Global Radiosonde Archive (IGRA) of temperature measurements Durre et al. (2006). The distribution of the differences between ECMWF and IGRA temperature values at International Falls, MN was well described by a Gaussian distribution with = 0.31 K.
Fig. 5 shows the percentage deviation in the mean daily muon rate, , over the entire set of data, with statistical error bars. A typical day at yields 40,000 muons, resulting in error bars of order 0.5%. The variation with season can be seen, with maxima in August and minima in February. These maxima peak at rates that are within 0.5% of each other.

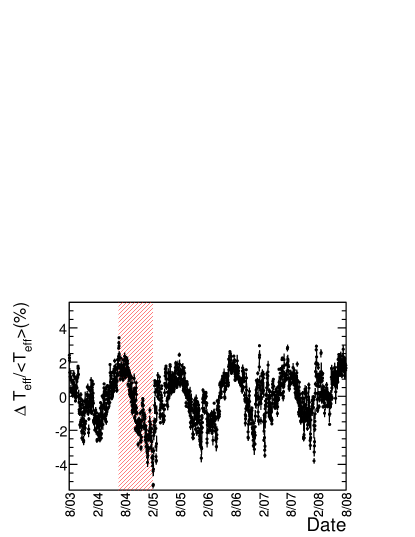
For the five year period . The distribution of over the data period can be seen in Fig. 5, with strong periodic seasonal correlation with the data. There is also striking correspondence between Fig. 5 and Fig. 5 for small term maxima and minima over a few days’ span.
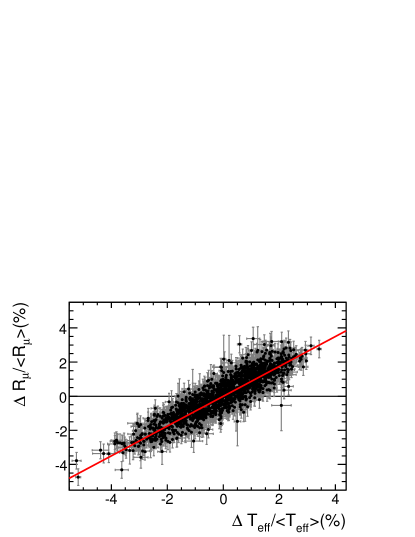
A plot of was produced (Fig. 6) for each day’s and data to quantify the daily correlation between rate and temperature. To find the value for , a linear regression was performed using the MINUIT James and Roos (1975) fitting package. This package performs a linear regression accounting for error bars on both the x and y axis using a numerical minimization method. The result of this fit is a slope of (statistical errors only), and the correlation coefficient (R-value) between these two distributions is 0.90.
The effects of systematic uncertainties were evaluated by modifying parameters and recalculating . Table 2 shows the difference in calculated for the modified parameters. The largest systematic errors are: a) the 0.06 uncertainty in meson production ratio Barr et al. (2006); b) the K uncertainty in mean effective temperature, estimated by comparing ECMWF temperatures at International Falls, MN, to those of the IGRA Durre et al. (2006) measurements; c) the 0.14 TeV uncertainty in muon threshold energy, estimated from uncertainties in the rock overburden above the far detector. To estimate this uncertainty, the rock map was adjusted up by 10% and was calculated, then the rock map was adjusted down by 10% and was again recalculated. The uncertainty was then calculated from the difference between and these adjusted values.
| Parameter | |
|---|---|
| meson production ratio, = 0.1490.06 Barr et al. (2006) | 0.007 |
| mean effective temperature, = 221.930.32 K | 0.0051 |
| threshold energy, =0.7950.14 TeV | 0.0048 |
| kaon constant, = 1.740 0.028 | 0.00046 |
| pion constant, = 1.460 0.007 | 0.000063 |
| Total | 0.010 |
These systematic errors were added in quadrature and are included with the error from the linear fit to obtain the experimental value of (stat.) (syst.).
II.3 Charge Separated
To obtain a sample of events with well-measured charge sign, further selection requirements were applied to the length and radius of curvature of muon tracks. These cuts, taken from previous investigations of the muon charge ratio at MINOS Adamson et al. (2007a), have the effect of reducing the energy distribution at Earth’s surface of the selected muon sample.
In all, 5.7% of the data set survived the cuts for both the forward and reverse field detector configurations. For the charge-separated samples linear regressions yielded effective temperature coefficients, and with / of 1933/1758 and 1688/1751 respectively. These numbers are consistent with each other, so there is no measurable difference between the temperature effect on and . The value of the charge-separated is expected to be smaller than the previous with no charge separation because the selection cuts change the energy distribution over which the integration is performed to calculate . This can be seen in Fig. 3, with the most dramatic difference between the all muon and charge separated distributions of . This difference could produce the systematic offset observed between these values, and is discussed further in the next section.
III Discussion
III.1 Predicted
The theoretical prediction of can be written as Barrett et al. (1952):
| (11) |
Using the differential muon intensity Gaisser (1990),
| (12) | |||||
and the MACRO approximation for the muon intensity Ambrosio et al. (1997), the prediction for can be calculated:
| (13) |
where
| (14) |
Note that this can be reduced to MACRO’s previously published expression Ambrosio et al. (1997), by setting (no kaon contribution). is the same as in Sec. II.
A numerical integration using a Monte Carlo method was performed to find the predicted value of the seasonal effect coefficient, , for the far detector. A set of muons was generated by drawing values of and separately from the differential intensity of muons at the surface, calculated in Gaisser (1990). A random azimuthal angle, , was assigned to each event and combined with and the Soudan rock overburden map Adamson et al. (2007a) to find the slant depth, , of the event. This was converted into the corresponding threshold energy, , required for a muon on the surface to propagate to the far detector. Events satisfying were retained, and the mean value of was found for a sample of 10,000 events, giving for MINOS. When this calculation was performed using the lower energy charge-separated energy spectrum, the result is an value that is lower by 0.015. This is most clearly seen in Eq. 13, which is dominated by the leading term. As increases, goes to one. Any selection that reduces the distribution will then reduce the expected .
The systematic uncertainty on was found by modifying the input parameters and recalculating . The dominant contributions were from: a) the 0.06 uncertainty in meson production ratio; b) the 10% in rock map uncertainty111 The rock map is not a determination of the slant depth by geophysical means. It was created by measuring the muon flux coming from a particular solid angle region on the sky and then normalizing to the All-world Crouch underground muon intensity curve Crouch (1987). This was done with both Soudan 2 data Kasahara (1997) and with MINOS data Adamson et al. (2007a), and these calculations were shown to agree to within 10%. Average cosmic ray muon flux, like those determined here and in Adamson et al. (2007a) can be determined using this method, although in any particular direction the rock map can be much different from what was calculated (e.g., in the direction of iron veins).; c) the 0.1 uncertainty in muon spectral index; d) the 0.014 TeV uncertainty in kaon critical energy; and e) the 0.003 TeV uncertainty in pion critical energy. These uncertainties are summarized in Table 3.
| Parameter | |
|---|---|
| meson production ratio, K/ = 0.1490.06 Barr et al. (2006) | 0.020 |
| rock map uncertainty | 0.013 |
| muon spectral index, = 1.7 0.1 | 0.0031 |
| kaon critical energy, =0.851 0.014 TeV | 0.0014 |
| pion critical energy, =0.1140.003 TeV | 0.0002 |
| Theoretical Total | 0.024 |

Fig. 7 shows effective temperature coefficients from MINOS and other underground experiments, including those of the MACRO survey Ambrosio et al. (1997), as a function of detector depth. The MINOS and Sherman Sherman (1954) effective temperature coefficients shown in Fig. 7 were calculated using Eq. 10. The other experimental data points are taken from the MACRO survey Ambrosio et al. (1997) and were calculated using a definition which excluded the contributions from kaons and were limited by temperature measurements up to 20 g/cm2; when the MINOS result is recalculated with this definition the effective temperature coefficient decreases to = 0.835. To compare the experimental values with the theoretical model, Eq. 13, the expected effective temperature coefficient as a function of depth was calculated using the numerical integration method outlined earlier, using standard rock and a flat overburden, and is shown in Fig. 7 as the solid line. There is qualitative agreement between the prediction and the experimentally measured values, but quantitative comparisons would require recalculating the experimental values using the kaon-inclusive definition of effective temperature. The two dashed lines in Fig. 7 show the effective temperature dependence for the extreme pion-only and kaon-only predictions. Fig. 7 is illustrative only, as the dependence of the experimentally measured effective temperature coefficient on the input K/ ratio is not explicitly shown.
III.2 Measurement of Atmospheric K/ Ratio
The uncertainty on the atmospheric K/ ratio in the current cosmic ray flux models is of order 40 % Barr et al. (2006). There has not been a measurement of this ratio with cosmic rays. Previous measurements have been made at accelerators for p+p collisions Rossi et al. (1975), Au+Au collisions Adler et al. (2004), Pb+P collisions Afanasiev et al. (2002); Alt et al. (2006) and p+ collisions Alexopoulos et al. (1993). Many other older measurements are summarized in Gazdzicki and Roehrich (1995). The experimental and theoretical values of can be combined to give a new measurement of the K/ ratio for the reaction , with 7 TeV. The threshold muon surface energy, =0.73 TeV and the median muon surface energy, , is 1.15 TeV. On average, the muon energy is one tenth the energy of its parent primary. The theoretical depends directly on the K/ ratio, as a consequence of the different interaction and decay properties of kaons and pions in the atmosphere. Since kaons and pions have different critical energies and attenuation lengths, the effective temperature also depends on the K/ ratio, and therefore the experimental is a weak function of the K/ ratio. By plotting the experimental and theoretical values of as functions of the K/ ratio and finding the intersection of the two curves, a measurement of the K/ ratio can be obtained.
Fig. 8 shows the experimental and theoretical values of as a function of the K/ ratio for the MINOS data.
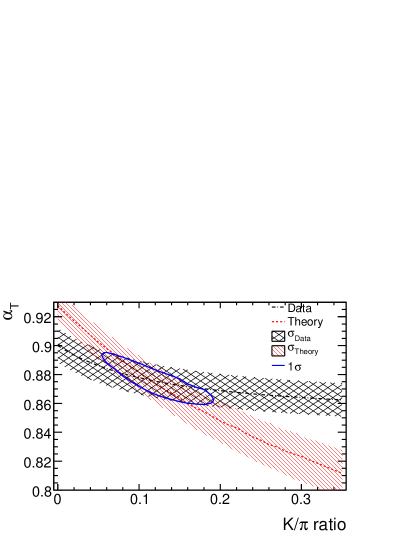
The errors in the experimental and theoretical values of are taken to be 0.012 and 0.013 respectively, obtained by combining the statistical errors in quadrature with the systematic errors in Tables 2 and 3, but omitting the error in the K/ ratio in each case. The error on the theoretical value of grows with increasing K/ ratio because has a larger uncertainty than , so a larger contribution from kaons introduces more uncertainty. The intersection of the two curves occurs at K/ = . The uncertainty is estimated by assuming Gaussian errors for the the theoretical and experimental values of and performing a minimization to determine the contour that encompasses the best fit point.
Previous measurements of the K/ ratio do not directly compare to this indirect measurement. Nevertheless, the central value of MINOS’s measurement is consistent with the collider-based direct measurements, although the indirect error bars are larger than those on the direct measurements. A comparison of this measurement to other measurements is shown in Fig. 9.
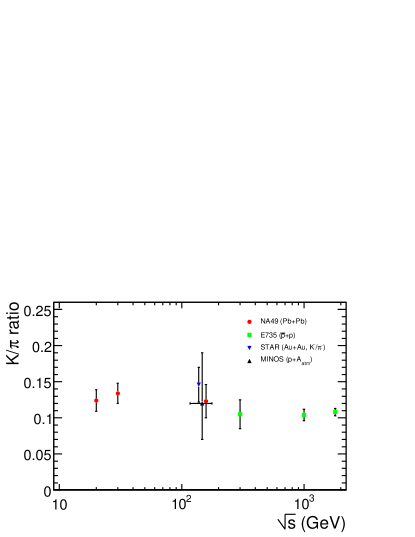
Only the MINOS result is for a reaction where the interacting particles do not have equivalent energy in the laboratory frame. Nevertheless, they are all presented on the same axes for a broad overview.The central value of MINOS’ indirect cosmic ray-based measurement is consistent with the collider-based direct measurements, and the associated error bars span the dispersion in those direct measurements.
IV Conclusions
A five year sample of 67.32 million cosmic ray induced muons has been collected by the MINOS far detector and daily rate fluctuations have been compared to daily fluctuations in atmospheric temperature. These distributions were shown to be highly correlated, with a correlation coefficient of 0.90. The constant of proportionality relating the two distributions, , was found to be 0.873 0.009 (stat.) 0.010 (syst.). This value is in good agreement with the theoretical expectation of . A measurement of the temperature dependence of the rate of separate from was performed for the first time. There is no statistically significant difference between and .
The experimental value of for the combined muon sample has the lowest uncertainty of any such measurement. While other experiments have estimated the effect of atmospheric temperature on kaon induced muons Barrett et al. (1952); Ambrosio et al. (1997), this is the first result to quantify the kaon-inclusive effective temperature coefficient. The new kaon-inclusive model fits the MINOS far detector data better than the pion only model Ambrosio et al. (1997) and suggests a measurement of the atmospheric K/ ratio. Applying the differing temperature variations of kaon and pion decay to the seasonal variations analysis allowed the first measurement of the atmospheric K/ ratio for 7 TeV. It was found to be K/ = .
V Acknowledgments
We thank the Fermilab staff and the technical staffs of the participating institutions for their vital contributions. This work was supported by the U.S. Department of Energy, the U.K. Science and Technologies Facilities Council, the U.S. National Science Foundation, the State and University of Minnesota, the Office of Special Accounts for Research Grants of the University of Athens, Greece, FAPESP (Fundacao de Amparo a Pesquisa do Estado de Sao Paulo) and CNPq (Conselho Nacional de Desenvolvimento Cientifico e Tecnologico) in Brazil. We gratefully acknowledge the Minnesota Department of Natural Resources for their assistance and for allowing us access to the facilities of the Soudan Underground Mine State Park and the crew of the Soudan Underground Physics Laboratory for their tireless work in building and operating the MINOS far detector. We also acknowledge the BADC and the ECMWF for providing the environmental data for this project.
References
- Osprey et al. (2009) S. Osprey et al., Geophys. Res. Lett. 36, L05809 (2009).
- Barrett et al. (1952) P. Barrett et al., Rev. Mod. Phys. 24, 133 (1952).
- Ambrosio et al. (1997) M. Ambrosio et al. (MACRO), Astropart. Phys. 7, 109 (1997).
- Bouchta (1999) A. Bouchta (AMANDA), Proc. 26th Int. Cosmic Ray Conf., Salt Lake City 2, 108 (1999).
- Adamson et al. (2007a) P. Adamson et al. (MINOS), Phys. Rev. D76, 052003 (2007a).
- Adamson et al. (2008) P. Adamson et al. (MINOS), Phys. Rev. D77, 072002 (2008).
- Adamson et al. (2006) P. Adamson et al. (MINOS), Phys. Rev. D73, 072002 (2006), eprint hep-ex/0512036.
- Michael et al. (2008) D. G. Michael et al. (MINOS), Nucl. Instrum. Methods 596, 190 (2008).
- Rebel (2004) B. J. Rebel (2004), PhD Dissertation, Indiana University FERMILAB-THESIS-2004-33.
- ECM (Available from http://badc.nerc.ac.uk/data/ecmwf-op/) European Centre for Medium-Range Weather Forecasts ECMWF Operational Analysis data, [Internet] British Atmospheric Data Centre 2006-2007 (Available from http://badc.nerc.ac.uk/data/ecmwf-op/).
- Ambrosio et al. (2003) M. Ambrosio et al. (MACRO), Phys. Rev. D67, 042002 (2003).
- Cini Castagnoli and Dodero (1967) G. Cini Castagnoli and M. Dodero (Torino), II Nuovo Cim. B 51, 525 (1967).
- Humble et al. (1979) J. Humble et al. (Poatina), Proc. 16th Int. Cosmic Ray Conf., Kyoto 4, 258 (1979).
- Cutler et al. (1981) D. Cutler et al. (Utah), Proc. 17th Int. Cosmic Ray Conf., Paris 4, 290 (1981).
- Sherman (1954) N. Sherman, Phys. Rev. 93, 208 (1954).
- Fenton et al. (1961) A. Fenton, R. Jacklyn, and R. Taylor (Hobart), II Nuovo Cim. B 22, 285 (1961).
- Andreyev et al. (1987) Y. Andreyev et al. (Baksan), Proc. 20th Int. Cosmic Ray Conf., Moscow 3, 270 (1987).
- Grashorn (2008) E. W. Grashorn (2008), PhD Dissertation, University of Minnesota FERMILAB-THESIS-2008-06.
- Grashorn et al. (2009) E. W. Grashorn et al., Submitted to Astropart. Phys. (2009), eprint hep-ex/09095382.
- Gaisser (1990) T. K. Gaisser (1990), Cosmic rays and particle physics, Cambridge, UK: Univ. Pr.
- Barr et al. (2006) G. D. Barr, T. K. Gaisser, S. Robbins, and T. Stanev, Phys. Rev. D74, 094009 (2006).
- Adamson et al. (2007b) P. Adamson et al. (MINOS), Phys. Rev. D75, 092003 (2007b), eprint hep-ex/0701045.
- Ahlen et al. (1992) S. P. Ahlen et al. (MACRO), Nucl. Phys. B370, 432 (1992).
- Durre et al. (2006) I. Durre, R. S. Vose, and D. Wuertz, Journal of Climate 19, 53 (2006).
- James and Roos (1975) F. James and M. Roos, Comput. Phys. Commun. 10, 343 (1975).
- Crouch (1987) M. Crouch, Proc. 20th Int. Cosmic Ray Conf., Moscow 6, 165 (1987).
- Kasahara (1997) S. M. Kasahara, Ph.D. Thesis, University of Minnesota, UMI-97-21625 (1997).
- Rossi et al. (1975) A. M. Rossi et al., Nucl. Phys. B84, 269 (1975).
- Adler et al. (2004) C. Adler et al. (STAR), Phys. Lett. B595, 143 (2004).
- Afanasiev et al. (2002) S. V. Afanasiev et al. (NA49), Phys. Rev. C66, 054902 (2002).
- Alt et al. (2006) C. Alt et al. (NA49), Eur. Phys. J. C45, 343 (2006).
- Gazdzicki and Roehrich (1995) M. Gazdzicki and D. Roehrich, Z. Phys. C65, 215 (1995).
- Alexopoulos et al. (1993) T. Alexopoulos et al. (E735), Phys. Rev. D48, 984 (1993).