On the Stellar Masses of IRAC detected Lyman Break Galaxies at 3
Abstract
We present results of a large survey of the mid–IR properties of 248 Lyman Break Galaxies with confirmed spectroscopic redshift using deep Spitzer/IRAC observations in six cosmological fields. By combining the new mid–IR photometry with optical and near-infrared observations we model the Spectral Energy Distributions (SEDs) employing a revised version of the Bruzual and Charlot synthesis population code that incorporates a new treatment of the TP–AGB phase (CB07). Our primary aim is to investigate the impact of the AGB phase in the stellar masses of the LBGs, and compare our new results with previous stellar mass estimates. We investigate the stellar mass of the LBG population as a whole and assess the benefits of adding longer wavelengths to estimates of stellar masses for high redshift galaxies. Based on the new CB07 code we find that the stellar masses of LBGs are smaller on average by a factor of 1.4 compared to previous estimates. LBGs with 8m andor 24m detections show higher masses (M∗ 1011 M⊙) than LBGs faint in the IRAC bands (M∗ 109 M⊙). The ages of these massive LBGs are considerably higher than the rest of the population, indicating that they have been star-forming for at least 1 Gyr. We also show how the addition of the IRAC bands, improves the accuracy of the estimated stellar masses and reduced the scatter on the derived M/L ratios. In particular, we present a tight correlation between the 8m IRAC band (rest–frame K for galaxies at z3) and the stellar mass. We calculate the number density of massive (M∗ 1011 M⊙) LBGs and find it to be = (1.12 0.4) 10-5 Mpc-3, 1.5 times lower than that found by previous studies. Finally, based on UV-corrected SFRs we investigate the SFR-stellar mass correlation at 3, find it similar to the one observed at other redshifts and show that our data place the peak of the evolution of the specific star formation rate at 3.
1 Introduction
Although there has been considerable progress in understanding galaxy formation and evolution, current theoretical models still suffer from several uncertainties. These uncertainties are mainly introduced by parameters that are very difficult to constraint, such as the initial mass function (IMF), the action of feedback by supernovae and stellar winds and the chemical evolution. Given that theoretical guidance is so uncertain, direct empirical information is essential in driving the investigation. The detection and study of high– galaxies can put constraints on the physical parameters, put the existing models to the test and guide us to a better and more accurate description of the early galaxies. To this end, recent surveys have come to play a central role in modern cosmology, revealing a wealth of 2–3 star–forming galaxies.
Among others, there are two efficient methods of detecting high– galaxies. The first relies on sub-millimetre blank field observations using the Sub-millimetre Common-User Bolometer Array (SCUBA) on the James Clerk Maxwell Telescope (e.g. Hughes et al. 1998) or the Max Plank Millimetre Bolometer array (MAMBO, e.g. Bertoldi et al. 2000) revealing the population of the sub-millimetre galaxies (SMGs) at 2 (e.g. Chapman et al. 2000; Ivison et al. 2002; Smail et al. 2002). The second relies on colour selection criteria, selecting high– galaxies with different characteristics. For instance, the BzK colour criterion introduced by Daddi et al. (2003) selects moderately aged and moderately obscured star forming galaxies at 2 while the Js Ks 2.3 criterion (Franx et al. 2003; van Dokkum et al. 2003) detects both strongly obscured by dust high– star–forming galaxies as well as massive/evolved systems. One of the most common methods in the last decade though, now comprising an impressive catalogue of thousands of galaxies at 3, has been the selection based on photometric redshift gained from observations of the “Lyman Break” located at 912Å in the spectrum of a star–forming galaxy. The Lyman Break Galaxy (LBG) selection method was pioneered by Steidel et al. (1996, 1999, 2000, 2003), but has also been used by many other groups (e.g. Madau et al. 1996; Pettini et al. 2001; Bunker et al. 2004; Stanway et al. 2004; Ouchi et al. 2004a,b).
Since their detection, LBGs have caught the attention of the scientific community, and a considerable amount of effort has been concentrated on investigating and understanding their nature. To this direction, several strategies have been employed, ranging from multi–wavelength photometric observations (from X–rays (Nandra et al. 2002; Laird et al. 2006), to sub-mm (Chapman et al. 2000; Ivison et al. 2005)), to optical and near–infrared spectroscopy (e.g. Erb et al. 2003; Pettini et al. 2001; Steidel et al. 1996a; Shapley et al. 2003).
One way to derive the properties of the LBGs is by fitting the observed SED with model SEDs, generated by stellar synthesis population codes. This technique was first applied by Sawicki & Yee (1998) to a sample of 17 LBGs from the HDF-N (Williams et al. 1996). Later it was further employed by Papovich et al. 2001 and Shapley et al. 2001 with NIR (rest–frame optical) photometry. Both groups derive similar stellar masses 1010M⊙ and agree that the stellar mass is generally well constrained by the fitting procedure in contrast to star formation rate and stellar age which suffer from large uncertainties. Any study based only on rest–frame UV/optical data though, is far from complete, as the UV light of these galaxies samples only the short–lived massive stars of the forming populations. For a more comprehensive study, rest–frame near–IR observations of galaxies are essential since they trace the bulk of the stellar emission. The advent of Spitzer Space Telescope, and its unprecedented sensitivity opened a window to the IR part of the spectrum of high galaxies and enabled the study of their infrared properties.
Up to date, there have been few mid–IR studies of LBGs. Using Spitzer observations, Barmby et al. (2004) investigated the properties of several hundred LBGs in Q1700, while Reddy et al. (2006), based on a sample of UV selected galaxies in HDFN, found that they span 2 orders of magnitude in age and stellar mass and 4 orders of magnitude in dust obscuration. More recently, Shim et al. (2007) presented a study based on a sample of LBGs from a sub–region of the First Look Survey. Although their sample lacks spectroscopic redshift they find that more than 70% of the IRAC detected LBGs have estimated stellar masses 1011M⊙. A detailed mid–IR study of LBGs has been presented by Rigopoulou et al. (2006) (R06 hereafter). Based on a sample of 175 LBGs with confirmed spectroscopic redshift in the Extended Groth Strip they suggested that LBGs with bright IRAC colours are more massive (M∗1011M⊙), older (tsf 1Gyr) and suffer more extinction when compared to the rest of the sample. Magdis et al. (2008), based on a a sample of 751 LBGs, presented the mid–IR colours of LBGs and suggested that they are a rather inhomogeneous population ranging from those that have bright IRAC colours with SEDs that rise steeply towards longer wavelengths and R [3.6] 1.5 (“red” LBGs) to those that are faint in the IRAC bands with R [3.6] 1.5 (“blue” LBGs). Finally, Huang et al. (2005), reported the detection of several LBGs in the Extended Groth Strip (EGS) at MIPS 24m, revealing a subset of LBGs, the Infrared Luminous Lyman Break Galaxies (ILLBGs).
Despite those efforts, the mid–IR properties of the LBGs are not clear yet. Partially, this is due that fact that the derived properties of the population depend critically on the adopted stellar synthesis population model. New developments of the stellar synthesis population codes, incorporating more accurate prescriptions of the stellar evolution phases and more particularly of the Thermal-Pulsating Asymptotic Giant Branch phase (TP-AGB), allow us to derive more realistic and robust estimates of the properties of the population.
In this paper, we present mid–IR photometry for a sample of spectroscopically confirmed 3 LBGs detected as part of the IRAC Guaranteed Time Observations (GTO) program on 6 cosmological fields. Benefited from ground based optical and IRAC observations, we are in the unique position to constrain the properties of the population. Although the stellar masses of the LBGs have been studied in the past, here we make use of a revised version of the Bruzual and Charlot stellar synthesis population code (CB07, private communication) that incorporates a new treatment of the TP–AGB phase and extend our study to explore the SFR-stellar mass relation at z3. Our aims are to investigate the impact of the new AGB–phase recipe on the stellar masses of the population, derive the range of the stellar masses of the LBGs and assess the benefits of adding longer wavelengths. In Section 2 we present a brief account of the observations and data reduction while in Section 3 we describe the model parameters and the SED fitting of the observed SEDs, used to derive the properties of the population. Section 4 is dedicated to derived stellar masses. We quantify the impact of the addition of the AGB phase in the model SEDs, discuss the range of stellar masses of our sample and present the M/L as a function of wavelength. In Section 5 we focus on the number density of massive LBGs and present the stellar mass density of our sample. Finally, in Section 6 we investigate the SFR-stellar mass correlation for star-forming galaxies at =3 while in Section 7 we summarise our results.
2 The Spitzer LBG sample
The data for this study have been obtained with the Infrared Array Camera (IRAC) (Fazio et al. 2004) on board the Spitzer Space Telescope. The majority of our data are part of the IRAC Guaranteed Time Observation program (GTO, PI G. Fazio) and include the fields: Q1422+2309 (Q1422), DSF2237a,b (DSF), Q2233+1341 (Q2233), SSA22a,b (SSA22) and B20902+34 (B0902) while data for the HDFN come from the Great Observatories Origin Deep Survey program (GOODS, PI M. Dickinson). The data analysis and the mid–IR identification of the LBGs in these fields have been presented in detail by Magdis et al. (2008). Based on a catalogue of 1261 LBGs by Steidel et al. (2003) in these fields, we constructed a mid–IR sample of 751 LBGs, that were observed in at least one IRAC band. The sample consists of three categories of objects: those that have confirmed spectroscopic redshift (through follow up ground-based optical/NIR spectroscopy, Steidel et al. 2003) and are identified as galaxies at 3 (LBGs-z) or classified as active galactic nuclei (AGN)/QSO and those that do not have spectroscopic redshift. In total, 321 LBGs-, 12 AGN/QSO and 435 LBGs without spectroscopic redshift are covered. In Table 1 we list the ground based and IRAC photometry of LBGs- from the current sample, that are observed in all IRAC bands.
In the current study, we focus on a sub-sample of 186 LBGs that 1)are observed in all IRAC bands, 2) are detected in at least one IRAC band, 3) have confirmed spectroscopic redshift and 4) are classified as galaxies, lacking a signature of strong AGN activity in their rest–UV spectrum (Shapley et al. 2003). In our sample we add 10 LBGs that satisfy our criteria from the field Q1700.
Out of these, 71 LBGs are detected at 8m, consisting the 8m sample. As discussed by Magdis et al. (2008), whether a LBG is detected at 8m relies critically both on the depth of the observation and on how bright the LBG is in shorter wavelengths (i.e. 3.6- and 4.5-m). Since in HDFN, the deepest field of their study, all LBGs with [3.6]AB 23 were detected at 8m, they extend the original 8m sample, by including the LBGs of shallower fields that were not detected at 8m but with [3.6]AB 23. We will refer to this as the “extended 8m sample” and it consists of 105 LBGs. We also match our sample to the MIPS 24m catalogue of detected LBGs in HDFN published by Reddy et al. (2006) (3,f24 = 8Jy). Among the 8m detected LBGs in HDFN, 18 LBGs are detected at 24m, while one of our galaxies (HDFN-M18), has f24 = 88.2Jy and according to Huang et al. (2005) criterion is classified as a ILLBG (f24 60Jy).
Although the current sample consists of LBGs lacking strong emission lines in their optical spectrum, one cannot rule out the presence of an obscured AGN. This issue was discussed by Magdis et al. (2008), where they showed that the mid–IR colours of the LBGs are consistent with that of star-forming galaxies and that AGNs at 3 tend to have brighter 8m fluxes and exhibit redder [4.5]-[8.0] colours. Another way to explore this possibility would be to search for object whose mid-IR SED is well fitted with a power law (ν α with -0.5, Donley et al. 2007, Alonso-Herrero et al. 2006), indicative of the presence of hot dust heated by an AGN. However, the power law galaxy (PLG) selection using IRAC photometric points, is not applicable at the redshift range of our sample. At 3 the IRAC bands sample the blue part of the 1.6m bump, dominated by light from the stellar component of a galaxy. Hence, even if an AGN exists, one cannot trace its signature at the wavelength range of 0.9-2m rest–frame. This has also been pointed out by Donley et al. (2008), where they showed that at 2.5 the star-forming galaxy templates have IRAC SEDs that meet the typical PLG criteria. We note however, that according to Table 5 of Magdis et al. (2008), the fraction of AGN among the 8m detected LBGs is 11, compared to 3.5 among the whole sample of R 25.5 LBGs. Finally, the mean redshift of our sample is 2.92 (the distribution has 0.12).
3 Derivation of Physical Properties
We derive stellar masses for the LBG sample by fitting the latest CB07 stellar population synthesis models to the observed SEDs. The most important update of CB07 when compared to its predecessor (BC03) is the use of variable molecular opacities instead of the scaled–solar tables. Also, the calibration is not only based on the reproduction of the CSLFs in both Magellanic Clouds, but also on the data for C– and M–star counts in Magellanic Cloud clusters, providing the right luminosities of the TP–AGB phase and the right contribution of TP–AGB stars to the integrated light (Marigo & Girardi 2007). In this section, we first describe the CB07 models and the fitting process that we use to infer the stellar masses and then comment on the uncertainties introduced by this type of analysis.
3.1 SED fitting.
We use the CB07 code to generate model SEDs in order to fit the observed SEDs of 196 LBGs with confirmed spectroscopic redshift and at least one IRAC detection. Our aim is to derive the properties of the population and more particularly the stellar masses. We adopted the Padova 1994 stellar evolution tracks and constructed models with solar metallicity (see discussion in Shapley et al. 2004) and a Chabrier Initial Mass Function. We use the Calzetti et al. (2000) starburst attenuation law to simulate the extinction by dust. We have considered two simple single–component models: exponentially declining models of the form SFR(t) exp(-t/) with e-folding times of = 0.05, 0.1, 0.5, 1.0, 1.5, 2.0, and 5.0 Gyr and continuous star formation (CSF) models ( = ).
Our model fitting followed standard procedures applied in similar studies of high-redshift galaxies (e.g. Papovich et al. 2001; Shapley et al. 2001; Forster Schreiber et al. 2004; Shapley et al. 2005; Papovich et al. 2006; Yan et al. 2006a). The free parameters of our models are: dust extinction (E(BV)), age (tsf defining the onset of star formation), stellar mass ( ), star formation (SFR) and star formation history ( ). For each of the star formation histories, we generated models with ages ranging from 1 Myr to the age of the Universe at the redshift of the galaxy being modeled, while we allowed the dust extinction to vary between E(B V) = 0 and E(B V) = 1.0. Furthermore, we computed the absorption by the intergalactic medium of neutral hydrogen (Madau 1995) at the redshift of each galaxy, and attenuated appropriately the SED of the generated models. The model SEDs were then placed at the redshift of each galaxy and were compared to the observed SEDs by computing a reduced 2. The CB07 spectra are normalized to an SFR of 1 M⊙ yr-1 for the continuous star formation model while for the exponentially decaying models, the galaxy mass is normalized to 1 M⊙ as t=. For each individual galaxy, best-fitting parameters (age, E(B-V), and normalizations) were derived from minimization of the reduced 2. This normalizations were then converted to best-fit stellar mass and along with the best fit age, E(B-V) and was considered the overall “best-fit”.
To quantify the error in the derived stellar masses, we compute the range of normalizations that result in an SED with reduced 2 values within 2reduced = 1 of the minimum value. We adopt these as the 1 uncertainties associated with the stellar masses. Finally, to facilitate comparisons with previous studies in the fields as well as to quantify the impact of the AGB phase on the derived stellar masses we choose to repeat our analysis using this time models generated with BC03.
3.2 Model Parameters and systematic uncertainties
Of course, the derived best–fit parameters are subject to the adopted parameters of the model fits. In what follows we discuss how varying those properties affects the best–fit SED parameters and uncertainties involved in this kind of analysis.
3.2.1 Extinction
The impact of different extinction laws has already been investigated by e.g., Papovich et al. (2001), Dickinson et al. (2003), who found the effect to be overall small. For the present work we have adopted the Calzetti (2000) law. Such a law reproduces the total SFR from the observed UV for the vast majority of LBGs and accurately predicts the average X–ray and radio continuum fluxes of 2 star–forming galaxies. (e.g. Reddy & Steidel 2004, Reddy et al. 2005, Nandra et al. 2003, Daddi et al. 2007). The choice of the Calzetti law was also dictated by the desire to facilitate comparison with previous works in the field.
3.2.2 Metallicity and Initial Mass Function
So far, information on element abundances in LBGs is rather limited. Pettini et al. (2002) determined element abundances in cB58, a typical galaxy which benefits from a factor of 30 magnification, and found it to be 0.25 Z⊙. Nagamine et al. (2001) suggested that near-solar metallicities are in fact common in 3 galaxies with masses greater than M⊙, which is broadly consistent with the results for cB58. Erb et al. (2006) and Shapley et al. (2004) also argued for solar metallicities for 3 LBGs. Based on these results we used solar metallicity in the models. Reducing metallicity to half solar would decrease the derived masses by 10–20% (Papovich et al. 2001).
Finally, although the issue of the IMF that best describes the stellar population of high– galaxies still remains open (e.g. Renzini 2005; van Dokkum 2007; Dave 2008), recent results favor the scenario of a top–heavy IMF (e.g. Baugh et al. (2005), Nagashima et al. (2005), Lacey et al. (2008)). Driven from these results we chose to use a Chabrier IMF to generate the CB07 models.
3.2.3 Systematic Uncertainties
The systematic uncertainties, inherent in population synthesis modeling, have been studied and extensively described in the literature (e.g.. Papovich et al. 2001, Shapley et al. 2001, Shapley et al 2005). The limitations of this technique mainly originate from the fact that the models cannot fully constrain the star formation history of high– galaxies. In brief, the strong dependancy of the inferred extinction and age to the adopted star formation history introduces large degeneracies and makes the determination of these parameters highly uncertain.
These uncertainties are of course likely to affect the inferred stellar masses but in a less dramatic way. To test the impact of the adopted star formation history in the derived stellar masses it is worth comparing the inferred stellar mass of each galaxy for the two adopted star formation histories, namely constant (CSF) and exponentially decaying (EXP) star formation. We find that the agreement in the masses of individual objects is excellent, within the errors, with no obvious systematic trend or offset, indicating that the derived masses are robust and the adopted star formation history has a negligible effect on them ( M∗CSF = 10.471 0.101 and M∗EXP =10.451 0.126).
We note however, that the uncertainties in the mass estimates become more serious when one assumes more complex star formation histories, such as the superposition of a young, roughly continuous episode of star formation and an old burst, with tsf , that peaked sometime in the past (Papovich et al. 2001) or introducing random bursts during the adopted star formation histories (Glazebrook et al. 2004). These studies indicate that the use of the simple star formation histories (CSF or EXP) is likely to provide a lower limit on the stellar mass estimate (Shapley et al. 2005).
4 The stellar masses of 3 LBGs
Based on the best-fit CB07 models, we derive the stellar masses of our sample population. The stellar masses, ages (tsfr) and extinction (E(B V)) that correspond to the best fit models are listed in Table 2. Before examining the results though, we investigate the impact of the TP-AGB phase on the derived masses by comparing the stellar masses obtained with CB07 and BC03 models respectively.
4.1 The Impact of the TP-AGB phase on the derived stellar masses
At a redshift of 3 the age of the universe is 2 Gyrs, putting an upper limit in the age of those galaxies at 1–2G yrs. As the AGB stars are of intermediate age ( 1 Gyr), one would expect to find such stars in the stellar content of 3 galaxies. If this is the case, since AGB stars are the dominant bolometric and near–IR contributors in stellar populations with ages 1 Gyr, the AGB–phase should be of great importance for the interpretation of the rest–frame near–IR Spitzer colours of these galaxies. Recent studies of 2 galaxies (e.g., Maraston et al. 2006, Eminian et al. 2007, Wuyts et al. 2007) have shown that incorporating the TP–AGB phase in the stellar synthesis population codes has resulted in the reduction of the estimated stellar masses and age by a factor of 2.
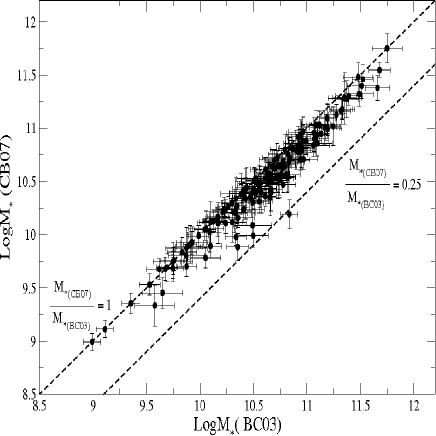
To investigate the impact of the new AGB recipe in the derive stellar masses of our sample, we compared the stellar masses derived from on CB07 model to those based on BC03 models. This comparison is illustrated in Figure 1 where for each LBG we plot the stellar masses as derived from the best-fit CB07 models over those derived based on BC03 ones. This Figure clearly demonstrates that the masses based on BC03 models are consistently higher than those predicted by CB07. The mean stellar mass of the population is log(M∗) = 10.621 0.106 and 10.448 0.099 for BC03 and CB07. This implies that the addition of the AGB phase results in the reduction of the derived stellar masses on average by 40% for our whole IRAC detected sample. We note however, that the reduction factor varies, and for some cases it can get as high as 3.
4.2 The Stellar masses
As stated above, stellar mass is a robust parameter that is less sensitive to uncertainties compared to other parameters. In Magdis et al. (2008), we showed for the first time that LBGs are a rather inhomogeneous population, ranging from those with bright IRAC fluxes and R3.61.5 to those with R3.61.5 and marginal IRAC detection. Such diversity on the rest–frame optical colours of LBGs was also presented by Shapley et al. (2005). Here we aim to translate this range in the IRAC colours into a range of the stellar masses. As stated above, stellar mass is a robust parameter that is less sensitive to uncertainties compared to other parameters. To visualize the stellar masses distribution of the population, in Figure 2 we present a histogram of the inferred stellar masses for the whole Spitzer LBG sample and for LBGs with 8m detection or without 8m detection but [3.6]AB 23 (i.e. extended 8m sample).
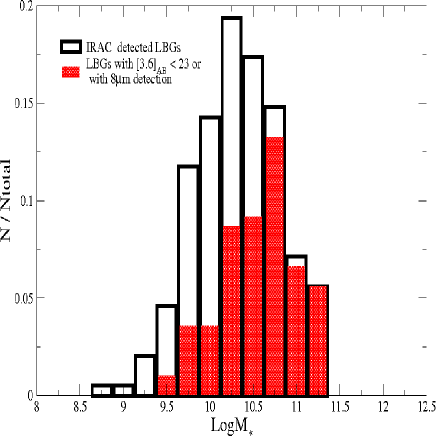
The majority of the massive LBGs belong to the extended 8m sample which has a median stellar mass of log M∗ = 10.711 0.105, while for the rest LBGs the corresponding value is log M∗ = 10.169 0.121. In total, there are 62 LBGs with estimated stellar masses M∗ 5 10M⊙. Of these, 39 belong to the 8m sample, 51 to the extended 8m sample and only 5 to the remaining LBG sample. The same numbers for galaxies with M∗ 1011M⊙ are 21, 26 and 1 respectively. Splitting the 8m sample in two groups, those with [8.0]AB 22.5 and those with [8.0]AB 22.5 and performing a K-S test between the stellar masses of the two groups, reveals a significant difference between them (P =3.14 10-7). In particular, we find that LBGs with bright 8m fluxes are more massive, with median stellar mass log M∗ = 11.017 0.102, compared to log M∗ = 10.501 0.113 for the 8m faint LBGs.
We now focus on 24m detected LBGs in HDFN. These LBGs are also detected at 8m with a median 8m magnitude of [8.0]AB = 22.17 0.11. The corresponding median 8m magnitude of the 24m undetected LBGs in HDFN is [8.0]AB = 23.05 0.15, indicating that they are on average fainter at 8m than the 24m detected LBGs. A K-S (Kolmogorov-Smirnov) test between the 8m magnitude distributions of the two samples confirms the significant difference between them at a confidence level of 98 (P =0.021). On the other hand a second K-S test between the 8m fluxes of the 24m detected LBGs and the 24m undetected LBGs with [8.0]AB 22.5, reveals that the two samples are similar at a confidence level of 68%, showing that 24m LBGs represent the bright end of the 8m sample. From the above analysis, it is expected that 24m LBGs are among the most massive galaxies in our sample. Indeed, 24m LBGs have a median stellar mass of log M∗ = 10.901 0.109 , while the 24m undetected LBGs are less massive, with median, log M∗ = 10.396 0.101.
As discussed above, the age–dust degeneracy makes the parameterization of these two properties uncertain and difficult to constrain. With this in mind, it is worth noting that all LBGs with derived ages tsfr 160 Myrs belong to the extended 8m sample. Furthermore, the median age of the 8m undetected, the 8m faint ([8.0]AB 22.5) and 8m bright ([8.0]AB 22.5) LBGs is 255.00, 404.154 and 980 Myrs respectively. Finally, if we restrict our sample to LBGs with comparable tsfr, we find that those in the extended 8m sample are consistently more massive than those with IRAC faint colours. Since, in the same time interval, LBGs with 8m detection or [3.6]AB 23, have grown significantly larger stellar masses, we suggest that they are among the highest star forming LBGs or that they have undergone more intensive star formation episodes than the rest LBGs. We note that although the current data cannot rule out in a definitive way that the 24m emission of these systems originates from hot dust heated by an AGN, the lack of AGN signature in their rest-frame UV spectra as well as their SED, that resembles cold SCUBA sources (Huang et al. 2005), suggests that they are dominated by star formation.
Bringing these results together, we find that LBGs with bright IRAC fluxes are more massive and older when compared to the rest of the sample. This analysis has also revealed that although the addition of the AGB–phase has reduced the estimated stellar masses of LBGs, a substantial fraction of LBGs is still found to be massive with M∗ 51010 M⊙. LBGs with 8m detection are among the most massive in the present sample, while at the high end of the stellar mass distribution of the population we find LBGs with MIPS 24m emission.
This range in the stellar masses of the LBGs has also been
reported in previous studies (e.g Papovich et al. 2001, Shapley 2001,
Reddy et al. 2006, Rigopoulou et al. 2006). These studies however,
were based on SSP codes without a sophisticated treatment of the
AGB–phase, namely using BC03. A direct comparison with our results
indicates that these studies have overestimated the stellar masses of
the LBGs by a factor of 1.5–2. For example, Rigopoulou et al. (2006)
reports a median stellar mass for the 8m detected LBGs of
M∗ = 10.98 0.112, 1.8 times higher than that
found in our study. Hence, it becomes apparent that a fraction of the
the rest–frame NIR light that was previously attributed to a number
of relatively old stars (BC03) is now (CB07) interpreted as light
emitted from stars in the AGB phase, resulting in the reduction of the
derived stellar mass. We conclude that although the addition of the
AGB–phase has not narrowed the range of the stellar masses of the
LBGs, it has reduced the stellar mass budget of the population and to a greater extend of all star-forming galaxies older than 0.1Gyrs.
4.3 Mass to Light ratios as a function of wavelength
It has been suggested that estimates of stellar mass from photometric measurements become increasingly reliable as one obtains longer wavelength data (e.g. Labbe et al. 2005), and that the addition of longer wavelength photometric points (i.e. the IRAC bands) plays a key role in our understanding of the properties of the LBG population as a whole. Here, we investigate the distribution of stellar mass with rest–frame wavelength as we move from optical to the near–infrared bands.
In Figure 3(top) we show the distribution of stellar masses for all IRAC detected LBGs, as a function of absolute [3.6] m magnitude which at the median redshift of 3 corresponds to rest–frame 0.9m (i.e. I–band). There is clearly a correlation between absolute I–band magnitude and stellar mass (correlation coefficient r=0.74) while at the bright end (where most of the massive galaxies are found) the correlation becomes tighter (r=0.90, if we exclude the outlier). The M/LI values (both M and L normalized in solar units) range from 0.6 ( 5 times lower than that of the present day galaxies (Bell et al. 2003)) to 0.02, revealing a scatter of 30.
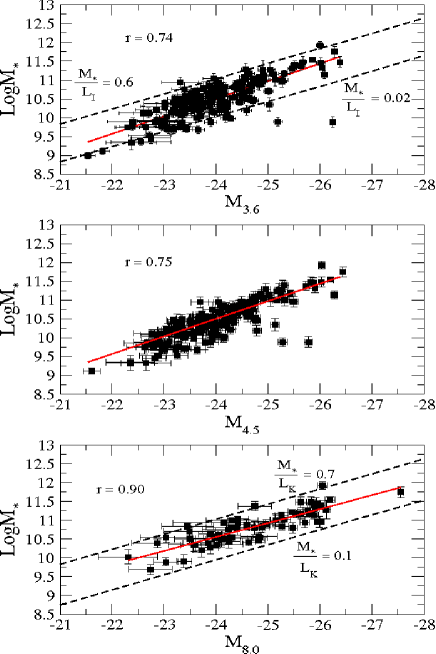
The spread in the M/LI values can be attributed to the wide range of star–formation histories among the LBGs and it is therefore rather difficult to associate a single I–band rest–frame luminosity to specific a stellar mass. The situation remains the same at 4.5m as shown in Figure 3 (middle panel).
Likewise, in Figure 3 bottom panel we plot the
distribution of stellar masses as a function of absolute 8.0m
magnitude which would correspond to rest–frame 2.0 m
(i.e. K–band). The correlation between stellar mass and magnitude
becomes tighter with r = 0.90 while the scatter in M/ values
decreases and is now a factor of 7.0. The largest M/LK
values approach that of the present day galaxies but the average is
0.23, i.e. several times smaller. Due to the small scatter in the M/L
values of the LBGs with 8m detection, one can crudely associate a
K–band rest–frame absolute magnitude to a specific stellar mass
through the relation :
Log(M∗/M⊙) 2.01 ( 0.65) 0.35( 0.03)M8.0.
From these simple comparisons, one can conclude that the mid–IR bands and especially the IRAC 8m band (which samples the rest frame NIR wavelengths for 3 LBGs) provide a more accurate estimate of the M/L ratio compared to that obtained when using optical bands. To further illustrate this argument, in Figure 4 (top panel) we plot the distribution of stellar mass as a function of absolute R–band magnitude, for all LBGs in the present sample with at least one IRAC detection. The correlation coefficient drops to 0.32 and a mass to light relation cannot be established using only optical photometric points as the scatter in the M/L values is very large (possibly due to different star formation histories). With the addition of IRAC data this scatter decreases and is best correlated with the IRAC 8 m band. This was somewhat expected since this band is sensitive to the light from the bulk of the stellar activity accumulated over the galaxy’s lifetime (see also Bell & de Jong 2001).
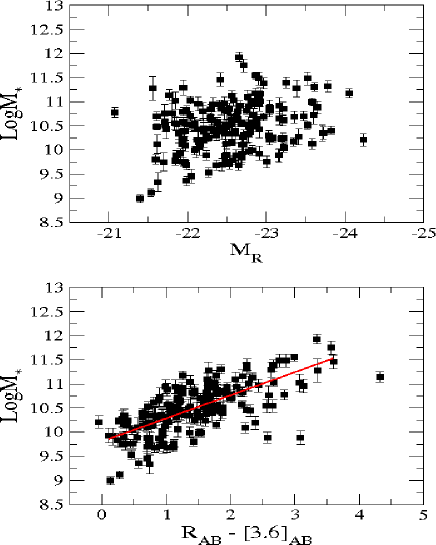
The region of the spectrum that becomes sensitive to the ratio between the current star formation and the integral of past star formation, is between the UV and the NIR, conveniently measured by the observed R [3.6]AB colour in the current sample. This point is illustrated in Figure 4 (bottom panel), which shows that the inferred stellar mass is well correlated with R [3.6]AB. In fact, the correlation between the R [3.6]AB colour and the inferred stellar mass is almost as significant as the correlation between stellar mass and M4.5μm, with LBGs with redder R [3.6AB] colours having higher stellar masses. Finally, we note that in the high end of the stellar distribution one can find only LBGs that belong to the extended 8m sample. It is the bright IRAC colours that disentangle between the several star formation histories and provide a robust estimate of the mass to light ratios. Finally, “red” LBGs with faint IRAC colours and hence low stellar masses could exist and occupy the bottom–right corner of Figure 4 but are not present in the current sample due to the limiting apparent R magnitude ( 25.5 ) of their selection.
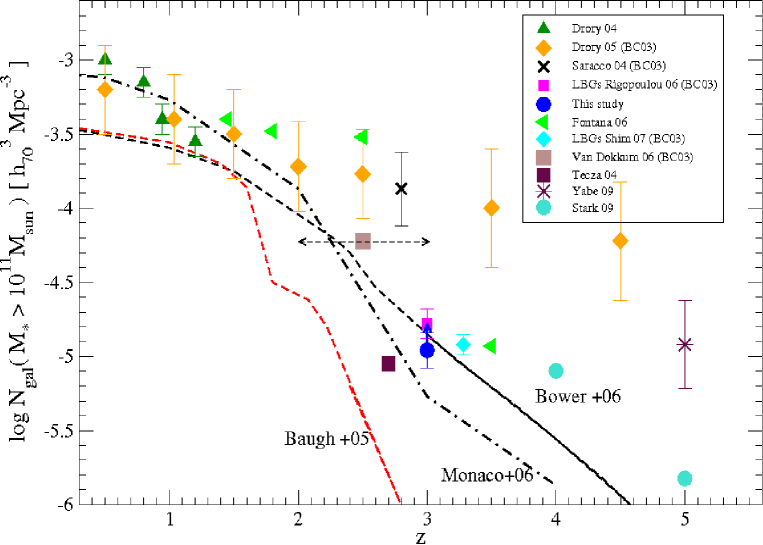
5 Number Density of Massive LBGs
It is interesting to find that, even after the addition of the AGB–phase, the best–fit CB07 results indicate that 15% of the LBGs in the present sample has estimated stellar masses (M∗ 1011M⊙). These galaxies are mainly found among the LBGs that have IRAC 8m detection, consisting an ideal sample of high– K-selected galaxies. In Figure 5 we plot the number density of massive (M∗ 1011 M⊙) LBGs in our sample as a function of redshift and compare the value with other observational results (Drory et al. 2005; Saracco et al. 2004; Fontana et al. 2006; Rigopoulou et al. 2006, Shim et al. 2007, Tecza et al. 2004, Van Dokkum et al. 2006). If we assume an effective volume for the U–dropouts V = 450 h-3 Mpc3 arcmin-2 (Steidel et al. 1999), the effective co–moving volume becomes V = 1400 Mpc3 arcmin-2 (the volumes have been weighted according to the number of objects per R–magnitude bin, = 0.3, = 0.7 cosmology with H0 = 70 km s-1 Mpc-1). For the LBGs with M∗ 1011 M⊙ in the 1066 arcmin2 covered by our study, the derived co–moving density at the average redshift 3, is = (1.12 0.4) 10-5 Mpc-3 (the uncertainty of the derived number density is based on Poisson error). This value is lower by a factor of 1.5 when compared to that found when we consider stellar masses derived from BC03 models (1.67 0.32 10-5 Mpc-3). It is worth noticing that our BC03 result is in excellent agreement with that of Rigopoulou et al. (2006) for a sample of 148 LBG in EGS. On the other hand, for the LBGs with M∗ 81010 M⊙, we derive a co–moving density of = (1.75 0.26) 10-5 Mpc-3 comparable to that of the BC03 result for LBGs with M∗ 1011 M⊙.
We have to stress that due to the spectroscopic selection of the LBGs in the present sample, we are restricted to optically bright (or rest–frame UV-bright) LBGs (R 25.5). Therefore, our sample does not account for the optically faint (R 25.5) LBGs as well as for other optically faint massive populations at 3, such as DRGs and SMGs. Reddy & Steidel (2009) found that the fraction of massive galaxies among UV-faint galaxies in general is very small (2%) given the steep faint-end slope of the UV luminosity function. On the other hand, Van Dokkum et al. (2006) suggests that 77% of the massive galaxies at 23 are selected as DRGs and 20% as UV-bright LBGs. Furthermore, Tecza et al. (2004), report a number density of 8.9 10-6 Mpc-3 for massive SMGs Given that the overlap between LBGs and the rest of the populations is small (between DRGs and LBGs 7% (Van Dokkum et al. (2006) while between LBGs and SMGs is probably larger, 15% (Chapman et al. 2005)), we note that the above number density of massive LBGs should be regarded as a lower limit for massive galaxies at 3. Despite the biases introduced by different selection techniques, LBGs constitute the largest existing sample of star–forming galaxies at 3 with confirmed spectroscopic redshift and therefore, our result places a firm and robust lower limit on the number density of massive galaxies at 3.
It is also worth comparing the present result with several theoretical predictions from semi–analytical models. In Figure 5 it is evident that for the case of Baugh et al. (2005) the evolution of the number density of massive (M∗ 1011 M⊙) galaxies with redshift is slower than the prediction of hierarchical models, at least in the redshift range 03. On the other hand, the discrepancy between the model and the observational constraints is much reduced when one considers more recent predictions by Bower et al. (2006) and Monaco et al. (2006). The galaxy formation model presented by Bower et al. (2006) is based on the hierarchical model of Cole et al. (2000). The key assumptions of this model are that at high– the cooling times in halos were short enough to allow the gas to cool on the free-fall timescale and that at the black hole masses were lower at high–. These two assumptions make the AGN feedback in their model less effective, allowing high– massive galaxies to be built in the framework of the hierarchical model. We note that the fact that Bower et al. (2006) predictions exceed the number density of our sample is reasonable, since it allows for other massive galaxies, that are not selected with the Lyman Break technique, to exist at 3.
5.1 Stellar Mass Density of 3 LBGs
Determining the evolution of the global stellar mass with redshift is one of the most challenging tasks of modern cosmology. Hence, it would be interesting to estimate the Stellar Mass Density (SMD) of our sample and attempt to place constraints on this property. Given the depth of our observations, our sample is complete at stellar masses M∗ 2 1010M⊙. Therefore, we choose to integrate from log(M∗/M⊙ )=10.301 to log(M∗/M⊙)= 13 and derive a SMD = 7.08 0.8 106 M⊙Mpc-3. A comparison with the SMD at 0.1 as estimated by Cole et al. 2001, indicates that UV-bright LBGs with M∗ 2 1010M⊙ at 3 harbor 2.5% of the total stellar mass seen in the local universe. However, we have to stress that our sample is censored both at the high and low mass end: As discussed above, the Lyman Break selection technique misses 80% of the massive galaxies at the redshift range =2-3, although the actual fraction at 3 has not yet been quantified. On the other hand, focusing on the LBGs with IRAC detection introduces a bias against LBGs of lower stellar mass. Furthermore, as pointed out by Reddy Steidel (2009), apart from the luminous and massive high– galaxies, the faint–UV and less massive galaxies could also play an important role in the stellar mass assembly at these redshifts. More particularly, they claim that, for galaxies with M∗ 1011M⊙, the total stellar mass contained in UV–faint is roughly equal to that contained in UV-bright galaxies. Hence, the above value is a lower limit not only for the whole 3 galaxies but also for the U-dropouts. Although we cannot make any safe assumptions about the fraction of massive LBGs and thus correct for the stellar masses residing in massive galaxies at 3, if we account for the contribution of the UV-faint galaxies to the stellar mass assembly, we find a SMD 1.2 107 M⊙Mpc-3 for the UV selected galaxies at 3.
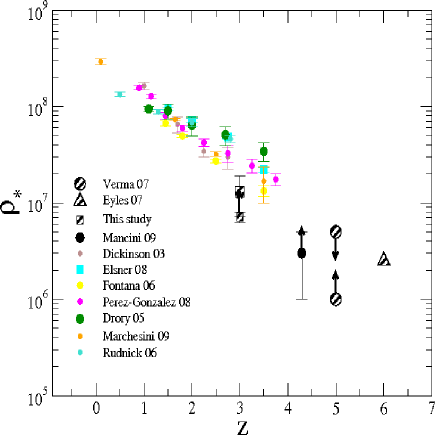
We now compare the SMD of our sample with that of other contemporary studies. In Figure 6, we plot the evolution of the total stellar mass density as a function of redshift for several samples drawn from the literature (Fontana et al. 2006, Dickinson et al. 2003, Rudnick et al. 2006, Drory et al. 2005, Perez-Gonzalez et al. 2008, Elsner et al. 2008, Marchesini et al. 2009 (MUSYC), Verma et al. 2007, Eyles et al. (2007), and Mancini et al. 2009). The values from the literature derived assuming a Salpeter (1955) IMF have been scaled to a pseudo-Chabrier IMF by dividing the stellar mass densities by a factor of 1.8. Although the values from the literature are either at lower or higher than our sample, we note that our value is broadly consistent with previous studies. The fact that, even after correcting for the contribution of faint-UV galaxies, our value is lower by a factor of 2 when compared to the general trend can be attributed to the stellar masses of optically faint massive galaxies (i.e DRG,SMGs) and to systematics introduced by the different methods used to derive the stellar masses, especially the treatment of the AGB phase.
It is also interesting to compare our result with that of Verma et al. (2007), since the photometric criteria for selecting LBGs at 5 in their study were chosen to match that of Steidel et al. (2003) for our sample. It seems that LBGs at 3 have assembled 2–4 times more stellar mass than their high– counterparts. We note again, that this type of analysis suffers from large uncertainties introduced by selection biases, cosmic variance and different methods of stellar mass determination, making it difficult to securely draw conclusions. On the other hand, LBGs at 3 consist of the largest existing sample of high– galaxies with confirmed spectroscopic redshift and hence their study provides robust constraints on the nature of high– galaxies.
6 The star formation mass correlation at = 3
Recently, Daddi et al. (2008), have shown that the UV-corrected star formation rate and stellar mass define a tight correlation in K-selected galaxies at 2. Similar results have been reached by Noeske et al. (2007) and Elbaz et al. (2007) for galaxies at 1 and at = 0 based on data drawn from the Sloan Digital Sky Survey (Elbaz et al. 2007), although with a lower normalization reflecting the overall decline in cosmic SFR density with time (Madau et al. 1996). On the other hand, Daddi et al. (2009), based on an IRAC sample of B–dropouts, showed that the locus of typical massive 4 B-dropouts doesn’t support a continuously increasing specific star formation rate (SSFR defined as the current SFR per unit stellar mass, ) with redshift, suggesting instead a plateau of the SSFR at 2. Here, we try to fill the gap between =2 and =4 and examine the SFR-stellar mass relation at =3.
To determine the UV-corrected star-formation rate we use the UV luminosity, assuming a CSF, Calzetti (2000) extinction law and solar metallicity. At 3 the observed R and G bands correspond to rest–frame 1600 and 1200 respectively. We use these measurements to derive the slope of the UV spectrum for each galaxy, after applying a correction for the IGM attenuation that follows the prescription of Madau et al. (1995). Then, based on the best-fit CB07 model SED derived as discussed in section 3.1, we apply a K-correction to derived the observed flux at 1500 and a Calzetti (2000) law to estimate the intrinsic L1500 for each galaxy in our sample. To convert the intrinsic L1500 to star-formation rate we use the relation adopted by CB07 models :
| (1) |
Before going any further we have to stress that this technique suffers from several limitations. In applying a reddening correction the technique assumes that the UV spectral slope is entirely due to reddening, rather than to the presence of evolved stellar populations. Furthermore, the strongest starbursts are opaque to UV radiation and their total SFR activity cannot thus be reliably estimated solely from the UV, even after reddening corrections (e.g., Goldader et al. 2002; Buat et al. 2005, Reddy et al. 2006). On the other hand, Rigopoulou et al. (2006) argued that the fact that a fraction of LBGs is detected at 24m implies the existence of significant amounts of dust. This indicates that dust and not evolved stellar populations is responsible for the UV spectral slope, favoring a CSF history. Moreover, Carilli et al. (2008), based on stacking radio analysis of U-dropouts from the Cosmos field, found that the SFR implied by the radio luminosities are larger by a factor of 1.8 when compared to that derived from UV luminosities without correcting for dust extinction.
Finally, Chapman et al. (2009) and Rigopoulou et al. (2009) (in preparation) using SCUBA and IRAM observations both report on the detection of LBGs in sub-mm. In particular, Chapman et al. (2009) finds a good agreement between UV and S850 derived SFR at faint sub-mm levels and suggest that LBGs may contribute significantly to the source counts of sub-mm selected galaxies in the 1-2mJy regime. This indicates that considerable amounts of dust are found in LBGs. Evidence, that LBGs contain significant amounts of dust have also been provided by several other studies such as Adelberger & Steidel (2001), Papovich et al. (2001), Shapley et al. (2001), Reddy et al. (2006, 2008). This, along with the fact that LBGs are (from their selection) blue actively star-forming galaxies, enforces the assumption of a UV spectrum reddened by the presence of dust rather than by a decaying SFR. Hence, the main source of uncertainty in our approach should be the adopted extinction law and the geometry of the distribution of the dust.
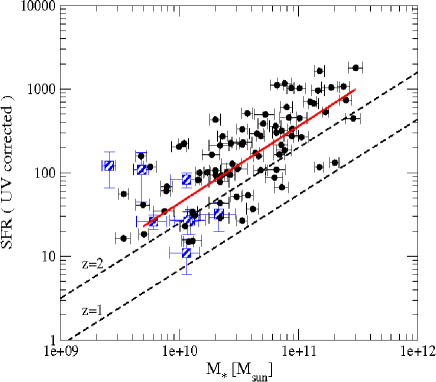
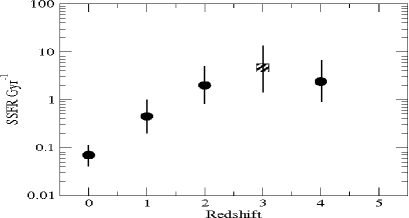
Having discussed the uncertainties, in Figure 7 we show the SFR–stellar mass relation using the UV corrected SFRs and the stellar masses as estimated by our CB07 analysis assuming a CSF history. We restrict our sample to LBGs at 2.83.2, detected at both 3.6 and 4.5 m and R 0.2 ( where R is the error of the RAB magnitude) to reduce the uncertainty on the estimated slope, and therefore the SFR. A linear regression fit to our data suggests a relatively tight correlation (r = 0.70) with a logarithmic slope 0.91 (although with considerable scatter), implying that more massive LBGs tend to have higher star-formation rates. The slope of this correlations is similar to that at lower redshifts (Daddi et al. 2008, Elbaz et al. 2007, Noeske et al. 2007) but with higher normalization factor. On the other hand, the current normalization factor is higher than that of the B-dropouts at 4. With a median specific star formation rate, of 4.5Gyrs-1, which is larger by a factor of two than that of 2 and 4 samples, it seems that the evolution of the SSFR peaks at 3 and then drops towards lower redshifts (Figure 7 bottom).
Contrary to our findings, Mannucci et al. (2009), based on SFRs derived from H fluxes of LBGs, argued that 3 LBGs do not show a correlation between SFR and stellar mass. To investigate this discrepancy we include their results in Figure 7(top). We see that the small number as well as the small range of the stellar masses of the LBGs in their sample are not sufficient to reveal any correlation. As a matter of fact their result is in agreement with ours for a small stellar mass bin. Indeed, if we restrict our sample to LBGs with 9logM∗/M⊙10.3, the scatter in their sample is similar to the one we find, indicating that there is no correlation between SFR and stellar mass. It is the large numbers and the large stellar mass range of our sample that enables the detection of the correlation. A similar trend although with shallower slope is also reported by Erb et al. (2006) for a sample of 2 UV selected galaxies. We conclude that although further investigation is required, the SFR-stellar mass relation seen in lower redshifts, seems to hold for 3 LBGs. Finally, one should note that the average SFR found for our sample ( 100M⊙yr1), should be regarded as typical only for IRAC detected and hence more massive LBGs.
7 Summary
Using IRAC photometry for a robust sample of 196 LBGs at 3 with confirmed spectroscopic redshift, we carried out a detailed mid-IR study of the LBG population. For our analysis we used both the new CB07 code that incorporates an updated prescription of the AGB phase as well as the widely used BC03. The following results were reached:
Stellar masses Based on results derived by the CB07 code, we constrained the properties of the population. We find that although the addition of the AGB phase has resulted in the reduction of the derived stellar masses, on average by a factor of 1.4, the range of the stellar masses of the LBGs is similar to that found by previous studies. In particular, we find that the stellar masses of the population span from M∗ 109 M⊙ for LBGs with faint IRAC colours to M∗ 1011 M⊙ for a fraction of LBGs detected at 8m and for ILLBGs. The inferred ages of these massive systems are considerably higher than the rest of the population, indicating that they have been star-forming for 1 Gyr. We show how the stellar mass correlates with wavelength and find that IRAC bands improve dramatically the accuracy of the derived M/L ratios when compared to that obtained when using optical bands. Finally, we show that LBGs with redder R-[3.6]AB colours have higher stellar masses.
Number Density and Stellar mass Density of massive LBGs We find that even after the addition of the AGB phase in the SED models, a considerable fraction of LBGs (15%) is massive, with stellar masses M∗ 1011M⊙. We calculate the number density of these LBGs and find = (1.12 0.4) 10-5 Mpc-3. This is 1.5 times lower than that predicted from previous studies, providing a better match with current theoretical models. The stellar mass density of IRAC detected, optically bright LBGs is = 7.08 0.8 106 M⊙Mpc-3, indicating a lower limit for the stellar mass density of the whole UV selected population of =3 galaxies, 1.2 105 M⊙Mpc-3. Comparing our result with values from the literature, we find that LBGs at =3 have assembled 2-4 times more stellar mass than their high- siblings.
Star-formation–Mass correlation at We find a relatively tight correlation between the UV–corrected SFR and stellar mass for galaxies at =3. This correlation has a similar slope to that found at other redshifts, but a higher normalization factor. We find an average SSFR of 4.6Gyr-1 for our sample, indicating that the evolution of the SSFR peaks at =3 and drops at lower redshifts.
8 Acknowledgments
This work is based on observations made with the Spitzer Space Telescope, which is operated by the Jet Propulsion Laboratory, California Institute of Technology under a contract with NASA. Support for this work was provided by NASA through an award issued by JPL/Caltech. GEM would like to thank S. Charlot for providing the new CB07 code as well as D. Elbaz, H. Aussel and E. Daddi for useful discussions.
References
- [Rigopoulou et al. ¡2006¿] Alonso-Herrero, A., Perez-Gonzalez, P. G., Alexander, D. M., et al., 2006, ApJ, 640, 167A
- [Rigopoulou et al. ¡2006¿] Barmby, P., Huang, J.-S., Fazio, G. G., et al., 2004, ApJS, 154, 97B
- [Rigopoulou et al. ¡2006¿] Baugh, C. M., et al., 2005, MNRAS, 356, 1191B
- [Rigopoulou et al. ¡2006¿] Bell, E. F. & de Jong, R. S., 2001, ApJ, 550, 212B
- [Rigopoulou et al. ¡2006¿] Bell, E. F., McIntosh, D. H., Katz, N., Weinberg, M. D., 2003, ApJS, 149, 289B
- [Rigopoulou et al. ¡2006¿] Bertoldi, F., Carilli, C. L., Menten, K. M., et al., 2000, A&A, 360, 92B
- [Rigopoulou et al. ¡2006¿] Bower, R. G., et al., 2006, MNRAS, 370, 645B
- [Rigopoulou et al. ¡2006¿] Bruzual, G., 2007, ASPC, 374, 303B
- [wRigopoulou3 et al. ¡2006¿] Bruzual, G. & Charlot, S., 2003, MNRAS,344, 1000B
- [Rigopoulou et al. ¡2006¿] Buat, V., Iglesias-Paramo, J., Seibert, M., 2005, ApJ, 619L, 51B
- [Rigopoulou et al. ¡2006¿] Bunker, A. J., Stanway, E. R., Ellis, R. S., McMahon, R. G., 2004, MNRAS, 355, 374B
- [Rigopoulou et al. ¡2006¿] Calzetti, D., Armus, L., Bohlin, R. C., Kinney, A. L., Koornneef, J., Storchi-Bergmann, T., 2000, ApJ, 533, 682C
- [Rigopoulou et al. ¡2006¿] Carilli, C. L., Lee, N., Capak, P., et al., 2008, ApJ, 689, 883C
- [Rigopoulou et al. ¡2006¿] Chapman, S.C., Scott, D., Steidel, C.C., et al., 2000, MNRAS, 319, 318C
- [Rigopoulou et al. ¡2006¿] Chapman, S. C., Casey, C. M., 2009, arXiv0903.2244C
- [Rigopoulout et al. ¡2006¿] Charlot, S., Worthey, G. Bressan, A., 1996, ApJ, 457, 625C
- [Rigopoulou et al. ¡2006¿] Cole, S., et al. 2001, MNRAS, 326, 255C
- [Rigopoulou et al. ¡2006¿] Daddi, E., Röttgering, H. J. A., Labbé, I., et al., 2003, ApJ, 588, 50D
- [Rigopoulou et al. ¡2006¿] Daddi, E., Dannerbauer, H., Elbaz, D., Dickinson, M., Morrison, G., Stern, D., Ravindranath, S., 2008, ApJ, 673L, 21D
- [Rigopoulou et al. ¡2006¿] Daddi, E., Dannerbauer, H., Stern, D., et al., 2009, ApJ, 694, 1517D
- [Rigopoulou et al. ¡2006¿] Dave, R., 2008, MNRAS, 385, 147D
- [Rigopoulou et al. ¡2006¿] Dickinson, M., Papovich, C., Ferguson, H. C., Budavári, T., 2003, ApJ, 587, 25D
- [Rigopoulou et al. ¡2006¿] Donley, J. L., Rieke, G. H., Perez-Gonzalez, P. G., Rigby, J. R., Alonso-Herrero, A., 2007, 2007ApJ, 660, 167D
- [Rigopoulou et al. ¡2006¿] Donley, J. L., Rieke, G. H., Perez-Gonzalez, P. G., Barro, G., 2008, ApJ, 687, 111D
- [Rigoproulou et al. ¡2006¿] Drory, N., et al., 2005, ApJ, 619L, 131D
- [Rigopoulou et al. ¡2006¿] Elbaz, D., Daddi, E., Le Borgne, D., et al., 2007, A&A, 468, 33E
- [Rigopoulou et al. ¡2006¿] Elsner, F., Feulner, G., Hopp, U., 2008, A&A, 477, 503E
- [Rigopoulouh et al. ¡2006¿] Eminian, C., et al., 2008, MNRAS, 384, 930E
- [Rigopoulou et al. ¡2006¿] Erb, D. K., Shapley, A. E., Steidel, C. C., et al., 2003, ApJ, 591, 101E
- [Rigopoulou et al. ¡2006¿] Erb, D. K., Shapley, A. E., Pettini, M., Steidel, C. C., Reddy, N. A., Adelberger, K. L., 2006, ApJ, 644, 813E
- [Rigopoulou et al. ¡2006¿] Erb, D. K., Steidel, C. C., Shapley, A. E., Pettini, M., Reddy, N. A., Adelberger, Kurt L., 2006, ApJ, 647, 128E
- [Steidwel et al. ¡2003¿] Eyles, Laurence P., et al., 2007, MNRAS, 374, 910E
- [Fazio et al. ¡2004¿] Fazio, G. G., et al. 2004, ApJS, 154, 106, ApJ, 645, 115R
- [Rigopoulou et al. ¡2006¿] Figer, D. F., 2005, Nat., 434, 192F
- [Rigopoulou et al. ¡2006¿] Fontana, A., Salimbeni, S., Grazian, A., et al., 2006, A&A, 459, 745F
- [Rigopoulou et al. ¡2006¿] Franx, M., Labbé, I., Rudnick, G., et al., 2003, ApJ, 587L, 79F
- [Rigopoulouh et al. ¡2006¿] Frogel, Jay A., Mould, Jeremy, Blanco, V. M., 1990, ApJ, 352, 96F
- [Rigopoulou et al. ¡2006¿] Glazebrook, K, Abraham, R. G., McCarthy, P. J., 2004, Nat, 430, 181G
- [Rigopoulou et al. ¡2006¿] Goldader, J. D., Meurer, G., Heckman, T. M., Seibert, M., Sanders, D. B., Calzetti, D., Steidel, C. C., 2002, ApJ, 568, 651G
- [Rigopoulou et al. ¡2006¿] Huang, J.-S., Rigopoulou, D., Willner, S. P., et al., 2005, ApJ, 634, 137H
- [Rigopoulou et al. ¡2006¿] Hughes, D.H., Serjeant, S.,; Dunlop, J., et al., 1998, Nat, 394, 241H
- [Rigopoulou et al. ¡2006¿] Ivison, R. J., Greve, T. R., Smail, I., et al., 2002, MNRAS, 337, 1I
- [Rigopoulou et al. ¡2006¿] Ivison, R. J., Smail, I., Dunlop, J. S., et al., 2005, MNRAS, 364, 1025I
- [Rigopoulou et al. ¡2006¿] Labbe, I., Huang, J., Franx, M., et al., 2005, ApJ, 624L, 81L
- [Rigopoulou et al. ¡2006¿] Lacey, C. G., Baugh, C. M., Frenk, C. S., Silva, L., Granato, G. L., Bressan, A., 2008, MNRAS, 385, 1155L
- [Rigopoulou et al. ¡2006¿] Laird, E. S., Nandra, K., Hobbs, A., Steidel, C. C., 2006, MNRAS, 373, 217L
- [Rigopoulou et al. ¡2006¿] Nandra, K., Mushotzky, R. F., Arnaud, K., Steidel, C. C., Adelberger, K. L., Gardner, J. P., Teplitz, H. I., Windhorst, R. A., 2002, ApJ, 576, 625N
- [Rigopoulou et al. ¡2006¿] Madau, P., 1995, ApJ, 441, 18M
- [Rigopoulou et al. ¡2006¿] Madau, P., Ferguson, H. C., Dickinson, M. E., Giavalisco, M., Steidel, C. C., Fruchter, A., 1996, MNRAS, 283, 1388M
- [Rigopoulou et al. ¡2006¿] Magdis, G. E., et al., 2008, MNRAS, 386, 11M
- [Steidvel et al. ¡2003¿] Mancini, C., et al., 2009, arXiv0901.3341M
- [Rigopoulou et al. ¡2006¿] Mannucci, F., Cresci, G., Maiolino, R., et al., 2009, arXiv0902.2398M
- [Rigopoulou et al. ¡2006¿] Marchesini, D., van Dokkum, P. G., Forster Schreiber, N M., Franx, M., Labbe, I. Wuyts, S., 2008, arXiv0811.1773M
- [Rigopoulouy et al. ¡2006¿] Maraston, C., 1998, MNRAS, 300, 872M
- [Rigopoulout et al. ¡2006¿] Maraston, C., 2005, MNRAS, 362, 799M
- [Rigopoulou4 et al. ¡2006¿] Maraston, C. et al., 2006, ApJ, 652, 85M
- [Rigopoulout et al. ¡2006¿] Marigo, P. & Girardi, L., 2007, A&A, 469, 239M
- [Rigopoulou et al. ¡2006¿] Monaco, P., Fontanot, F., Taffoni, G., 2007, MNRAS, 375, 1189M
- [Rigopoulou et al. ¡2006¿] Nagamine, K., Fukugita, M., Cen, R., Ostriker, J. P., 2001, MNRAS, 327L, 10N
- [Rigopoulou et al. ¡2006¿] Nagashima, M., Lacey, C. G., Baugh, C. M., Frenk, C S., Cole, S., 2005, MNRAS, 358, 1247N
- [Rigopoulou et al. ¡2006¿] Nandra, K., Mushotzky, R. F., Arnaud, K., Steidel, C. C., Adelberger, K. L., Gardner, J. P., Teplitz, H. I., Windhorst, R. A., 2002, ApJ, 576, 625N
- [Rigopoulou et al. ¡2006¿] Noeske, K. G., Weiner, B. J., Faber, S. M., et al., 2007, ApJ, 660L, 43N
- [Rigopoulou et al. ¡2006¿] Ouchi, M., Shimasaku, K., Okamura, S., et al., 2004, ApJ, 611, 660O
- [Rigopoulou et al. ¡2006¿] Ouchi, M., Shimasaku, K., Okamura, S., et al., 2004, ApJ, 611, 685O
- [Rigopoulou et al. ¡2006¿] Papovich, C., Dickinson, M., Ferguson, H., C., 2001, ApJ, 559, 620P
- [Rigopoulou et al. ¡2006¿] Papovich, C., et al., 2006, ApJ, 640, 92P
- [Rigopoulou et al. ¡2006¿] Perez-Gonzalez, Pablo G., Rieke, G. H., Villar, V., et al., 2008, ApJ, 675, 234P
- [Rigopoulou et al. ¡2006¿] Pettini, M., Shapley, A. E., Steidel, C. C., Cuby, J-G., Dickinson, M., Moorwood, A. F. M., Adelberger, K. L., Giavalisco, M., 2001, ApJ, 554, 981P
- [Rigopoulou et al. ¡2006¿] Pettini, M. & Pagel, B. E. J., 2004, MNRAS, 348L, 59P
- [Rigopoulou et al. ¡2006¿] Reddy, N. A. & Steidel, C. C., 2004, ApJ, 603L, 13R
- [Rigopoulou et al. ¡2006¿] Reddy, N. A., Erb, D. K., Steidel, C. C., Shapley, A. E., Adelberger, K. L., Pettini, M., 2005, ApJ, 633, 748R
- [Rigopoulou et al. ¡2006¿] Reddy, N. A.; Steidel, C C., Fadda, D., Yan, L., Pettini, M., Shapley, A. E., Erb, Dawn K., Adelberger, K. L., 2006, ApJ, 644, 792R
- [Rigopoulou et al. ¡2006¿] Reddy, Naveen A. & Steidel, Charles C., 2009, ApJ, 692, 778R
- [Rigopoulou1 et al. ¡2006¿] Renzini, A. & Buzzoni, A., 1986, ASSL, 122, 195R
- [Rigopoulou et al. ¡2006¿] Rieke, G. H., Lebofsky, M. J., Thompson, R. I., Low, F. J., Tokunaga, A. T., 1980, ApJ, 238, 24R
- [Rigopoulou et al. ¡2006¿] Rieke, G. H., Loken, K., Rieke, M. J., Tamblyn, P., 1993, ApJ, 412, 99R
- [Rigopoulou et al. ¡2006¿] Rigopoulou, D., et al., ApJ, 648, 81R
- [Steidnel et al. ¡2003¿] Rudnick et al. 2006, ApJ, 650, 624R
- [Rigopoulou et al. ¡2006¿] Salpeter, E. E., 1955, ApJ, 121, 161S
- [Rigopoulou et al. ¡2006¿] Saracco, P., 2004, A&A, 420, 125S
- [Rigopoulou et al. ¡2006¿] Sawicki, M. & Yee, H. K. C., 1998, AJ, 115, 1329S
- [Shapley et al ¡2001¿] Shapley, A. E.,et al., 2001, ApJ, 562, 95
- [Shapley et al ¡2003¿] Shapley, A. E., Steidel, C. C., Pettini, M., Adelberger, K. L. 2003, ApJ, 588, 65
- [Shapley et al ¡2005¿] Shapley, A. E., et al., 2005, ApJ, 626, 698
- [Rigopoulou et al. ¡2006¿] Shim, H., Im, M., Choi, P., Yan, L., Storrie-Lombardi, L., 2007, ApJ, 669, 749S
- [Rigopoulou et al. ¡2006¿] Sirianni, M., Nota, A., Leitherer, C., De Marchi, G., Clampin, M., 2000, ApJ, 533, 203S
- [Rigopoulou et al. ¡2006¿] Smail, I., Ivison, R. J., Blain, A. W., Kneib, J.-P, 2002, MNRAS, 331, 495S
- [Rigopoulou et al. ¡2006¿] Stanway, E. R., Bunker, A. J., McMahon, R. G., Ellis, R. S., Treu, T., McCarthy, P. J., 2004, ApJ, 607, 704S
- [Rigopoulou et al. ¡2006¿] Stark, D. P., Ellis, R. S., Bunker, A., Bundy, K., Targett, T., Benson, A., Lacy, M., 2009, arXiv0902.2907S
- [Rigopoulou et al. ¡2006¿] Steidel, C. C., Giavalisco, M., Dickinson, M., Adelberger, K. L., 1996, AJ, 112, 352S
- [Rigopoulou et al. ¡2006¿] Steidel, C. C., Adelberger, K. L., Giavalisco, M., Dickinson, M., Pettini, M., 1999, ApJ, 519, 1S
- [Rigopoulou et al. ¡2006¿] Steidel, C. C., Adelberger, K. L., Shapley, A. E., Pettini, M., Dickinson, M., Giavalisco, M., 2000, ApJ, 532, 170S
- [Steidefl et al. ¡2003¿] Steidel, C. C., et al., 2003, ApJ, 592, 728
- [Rigopoulou et al. ¡2006¿] Tecza, M., 2004, ApJ, 605L, 109T
- [Rigopoulou et al. ¡2006¿] van Dokkum, P. G.& Ellis, R. S., 2003, ApJ, 592L, 53V
- [Rigopoulou et al. ¡2006¿] van Dokkum, P. G., 2006, ApJ, 638L, 59V
- [Rigopoulou et al. ¡2006¿] van Dokkum, P. G. & van der Marel, R. P., 2007, ApJ, 655, 30V
- [Rigopoulou et al. ¡2006¿] Verma, A., et al., , 2007, MNRAS, 377, 1024V
- [Rigopoulou et al. ¡2006¿] Williams, R. E., Blacker, B., Dickinson, M., et al., 1996, AJ, 112, 1335W
- [Rigopoulou et al. ¡2006¿] Wuyts, S. et al., 2007, ApJ, 655, 51W
| Name | Un-G | G-R | R | 3.6m | 4.5m | 5.8m | 8.0m | |
|---|---|---|---|---|---|---|---|---|
| B20902-C10 | 2.752 | 2.38 | 0.70 | 25.06 | 23.19 0.19 | 23.20 0.16 | - | 24.15 0.50 |
| B20902-C11 | 3.352 | 2.32 | 0.77 | 24.69 | 24.01 0.41 | - | - | - |
| B20902-C5 | 3.098 | 2.47 | 0.93 | 24.70 | 23.71 0.36 | 22.99 0.08 | - | 21.32 0.09 |
| B20902-C6 | 3.099 | 3.45 | 0.45 | 24.13 | - | - | - | - |
| B20902-C7 | 3.195 | 3.16 | 0.37 | 24.52 | - | 24.13 0.37 | - | - |
| B20902-C8 | 2.970 | 2.90 | 0.76 | 24.40 | - | - | - | - |
| B20902-C9 | 3.354 | 3.00 | 1.03 | 24.39 | 23.18 0.19 | 22.93 0.08 | - | - |
| B20902-D11 | 2.835 | 1.81 | 0.29 | 22.97 | 21.71 0.11 | 21.59 0.09 | - | 21.20 0.08 |
| B20902-D14 | 2.766 | 2.20 | 0.59 | 24.40 | 22.38 0.10 | 22.36 0.11 | - | 23.53 0.50 |
| B20902-D8 | 2.867 | 1.80 | 0.24 | 24.24 | 23.52 0.20 | 22.81 0.08 | - | - |
| B20902-D9 | 3.024 | 2.38 | 0.20 | 25.21 | - | - | - | - |
| B20902-M11 | 3.303 | 2.65 | 1.18 | 24.19 | 23.00 0.18 | 22.74 0.10 | - | - |
| B20902-M8 | 3.205 | 2.02 | 0.71 | 25.48 | - | - | - | - |
| B20902-MD16 | 2.732 | 1.74 | 0.60 | 24.34 | 22.66 0.09 | - | - | 22.71 0.50 |
| B20902-MD21 | 2.986 | 2.16 | 1.06 | 24.18 | 22.23 0.10 | 22.49 0.11 | - | 22.87 0.98 |
| B20902-MD24 | 2.904 | 1.25 | 0.25 | 25.20 | - | - | - | - |
| B20902-MD25 | 2.893 | 2.07 | 0.62 | 23.81 | 22.62 0.09 | 22.55 0.10 | - | - |
| B20902-MD28 | 2.917 | 2.18 | 0.87 | 24.62 | 22.52 0.09 | 22.29 0.11 | - | 22.61 0.50 |
| C10-Q1700 | 2.919 | 2.93 | 0.90 | 24.59 | - | - | - | - |
| C23-Q1700 | 3.256 | 3.31 | 0.70 | 23.99 | 23.13 0.26 | 23.06 0.15 | 23.19 0.40 | - |
| C26-Q1700 | 2.904 | 2.88 | 0.70 | 24.46 | 22.88 0.09 | 22.74 0.11 | 22.49 0.21 | 23.13 0.22 |
| C7-Q1700 | 3.030 | 2.75 | 0.95 | 24.83 | 23.05 0.18 | 22.70 0.11 | - | 22.61 0.21 |
| C9-Q1700 | 2.929 | 2.93 | 0.62 | 24.56 | 22.67 0.10 | 22.43 0.10 | 23.08 0.64 | - |
| D17-Q1700 | 3.127 | 1.65 | 0.10 | 24.99 | 22.32 0.13 | 22.11 0.10 | 22.18 0.34 | 22.60 0.21 |
| D19-Q1700 | 2.845 | 2.11 | 0.33 | 25.06 | - | - | - | - |
| D20-Q1700 | 3.010 | 2.69 | 1.04 | 24.10 | 22.45 0.13 | 22.26 0.10 | 22.30 0.21 | 21.87 0.10 |
| D23-Q1700 | 2.861 | 2.20 | 0.68 | 24.11 | 22.88 0.09 | 22.79 0.11 | 22.98 0.64 | 22.77 0.21 |
| D25-Q1700 | 2.905 | 1.91 | 0.23 | 23.81 | 23.00 0.09 | - | 22.83 0.64 | 22.99 0.20 |
| DSF2237b-D19 | 3.265 | 2.14 | 0.19 | 25.08 | 23.08 0.15 | 22.90 0.10 | - | - |
| DSF2237b-D28 | 2.932 | 1.91 | 0.32 | 24.46 | 23.64 0.20 | 23.34 0.19 | - | - |
| DSF2237b-M31 | 3.392 | 2.12 | 0.90 | 24.98 | - | - | - | - |
| DSF2237b-MD72 | 2.399 | 1.13 | 0.13 | 24.31 | 22.81 0.08 | 22.82 0.10 | - | - |
| DSF2237b-MD81 | 2.823 | 1.32 | 0.31 | 24.16 | 21.17 0.06 | 20.82 0.07 | 20.73 0.09 | 20.83 0.10 |
| HDF-C11 | 3.218 | 2.50 | 0.86 | 24.41 | - | - | - | - |
| HDF-C14 | 2.981 | 2.20 | 0.49 | 25.18 | 22.11 0.09 | 21.98 0.10 | 21.89 0.09 | 21.71 0.13 |
| HDF-C17 | 3.163 | 1.92 | 0.29 | 25.42 | 23.75 0.14 | 23.84 0.13 | - | - |
| HDF-C18 | 3.148 | 2.37 | 0.31 | 25.16 | - | - | - | - |
| HDF-C22 | 3.126 | 2.96 | 0.66 | 23.58 | - | 23.62 0.12 | - | - |
| HDF-C24 | 3.328 | 2.39 | 0.76 | 24.33 | 24.16 0.38 | 23.91 0.09 | 24.39 2.00 | 23.64 0.15 |
| HDF-C25 | 2.973 | 2.18 | 0.39 | 24.88 | 23.84 0.14 | 23.89 0.13 | 23.70 0.26 | 23.30 0.16 |
| HDF-C26 | 3.239 | 2.70 | 1.09 | 24.25 | 23.00 0.09 | 22.30 0.08 | 22.06 0.14 | 22.06 0.14 |
| HDF-C27 | 2.940 | 2.42 | 0.60 | 24.57 | 22.95 0.09 | 22.83 0.13 | 22.92 0.12 | 22.39 0.13 |
| HDF-C28 | 3.130 | 2.68 | 1.09 | 23.50 | 20.64 0.05 | 21.00 0.04 | 21.38 0.09 | 21.39 0.11 |
| HDF-C5 | 2.664 | 2.23 | 0.42 | 24.88 | 23.10 0.13 | 23.32 0.16 | - | - |
| HDF-C6 | 3.451 | 2.74 | 0.55 | 24.34 | 24.09 0.38 | 23.98 0.09 | - | - |
| HDF-C7 | 2.658 | 2.46 | 0.62 | 24.57 | - | - | - | - |
| HDF-C8 | 2.988 | 2.35 | 0.70 | 24.38 | 23.37 0.12 | 23.39 0.16 | 23.53 0.26 | 23.35 0.16 |
| HDF-D10 | 2.970 | 1.76 | 0.04 | 25.39 | - | - | - | - |
| HDF-D11 | 2.930 | 1.42 | -0.09 | 25.33 | 24.37 0.57 | 24.40 0.34 | - | - |
| HDF-D12 | 2.856 | 1.83 | 0.32 | 24.84 | - | - | - | - |
| HDF-D13 | 3.087 | 2.49 | 0.70 | 23.98 | 22.19 0.09 | 22.37 0.08 | 22.47 0.14 | 22.43 0.13 |
| HDF-D14 | 2.962 | 2.32 | 0.07 | 25.09 | 24.32 0.57 | 24.07 0.23 | - | - |
| HDF-D15 | 3.131 | 2.65 | 0.62 | 23.61 | 23.29 0.12 | 23.27 0.16 | 23.22 0.17 | 23.13 0.16 |
| HDF-D2 | 2.806 | 2.07 | 0.18 | 24.49 | 23.59 0.11 | 23.62 0.12 | - | - |
| HDF-D3 | 2.943 | 2.18 | 0.58 | 24.25 | 22.90 0.09 | 22.87 0.13 | 22.93 0.12 | 22.92 0.15 |
| HDF-D6 | 2.925 | 2.00 | 0.14 | 25.40 | 24.65 0.49 | 24.67 0.47 | - | - |
| HDF-D7 | 2.394 | 2.11 | 0.34 | 24.55 | 22.30 0.10 | 22.25 0.08 | 22.34 0.14 | 22.21 0.13 |
| HDF-D8 | 2.410 | 2.21 | 0.26 | 25.04 | 23.93 0.14 | 24.02 0.32 | - | - |
| HDF-M16 | 2.939 | 2.26 | 0.77 | 24.55 | 23.71 0.14 | 23.29 0.16 | 23.14 0.17 | 23.42 0.29 |
| HDF-M17 | 2.932 | 2.03 | 1.00 | 24.46 | 22.11 0.09 | 22.00 0.10 | - | 21.77 0.13 |
| HDF-M18 | 2.929 | 2.37 | 1.00 | 24.10 | 21.91 0.09 | 21.76 0.07 | 21.68 0.09 | 21.39 0.11 |
| HDF-M21 | 2.926 | 2.16 | 0.84 | 24.49 | 22.59 0.10 | 22.43 0.08 | 22.45 0.14 | 22.12 0.14 |
| HDF-M22 | 3.196 | 1.89 | 0.78 | 25.08 | 23.86 0.14 | 23.80 0.13 | - | - |
| HDF-M23 | 3.214 | 2.43 | 1.09 | 24.61 | 21.01 0.09 | 21.16 0.07 | 21.08 0.07 | 21.10 0.07 |
| HDF-M25 | 3.106 | 2.12 | 0.74 | 24.82 | 23.61 0.11 | - | - | - |
| HDF-M27 | 3.242 | 2.19 | 0.94 | 24.53 | 23.35 0.12 | 23.35 0.16 | - | 23.05 0.22 |
| HDF-M28 | 3.371 | 1.78 | 0.70 | 25.04 | 24.47 0.57 | 24.67 0.47 | 25.31 0.50 | - |
| HDF-M32 | 3.363 | 1.99 | 0.76 | 24.95 | 23.83 0.14 | 23.67 0.12 | 23.91 0.48 | 23.53 0.29 |
| HDF-M35 | 3.229 | 2.20 | 1.17 | 23.98 | 22.57 0.10 | 22.43 0.08 | 22.28 0.14 | 22.14 0.14 |
| HDF-M7 | 2.990 | 2.13 | 0.67 | 24.79 | 23.63 0.11 | 23.79 0.13 | - | - |
| HDF-M9 | 2.975 | 2.15 | 0.78 | 24.73 | 22.55 0.10 | 22.36 0.08 | 22.33 0.14 | 21.76 0.13 |
| HDF-MD10 | 2.979 | 1.43 | 0.15 | 25.17 | 24.62 0.49 | 24.09 0.23 | - | - |
| HDF-MD18 | 2.442 | 1.17 | 0.03 | 24.98 | 24.28 0.38 | 24.21 0.23 | - | - |
| HDF-MD19 | 2.931 | 1.84 | 0.63 | 24.66 | 23.40 0.11 | 23.38 0.16 | 23.44 0.26 | 23.17 0.16 |
| HDF-MD22 | 3.194 | 1.79 | 0.67 | 24.53 | 24.19 0.38 | 24.13 0.23 | 24.23 1.32 | 23.99 0.24 |
| HDF-MD37 | 2.830 | 1.48 | 0.24 | 24.92 | 23.97 0.14 | 24.14 0.32 | - | 24.72 0.57 |
| HDF-MD3 | 2.898 | 1.82 | 0.71 | 23.86 | 20.77 0.06 | 21.25 0.07 | 21.56 0.09 | 21.94 0.10 |
| HDF-MD40 | 2.482 | 2.00 | 0.65 | 24.94 | 22.38 0.10 | 22.25 0.08 | 22.11 0.14 | 22.17 0.14 |
| HDF-MD45 | 2.345 | 1.83 | 0.69 | 23.55 | 21.04 0.09 | 22.78 0.11 | 21.32 0.09 | 21.19 0.07 |
| HDF-oC14 | 2.928 | 1.21 | 0.36 | 25.61 | - | - | - | - |
| HDF-oC26 | 3.182 | 1.66 | 0.40 | 25.63 | 25.49 0.14 | - | - | - |
| HDF-oC29 | 3.161 | 1.59 | 0.64 | 25.49 | 25.21 0.14 | 25.42 0.16 | - | - |
| HDF-oC37 | 2.926 | 1.36 | 0.40 | 25.25 | - | 24.37 0.48 | - | - |
| HDF-oC38 | 3.110 | 1.59 | 0.67 | 24.97 | 23.39 0.12 | 23.23 0.16 | 23.64 0.26 | 22.79 0.10 |
| HDF-oD12 | 2.418 | 0.77 | 0.31 | 24.84 | - | - | - | - |
| HDF-oD3 | 2.724 | 1.29 | 0.51 | 24.54 | 24.06 0.38 | 24.06 0.23 | - | - |
| HDF-oMD19 | 3.241 | 1.69 | 0.75 | 24.52 | 23.27 0.12 | 22.91 0.13 | 22.85 0.09 | 22.28 0.09 |
| HDF-oMD24 | 2.942 | 1.29 | 0.34 | 24.33 | 23.63 0.11 | 23.57 0.12 | 23.76 0.13 | - |
| HDF-oMD28 | 2.917 | 1.69 | 0.76 | 24.47 | 23.09 0.13 | 23.09 0.18 | 23.52 0.26 | 22.92 0.11 |
| HDF-oMD51 | 2.431 | 1.32 | 0.34 | 23.87 | 23.12 0.12 | 23.13 0.16 | 23.00 0.09 | 22.93 0.11 |
| HDF-oMD54 | 2.980 | 1.01 | 0.45 | 24.59 | 23.88 0.14 | 24.05 0.32 | 24.12 0.92 | 24.28 0.41 |
| Q1422-C101 | 2.873 | 3.79 | 0.85 | 24.17 | 21.89 0.09 | 21.70 0.09 | 21.91 0.13 | 21.88 0.10 |
| Q1422-C102 | 3.092 | 3.36 | 0.58 | 25.36 | - | - | - | - |
| Q1422-C106 | 3.032 | 3.09 | 0.73 | 25.30 | 23.45 0.25 | 23.78 0.18 | - | - |
| Q1422-C108 | 3.375 | 3.58 | 0.60 | 24.78 | - | - | - | - |
| Q1422-C110 | 3.072 | 3.79 | 0.86 | 24.27 | 22.64 0.10 | 22.61 0.09 | - | 22.72 0.50 |
| Q1422-C118 | 2.971 | 3.35 | 0.60 | 25.14 | 23.77 0.19 | 23.36 0.17 | - | - |
| Q1422-C121 | 3.748 | 2.86 | 1.03 | 25.50 | - | 24.19 0.24 | - | - |
| Q1422-C42 | 3.562 | 3.25 | 1.08 | 24.37 | 21.03 0.07 | 20.99 0.06 | 20.64 0.09 | 20.97 0.08 |
| Q1422-C52 | 3.072 | 3.40 | 0.91 | 24.61 | - | - | - | - |
| Q1422-C63 | 3.053 | 2.60 | 0.64 | 25.85 | - | 23.97 0.18 | - | - |
| Q1422-C70 | 3.126 | 2.72 | 0.92 | 25.45 | - | - | - | - |
| Q1422-C81 | 3.589 | 2.68 | 1.03 | 25.08 | 22.45 0.09 | 22.06 0.09 | - | - |
| Q1422-C92 | 3.009 | 2.46 | 0.91 | 25.47 | - | - | - | - |
| Q1422-C93 | 3.082 | 3.12 | 0.71 | 25.32 | 23.63 0.25 | 23.09 0.18 | 22.32 0.27 | 22.79 0.50 |
| Q1422-C99 | 3.064 | 2.84 | 0.93 | 25.14 | 23.61 0.25 | 23.69 0.16 | - | - |
| Q1422-D33 | 3.074 | 3.66 | 0.86 | 24.59 | - | 23.65 0.16 | - | - |
| Q1422-D42 | 3.135 | 2.69 | 0.62 | 25.32 | 23.14 0.39 | - | - | - |
| Q1422-D43 | 2.970 | 2.15 | 0.23 | 25.76 | 21.04 0.07 | 21.05 0.06 | - | 21.51 0.09 |
| Q1422-D45 | 3.074 | 2.49 | 0.31 | 24.11 | 22.97 0.10 | 23.33 0.17 | 21.43 0.12 | - |
| Q1422-D53 | 3.087 | 2.57 | 0.83 | 24.23 | 23.30 0.39 | 22.94 0.09 | - | 23.01 0.50 |
| Q1422-D54 | 2.938 | 2.04 | 0.52 | 25.95 | 23.11 0.39 | - | - | - |
| Q1422-D63 | 2.779 | 2.00 | 0.47 | 25.29 | - | - | - | - |
| Q1422-D68 | 3.290 | 2.56 | 0.39 | 24.72 | 23.51 0.25 | 23.30 0.17 | - | - |
| Q1422-D72 | 3.144 | 2.70 | 0.83 | 24.86 | - | - | - | - |
| Q1422-D76 | 2.939 | 3.66 | 0.38 | 24.56 | 23.67 0.25 | 23.24 0.17 | - | - |
| Q1422-D77 | 2.649 | 2.59 | 0.75 | 24.31 | 20.74 0.05 | 20.58 0.05 | 20.14 0.09 | 19.47 0.05 |
| Q1422-D78 | 3.104 | 3.40 | 0.95 | 23.77 | 21.51 0.08 | 21.71 0.09 | - | 21.01 0.09 |
| Q1422-D80 | 2.913 | 3.35 | 0.15 | 24.94 | 23.40 0.25 | 23.45 0.16 | - | - |
| Q1422-D81 | 3.103 | 3.53 | 0.51 | 23.41 | 21.56 0.08 | - | - | - |
| Q1422-D88 | 3.755 | 2.93 | 1.20 | 24.44 | 23.07 0.20 | - | - | - |
| Q1422-D91 | 2.921 | 2.34 | 0.44 | 23.67 | 22.48 0.09 | 22.57 0.09 | - | - |
| Q1422-D95 | 3.227 | 2.28 | 0.62 | 25.04 | 22.85 0.10 | 22.70 0.09 | - | - |
| Q1422-MD106 | 2.412 | 1.33 | 0.29 | 25.61 | - | - | - | - |
| Q1422-MD111 | 2.658 | 1.57 | 0.48 | 23.44 | 21.73 0.09 | 21.85 0.09 | 21.16 0.09 | 22.72 0.50 |
| Q1422-MD119 | 3.038 | 2.04 | 0.76 | 24.99 | 23.40 0.25 | - | - | - |
| Q1422-MD120 | 3.566 | 2.12 | 1.09 | 25.51 | - | - | - | - |
| Q1422-MD133 | 2.747 | 1.67 | 0.26 | 23.24 | 20.99 0.05 | 21.12 0.06 | 20.66 0.09 | 21.12 0.09 |
| Q1422-MD139 | 2.746 | 2.06 | 0.91 | 24.59 | - | - | - | - |
| Q1422-MD152 | 3.243 | 2.20 | 1.18 | 24.06 | 21.39 0.08 | 21.29 0.06 | 21.85 0.14 | 22.28 0.32 |
| Q1422-MD156 | 2.704 | 1.92 | 0.73 | 24.49 | 22.71 0.10 | 22.69 0.09 | - | 22.93 0.50 |
| Q1422-MD166 | 2.976 | 1.99 | 0.54 | 25.71 | - | - | - | - |
| Q1422-MD172 | 2.664 | 2.32 | 1.10 | 25.18 | - | - | - | - |
| Q1422-MD185 | 2.858 | 2.09 | 0.78 | 23.86 | 22.21 0.09 | 22.36 0.12 | - | - |
| Q1422-MD188 | 2.560 | 2.03 | 1.01 | 25.17 | 22.51 0.10 | 22.43 0.12 | - | 23.98 0.50 |
| Q1422-MD189 | 2.914 | 2.43 | 1.01 | 24.74 | - | 21.83 0.09 | - | 21.56 0.09 |
| Q1422-MD206 | 2.787 | 1.92 | 0.81 | 24.95 | - | - | - | - |
| Q1422-MD209 | 3.376 | 2.51 | 1.06 | 24.57 | - | - | - | - |
| Q1422-MD213 | 2.595 | 1.96 | 0.77 | 23.72 | - | - | - | - |
| Q1422-MD216 | 2.976 | 1.74 | 0.52 | 24.65 | 23.61 0.25 | - | - | 22.20 0.35 |
| Q1422-MD92 | 3.139 | 2.04 | 0.65 | 25.24 | - | 23.95 0.18 | - | - |
| Q1422-MD96 | 2.853 | 1.74 | 0.45 | 25.97 | - | - | - | - |
| Q1422-oC50 | 3.089 | 2.77 | 0.95 | 24.89 | 21.76 0.09 | 21.53 0.07 | 21.33 0.12 | 21.04 0.09 |
| Q2233-C10 | 3.002 | 2.31 | 0.62 | 24.88 | - | - | - | - |
| Q2233-C11 | 3.110 | 3.35 | 0.77 | 23.55 | 22.02 0.09 | 22.45 0.09 | - | - |
| Q2233-C12 | 3.109 | 2.53 | 0.92 | 24.39 | 22.96 0.09 | 22.90 0.10 | - | - |
| Q2233-C9 | 2.874 | 2.03 | 0.47 | 25.42 | 23.42 0.27 | - | - | - |
| Q2233-D4 | 2.595 | 1.77 | 0.12 | 25.22 | 22.62 0.09 | 22.31 0.09 | - | - |
| Q2233-D6 | 3.064 | 2.04 | 0.44 | 24.26 | 22.18 0.09 | 22.29 0.09 | - | - |
| Q2233-M10 | 3.057 | 2.42 | 1.17 | 24.16 | 22.38 0.09 | 22.16 0.12 | - | 21.48 0.08 |
| Q2233-M16 | 3.220 | 1.94 | 0.73 | 25.27 | - | - | - | - |
| Q2233-M17 | 2.733 | 2.40 | 1.06 | 24.15 | 22.53 0.09 | 22.71 0.08 | - | - |
| Q2233-M23 | 3.109 | 2.18 | 1.01 | 24.66 | 24.02 0.46 | - | - | - |
| Q2233-MD34 | 2.169 | 1.32 | 0.26 | 25.05 | 22.82 0.09 | 23.00 0.20 | - | - |
| Q2233-MD39 | 3.041 | 2.23 | 0.78 | 23.42 | 22.52 0.09 | 22.59 0.08 | - | - |
| Q2233-MD41 | 2.545 | 1.56 | 0.52 | 24.56 | 22.13 0.09 | 22.53 0.08 | 23.03 0.50 | 21.03 0.09 |
| Q2233-MD44 | 2.357 | 1.44 | 0.42 | 25.43 | 24.01 0.46 | 24.01 0.32 | - | - |
| Q2233-MD46 | 2.713 | 1.90 | 0.88 | 23.81 | 23.41 0.27 | - | - | - |
| Q2233-MD47 | 3.105 | 2.16 | 0.82 | 25.25 | - | 23.20 0.25 | - | - |
| Q2233-MD52 | 2.837 | 2.14 | 1.07 | 23.20 | 22.57 0.09 | 22.89 0.10 | - | - |
| SSA22a-aug96C19 | 2.470 | 1.11 | 0.18 | 24.42 | 22.79 0.09 | 22.69 0.09 | - | - |
| SSA22a-aug96C20 | 1.357 | 0.71 | 0.22 | 25.31 | 23.43 0.26 | 23.27 0.16 | - | - |
| SSA22a-aug96C22 | 2.129 | 0.67 | 0.23 | 24.41 | 21.83 0.08 | 21.74 0.09 | 21.71 0.08 | 21.68 0.07 |
| SSA22a-aug96C3 | 1.674 | 1.24 | 0.34 | 24.25 | 22.74 0.09 | 23.10 0.18 | - | - |
| SSA22a-aug96D11 | 0.345 | 0.55 | 0.82 | 22.79 | 22.84 0.10 | 23.03 0.18 | - | - |
| SSA22a-aug96M16 | 3.292 | 1.36 | 0.70 | 23.83 | 23.56 0.26 | 23.66 0.19 | - | - |
| SSA22a-aug96MD40 | 2.175 | 0.60 | 0.05 | 24.31 | 23.34 0.17 | 23.45 0.19 | - | - |
| SSA22a-C10 | 2.929 | 2.21 | 0.42 | 25.08 | 23.47 0.26 | 23.84 0.20 | - | - |
| SSA22a-C11 | 3.104 | 2.95 | 0.47 | 24.20 | 23.10 0.17 | 23.07 0.18 | - | - |
| SSA22a-C12 | 3.112 | 2.90 | 0.44 | 24.37 | - | - | - | - |
| SSA22a-C15 | 3.094 | 2.11 | 0.55 | 25.19 | - | - | - | - |
| SSA22a-C16 | 3.065 | 2.88 | 0.98 | 23.64 | 21.98 0.09 | 21.82 0.09 | - | 21.26 0.09 |
| SSA22a-C22 | 2.882 | 2.72 | 0.54 | 24.46 | 23.66 0.26 | 23.41 0.19 | - | - |
| SSA22a-C24 | 3.096 | 2.77 | 0.78 | 23.86 | 22.97 0.10 | 22.61 0.09 | - | - |
| SSA22a-C26 | 3.178 | 2.02 | 0.34 | 25.12 | 24.17 0.41 | - | - | - |
| SSA22a-C27 | 3.084 | 2.45 | 0.67 | 25.08 | 23.38 0.17 | 23.32 0.16 | - | - |
| SSA22a-C28 | 3.076 | 2.52 | 0.50 | 25.08 | - | - | - | - |
| SSA22a-C30 | 3.101 | 2.53 | 0.82 | 24.22 | 22.47 0.10 | 22.27 0.09 | - | - |
| SSA22a-C31 | 3.021 | 3.30 | -0.11 | 24.61 | - | - | - | - |
| SSA22a-C32 | 3.296 | 3.19 | 0.67 | 23.68 | 23.34 0.17 | 23.34 0.16 | - | - |
| SSA22a-C35 | 3.101 | 2.52 | 0.95 | 24.18 | 23.16 0.17 | 23.08 0.18 | - | - |
| SSA22a-C36 | 3.063 | 2.86 | 0.78 | 24.06 | 22.89 0.10 | 22.75 0.09 | - | - |
| SSA22a-C37 | 0.452 | 3.03 | 0.45 | 24.12 | 21.35 0.07 | 21.20 0.07 | 21.48 0.09 | 21.19 0.09 |
| SSA22a-C39 | 3.076 | 2.39 | 0.40 | 24.90 | 24.17 0.41 | 23.87 0.20 | - | - |
| SSA22a-C40 | 2.922 | 2.50 | 0.37 | 25.08 | 24.64 0.24 | 24.23 0.34 | - | - |
| SSA22a-C41 | 3.022 | 3.49 | 0.18 | 23.80 | 23.32 0.17 | 22.97 0.09 | - | - |
| SSA22a-C42 | 2.925 | 2.69 | 0.30 | 25.10 | - | 24.26 0.34 | - | - |
| SSA22a-C44 | 2.823 | 2.41 | 0.61 | 24.66 | - | - | - | - |
| SSA22a-C45 | 2.826 | 2.36 | 0.49 | 24.76 | 24.30 0.41 | 23.77 0.20 | - | - |
| SSA22a-C46 | 2.927 | 2.62 | 0.30 | 24.82 | 23.75 0.20 | - | - | - |
| SSA22a-C48 | 3.085 | 2.56 | 0.31 | 24.71 | - | 24.14 0.34 | - | - |
| SSA22a-C4 | 3.076 | 2.54 | 0.42 | 24.53 | 23.88 0.20 | - | - | - |
| SSA22a-C50 | 3.086 | 2.21 | 0.58 | 25.19 | 23.41 0.26 | 23.30 0.16 | - | - |
| SSA22a-C6 | 3.095 | 2.97 | 0.79 | 23.44 | 23.05 0.19 | 23.10 0.16 | - | - |
| SSA22a-D14 | 3.019 | 2.29 | 0.19 | 24.32 | 23.76 0.20 | 23.72 0.20 | - | - |
| SSA22a-D15 | 2.716 | 2.37 | 0.31 | 25.05 | - | - | - | - |
| SSA22a-D17 | 3.089 | 2.01 | 0.45 | 24.27 | 23.47 0.26 | 23.50 0.19 | - | - |
| SSA22a-D3 | 3.082 | 2.58 | 0.97 | 23.37 | 22.36 0.10 | 22.44 0.09 | - | - |
| SSA22a-D4 | 2.770 | 1.72 | -0.02 | 24.85 | - | - | - | - |
| SSA22a-D7 | 2.759 | 2.14 | 0.62 | 23.50 | 22.44 0.10 | 22.30 0.09 | - | - |
| SSA22a-M10 | 3.099 | 2.20 | 1.03 | 24.45 | 23.71 0.20 | 23.74 0.20 | - | - |
| SSA22a-M14 | 3.091 | 1.85 | 0.75 | 25.47 | 22.12 0.09 | 21.75 0.09 | 21.82 0.08 | 20.90 0.08 |
| SSA22a-M28 | 3.091 | 2.07 | 0.82 | 24.74 | 23.06 0.19 | 22.98 0.09 | - | - |
| SSA22a-M38 | 3.288 | 2.15 | 1.15 | 24.11 | 22.47 0.10 | 22.23 0.09 | 22.04 0.20 | - |
| SSA22a-M4 | 3.093 | 2.22 | 0.76 | 24.83 | - | 23.53 0.19 | - | - |
| SSA22a-MD14 | 3.094 | 2.25 | 0.86 | 24.14 | 23.09 0.19 | 23.30 0.16 | - | - |
| SSA22a-MD17 | 2.163 | 1.56 | 0.23 | 24.82 | 22.44 0.10 | 22.24 0.09 | - | - |
| SSA22a-MD19 | 2.408 | 1.57 | 0.38 | 24.62 | 22.32 0.10 | 22.26 0.09 | 21.86 0.08 | - |
| SSA22a-MD20 | 3.050 | 1.58 | 0.50 | 25.28 | - | - | - | - |
| SSA22a-MD23 | 3.087 | 1.92 | 0.46 | 24.14 | - | - | - | - |
| SSA22a-MD2 | 2.482 | 1.64 | 0.58 | 24.66 | 23.84 0.20 | 23.80 0.20 | - | - |
| SSA22a-MD32 | 3.102 | 1.45 | 0.37 | 25.41 | 24.43 0.18 | 24.00 0.20 | - | - |
| SSA22a-MD36 | 2.742 | 1.94 | 0.64 | 24.76 | 23.32 0.17 | 23.09 0.18 | - | - |
| SSA22a-MD37 | 3.026 | 1.76 | 0.73 | 24.73 | 23.61 0.26 | 23.51 0.19 | - | - |
| SSA22a-MD3 | 2.488 | 1.30 | 0.15 | 24.60 | - | - | - | - |
| SSA22a-MD40 | 3.022 | 1.78 | 0.70 | 24.89 | 23.41 0.26 | 23.70 0.20 | - | - |
| SSA22a-MD41 | 2.173 | 1.31 | 0.19 | 23.31 | 22.00 0.09 | 21.89 0.09 | 22.07 0.20 | 23.45 0.50 |
| SSA22a-MD44 | 2.712 | 1.52 | 0.42 | 25.50 | - | - | - | - |
| SSA22a-MD46 | 3.086 | 1.62 | 0.42 | 23.30 | 22.95 0.10 | 22.99 0.09 | - | - |
| SSA22a-MD4 | 2.613 | 1.51 | 0.24 | 24.25 | 23.30 0.17 | 23.05 0.18 | - | - |
| SSA22a-MD55 | 2.673 | 2.03 | 0.85 | 24.36 | 22.60 0.09 | - | 21.58 0.09 | - |
| SSA22a-MD58 | 2.857 | 1.62 | 0.41 | 25.26 | 20.93 0.06 | 20.75 0.07 | 20.49 0.09 | 21.14 0.09 |
| SSA22a-MD6 | 2.582 | 1.91 | 0.89 | 24.07 | - | - | - | - |
| SSA22a-oct96C1 | 2.812 | 1.26 | 0.31 | 25.32 | - | - | - | - |
| SSA22a-oct96D6 | 2.852 | 1.93 | 0.04 | 25.56 | - | - | - | - |
| SSA22a-oct96MD37 | 2.165 | 0.97 | -0.01 | 24.20 | 22.83 0.10 | 22.88 0.09 | - | - |
| SSA22b-C10 | 3.357 | 2.62 | 0.93 | 24.11 | 24.00 0.20 | - | - | - |
| SSA22b-C12 | 3.289 | 2.59 | 0.65 | 24.94 | - | - | - | - |
| SSA22b-C16 | 2.960 | 2.19 | 0.56 | 25.38 | - | - | - | - |
| SSA22b-C18 | 2.684 | 2.05 | 0.51 | 24.87 | 23.69 0.26 | 23.75 0.20 | - | - |
| SSA22b-C20 | 3.197 | 2.94 | 0.68 | 24.60 | 23.16 0.17 | 22.58 0.09 | - | - |
| SSA22b-D10 | 2.766 | 2.46 | 0.63 | 24.32 | 23.30 0.17 | 23.25 0.16 | - | - |
| SSA22b-D12 | 3.055 | 2.11 | 0.47 | 25.06 | 24.73 0.24 | - | - | - |
| SSA22b-D13 | 2.627 | 2.56 | 0.62 | 23.94 | 22.94 0.10 | 23.34 0.16 | - | - |
| SSA22b-D14 | 2.866 | 2.01 | 0.41 | 24.90 | - | 24.34 0.45 | - | - |
| SSA22b-D15 | 2.864 | 2.08 | 0.56 | 24.65 | - | - | - | - |
| SSA22b-D5 | 3.180 | 2.18 | 0.66 | 24.42 | 23.70 0.26 | - | - | - |
| SSA22b-M16 | 2.956 | 2.06 | 0.79 | 25.03 | 23.32 0.17 | 23.21 0.16 | - | - |
| SSA22b-M19 | 3.025 | 2.26 | 0.79 | 24.99 | - | 23.36 0.16 | - | - |
| SSA22b-MD27 | 2.784 | 1.94 | 0.55 | 25.18 | - | - | 20.57 0.09 | - |
| SSA22b-MD32 | 2.949 | 1.39 | 0.13 | 24.72 | - | - | - | - |
| SSA22b-MD38 | 2.861 | 1.89 | 0.52 | 24.02 | 23.66 0.26 | 23.77 0.20 | - | - |
| SSA22b-oC16 | 2.656 | 1.45 | 0.69 | 24.83 | 22.89 0.10 | 22.83 0.09 | - | 21.55 0.08 |
| SSA22b-oC22 | 2.962 | 1.28 | 0.56 | 24.79 | 24.08 0.41 | 24.27 0.34 | - | - |
| SSA22b-oC27 | 3.370 | 1.33 | 0.60 | 24.50 | 22.34 0.10 | 22.87 0.09 | 22.84 0.61 | 23.57 0.50 |
| SSA22b-oD22 | 2.567 | 1.37 | 0.41 | 23.98 | 22.96 0.10 | 22.75 0.09 | - | - |
| SSA22b-oD24 | 2.450 | 1.09 | 0.37 | 24.51 | - | - | - | - |
| SSA22b-oMD58 | 2.555 | 0.91 | 0.14 | 25.18 | 24.06 0.41 | 23.74 0.20 | - | - |
| SSA22b-oMD68 | 2.296 | 0.80 | 0.11 | 24.59 | 22.88 0.10 | - | - | - |
| M∗ | Age | ||
|---|---|---|---|
| NameaaWe did not fit the stellar populations of galaxies that had no data longward of R-band, had uncertain redshifts, or are identified as AGN/QSO from their optical spectra. We also do not present SED parameters for those galaxies with optical and IRAC photometry inconsistent with a simple stellar population (these sources had large | ( M⊙) | (Myr) | E(B-V) |
| B20902-C10 | 10.394 0.115 | 101 | 1.566 |
| B20902-C11 | 10.384 0.086 | 9 | 0.589 |
| B20902-C5 | 10.943 0.078 | 1250 | 0.005 |
| B20902-C7 | 9.529 0.143 | 30 | 0.202 |
| B20902-C9 | 10.641 0.161 | 404 | 0.478 |
| B20902-D11 | 11.175 0.090 | 1434 | 0.138 |
| B20902-D14 | 10.709 0.136 | 71 | 1.566 |
| B20902-D8 | 10.526 0.101 | 1434 | 0.013 |
| B20902-M11 | 10.721 0.078 | 625 | 0.159 |
| B20902-MD16 | 10.549 0.114 | 508 | 0.689 |
| B20902-MD21 | 10.938 0.016 | 904 | 0.125 |
| B20902-MD25 | 10.853 0.077 | 806 | 0.052 |
| B20902-MD28 | 10.946 0.129 | 1015 | 0.138 |
| C23-Q1700 | 10.300 0.091 | 19 | 0.664 |
| C26-Q1700 | 10.635 0.091 | 255 | 0.677 |
| C7-Q1700 | 10.797 0.185 | 2000 | 0.337 |
| C9-Q1700 | 10.813 0.182 | 904 | 0.401 |
| D17-Q1700 | 11.034 0.056 | 2000 | 0.000 |
| D20-Q1700 | 11.008 0.060 | 404 | 0.098 |
| D23-Q1700 | 10.431 0.178 | 404 | 0.374 |
| D25-Q1700 | 10.615 0.113 | 508 | 0.013 |
| DSF2237b-D19 | 10.792 0.077 | 1015 | 0.000 |
| DSF2237b-D28 | 10.340 0.193 | 640 | 0.025 |
| DSF2237b-MD72 | 10.312 0.109 | 180 | 0.038 |
| DSF2237b-MD81 | 11.545 0.109 | 2000 | 0.213 |
| HDF-C14 | 11.017 0.182 | 1434 | 0.163 |
| HDF-C17 | 10.482 0.107 | 255 | 0.086 |
| HDF-C22 | 9.996 0.077 | 19 | 0.439 |
| HDF-C24 | 9.909 0.176 | 10 | 0.501 |
| HDF-C25 | 10.211 0.193 | 404 | 0.202 |
| HDF-C26 | 10.900 0.056 | 255 | 0.000 |
| HDF-C27 | 10.423 0.098 | 508 | 0.288 |
| HDF-C28 | 11.480 0.078 | 1000 | 0.265 |
| HDF-C5 | 10.158 0.090 | 101 | 0.938 |
| HDF-C6 | 9.834 0.077 | 19 | 0.439 |
| HDF-C8 | 9.676 0.101 | 10 | 0.353 |
| HDF-D11 | 9.748 0.185 | 50 | 0.077 |
| HDF-D13 | 10.881 0.149 | 640 | 0.276 |
| HDF-D14 | 10.119 0.073 | 180 | 0.138 |
| HDF-D15 | 10.271 0.168 | 180 | 0.163 |
| HDF-D2 | 9.701 0.034 | 19 | 0.551 |
| HDF-D3 | 10.487 0.196 | 1434 | 0.013 |
| HDF-D6 | 9.334 0.193 | 640 | 0.000 |
| HDF-D7 | 10.469 0.061 | 255 | 0.215 |
| HDF-D8 | 9.686 0.101 | 80 | 0.202 |
| HDF-M16 | 10.340 0.191 | 180 | 0.388 |
| HDF-M17 | 11.128 0.094 | 2000 | 0.195 |
| HDF-M18 | 11.163 0.067 | 1434 | 0.362 |
| HDF-M21 | 10.857 0.096 | 1015 | 0.276 |
| HDF-M22 | 10.390 0.007 | 180 | 0.013 |
| HDF-M23 | 11.460 0.078 | 2000 | 0.259 |
| HDF-M25 | 10.451 0.196 | 180 | 0.025 |
| HDF-M27 | 10.526 0.096 | 10 | 0.777 |
| HDF-M28 | 9.354 0.098 | 6 | 0.576 |
| HDF-M32 | 10.500 0.109 | 180 | 0.000 |
| HDF-M35 | 10.818 0.067 | 255 | 0.236 |
| HDF-M7 | 10.302 0.094 | 10 | 0.739 |
| HDF-M9 | 10.840 0.097 | 404 | 0.125 |
| HDF-MD10 | 9.887 0.101 | 180 | 0.086 |
| HDF-MD18 | 9.454 0.143 | 101 | 0.150 |
| HDF-MD19 | 10.396 0.103 | 806 | 0.098 |
| HDF-MD22 | 9.893 0.049 | 10 | 0.465 |
| HDF-MD37 | 10.026 0.189 | 255 | 0.215 |
| HDF-MD3 | 9.887 0.078 | 360 | 0.000 |
| HDF-MD40 | 10.538 0.139 | 806 | 1.253 |
| HDF-oC26 | 8.992 0.082 | 180 | 0.052 |
| HDF-oC29 | 9.113 0.091 | 9 | 0.465 |
| HDF-oC37 | 9.333 0.193 | 806 | 0.000 |
| HDF-oC38 | 10.511 0.141 | 404 | 0.013 |
| HDF-oD3 | 9.754 0.099 | 90 | 0.276 |
| HDF-oMD19 | 10.797 0.168 | 1800 | 0.077 |
| HDF-oMD24 | 10.109 0.101 | 404 | 0.000 |
| HDF-oMD28 | 10.533 0.191 | 1278 | 0.077 |
| HDF-oMD51 | 9.884 0.129 | 180 | 0.190 |
| HDF-oMD54 | 9.693 0.073 | 255 | 0.000 |
| Q1422-C101 | 11.007 0.159 | 604 | 0.865 |
| Q1422-C106 | 10.433 0.193 | 640 | 0.478 |
| Q1422-C110 | 10.813 0.014 | 404 | 0.664 |
| Q1422-C118 | 10.340 0.075 | 180 | 0.637 |
| Q1422-C121 | 9.857 0.054 | 10 | 0.714 |
| Q1422-C42 | 11.925 0.098 | 1015 | 0.487 |
| Q1422-C63 | 10.211 0.084 | 2000 | 0.251 |
| Q1422-C81 | 11.289 0.155 | 1278 | 0.301 |
| Q1422-C93 | 10.755 0.189 | 1434 | 0.465 |
| Q1422-C99 | 10.340 0.193 | 640 | 0.426 |
| Q1422-D33 | 10.037 0.094 | 101 | 0.499 |
| Q1422-D42 | 10.566 0.116 | 1015 | 0.202 |
| Q1422-D45 | 10.943 0.078 | 2000 | 0.050 |
| Q1422-D53 | 10.362 0.098 | 180 | 0.000 |
| Q1422-D54 | 10.777 0.107 | 1434 | 0.038 |
| Q1422-D68 | 10.618 0.103 | 806 | 0.138 |
| Q1422-D76 | 9.873 0.195 | 19 | 0.702 |
| Q1422-D77 | 11.751 0.078 | 2000 | 0.874 |
| Q1422-D78 | 11.398 0.058 | 1278 | 0.465 |
| Q1422-D80 | 9.989 0.076 | 71 | 0.677 |
| Q1422-D81 | 11.304 0.099 | 1278 | 0.362 |
| Q1422-D88 | 11.037 0.133 | 508 | 0.301 |
| Q1422-D91 | 10.681 0.065 | 404 | 0.263 |
| Q1422-D95 | 10.825 0.074 | 1015 | 0.113 |
| Q1422-MD111 | 10.998 0.109 | 1434 | 0.276 |
| Q1422-MD119 | 10.706 0.074 | 1015 | 0.086 |
| Q1422-MD133 | 11.321 0.056 | 1015 | 0.413 |
| Q1422-MD152 | 11.379 0.060 | 1015 | 0.175 |
| Q1422-MD156 | 10.521 0.133 | 404 | 0.677 |
| Q1422-MD185 | 10.918 0.161 | 806 | 0.413 |
| Q1422-MD188 | 10.543 0.135 | 255 | 0.689 |
| Q1422-MD189 | 11.226 0.109 | 2000 | 0.224 |
| Q1422-MD216 | 10.575 0.101 | 1278 | 0.077 |
| Q1422-MD92 | 10.211 0.168 | 1800 | 0.013 |
| Q1422-oC50 | 10.957 0.143 | 1434 | 0.238 |
| Q2233-C11 | 10.703 0.092 | 19 | 0.877 |
| Q2233-C12 | 10.806 0.113 | 508 | 0.313 |
| Q2233-C9 | 10.698 0.032 | 904 | 0.426 |
| Q2233-D4 | 10.764 0.189 | 1800 | 0.702 |
| Q2233-D6 | 11.093 0.143 | 1015 | 0.052 |
| Q2233-M10 | 11.176 0.098 | 1434 | 0.374 |
| Q2233-M17 | 10.643 0.098 | 90 | 0.840 |
| Q2233-M23 | 10.300 0.043 | 9 | 0.702 |
| Q2233-MD34 | 10.088 0.109 | 255 | 0.086 |
| Q2233-MD39 | 10.721 0.191 | 640 | 0.113 |
| Q2233-MD41 | 10.965 0.078 | 1500 | 0.455 |
| Q2233-MD44 | 9.803 0.101 | 71 | 0.827 |
| Q2233-MD46 | 10.239 0.117 | 9 | 0.763 |
| Q2233-MD47 | 10.530 0.084 | 404 | 0.013 |
| Q2233-MD52 | 10.404 0.085 | 101 | 0.376 |
| SSA22a-aug96C19 | 10.396 0.172 | 508 | 0.512 |
| SSA22a-aug96C20 | 10.512 0.058 | 19 | 1.878 |
| SSA22a-aug96C22 | 9.889 0.058 | 19 | 1.878 |
| SSA22a-aug96C3 | 9.978 0.116 | 90 | 1.566 |
| SSA22a-aug96D11 | 10.204 0.069 | 180 | 0.689 |
| SSA22a-aug96M16 | 10.232 0.102 | 101 | 0.052 |
| SSA22a-aug96MD40 | 10.119 0.191 | 640 | 0.038 |
| SSA22a-C10 | 10.238 0.092 | 255 | 0.025 |
| SSA22a-C11 | 10.480 0.105 | 180 | 0.276 |
| SSA22a-C16 | 11.274 0.174 | 1434 | 0.426 |
| SSA22a-C22 | 10.157 0.005 | 64 | 0.628 |
| SSA22a-C24 | 10.651 0.075 | 255 | 0.388 |
| SSA22a-C26 | 9.923 0.049 | 255 | 0.013 |
| SSA22a-C27 | 10.575 0.101 | 1015 | 0.328 |
| SSA22a-C30 | 11.024 0.077 | 806 | 0.288 |
| SSA22a-C32 | 10.168 0.084 | 40 | 0.098 |
| SSA22a-C35 | 10.570 0.105 | 180 | 0.301 |
| SSA22a-C36 | 10.682 0.071 | 180 | 0.362 |
| SSA22a-C37 | 11.480 0.078 | 1000 | 3.496 |
| SSA22a-C39 | 10.211 0.193 | 255 | 0.224 |
| SSA22a-C40 | 9.759 0.094 | 19 | 0.589 |
| SSA22a-C41 | 10.047 0.101 | 30 | 0.301 |
| SSA22a-C42 | 10.118 0.094 | 19 | 0.526 |
| SSA22a-C45 | 9.531 0.098 | 30 | 0.702 |
| SSA22a-C46 | 10.384 0.191 | 180 | 0.163 |
| SSA22a-C48 | 10.076 0.089 | 101 | 0.150 |
| SSA22a-C4 | 10.129 0.066 | 80 | 0.215 |
| SSA22a-C50 | 10.555 0.143 | 404 | 0.013 |
| SSA22a-C6 | 10.126 0.049 | 30 | 0.263 |
| SSA22a-D14 | 10.109 0.193 | 404 | 0.025 |
| SSA22a-D17 | 10.340 0.193 | 640 | 0.013 |
| SSA22a-D3 | 10.883 0.069 | 508 | 0.215 |
| SSA22a-D7 | 10.510 0.123 | 64 | 0.877 |
| SSA22a-M10 | 9.784 0.096 | 9 | 0.639 |
| SSA22a-M14 | 11.281 0.243 | 1800 | 0.061 |
| SSA22a-M28 | 10.664 0.101 | 1434 | 0.224 |
| SSA22a-M38 | 11.097 0.069 | 1015 | 0.313 |
| SSA22a-M4 | 10.442 0.193 | 640 | 0.263 |
| SSA22a-MD14 | 10.526 0.101 | 1015 | 0.077 |
| SSA22a-MD17 | 10.192 0.135 | 255 | 0.301 |
| SSA22a-MD19 | 10.445 0.060 | 255 | 0.752 |
| SSA22a-MD2 | 9.679 0.107 | 50 | 0.439 |
| SSA22a-MD32 | 10.119 0.189 | 1278 | 0.000 |
| SSA22a-MD36 | 10.252 0.084 | 180 | 0.689 |
| SSA22a-MD37 | 10.442 0.191 | 640 | 0.138 |
| SSA22a-MD40 | 10.427 0.196 | 255 | 0.013 |
| SSA22a-MD41 | 10.348 0.172 | 255 | 0.138 |
| SSA22a-MD46 | 10.350 0.067 | 255 | 0.000 |
| SSA22a-MD4 | 10.321 0.161 | 180 | 0.163 |
| SSA22a-MD55 | 10.919 0.041 | 30 | 1.878 |
| SSA22a-MD58 | 11.140 0.988 | 3000 | 0.175 |
| SSA22a-oct96MD37 | 9.990 0.109 | 180 | 0.000 |
| SSA22b-C10 | 9.926 0.147 | 50 | 0.362 |
| SSA22b-C18 | 10.058 0.166 | 50 | 0.788 |
| SSA22b-C20 | 10.859 0.077 | 806 | 0.328 |
| SSA22b-D10 | 10.264 0.036 | 101 | 0.650 |
| SSA22b-D12 | 9.748 0.102 | 10 | 0.413 |
| SSA22b-D13 | 10.240 0.025 | 101 | 0.564 |
| SSA22b-D14 | 9.863 0.094 | 90 | 0.263 |
| SSA22b-D5 | 10.340 0.191 | 640 | 0.098 |
| SSA22b-M16 | 10.533 0.101 | 1015 | 0.276 |
| SSA22b-M19 | 10.575 0.103 | 904 | 0.313 |
| SSA22b-MD38 | 9.753 0.065 | 71 | 0.288 |
| SSA22b-oC16 | 10.797 0.078 | 2000 | 0.243 |
| SSA22b-oC22 | 9.887 0.101 | 180 | 0.098 |
| SSA22b-oC27 | 10.841 0.097 | 904 | 0.025 |
| SSA22b-oD22 | 10.212 0.111 | 40 | 0.865 |
| SSA22b-oMD58 | 9.767 0.021 | 255 | 0.077 |
| SSA22b-oMD68 | 10.396 0.189 | 1434 | 0.175 |