The effect of dust geometry on the Ly output of galaxies
Abstract
We present the optical spectroscopic follow-up of 31 Ly emitters, previously identified by Deharveng et al. (2008). We find that % of the Ly emitters have line ratios that require the hard ionizing continuum produced by an AGN. The uniform dust screen geometry traditionally used in studies similar to ours is not able to simultaneously reproduce the observed high Ly/H and H/H line ratios. We consider different possibilities for the geometry of the dust around the emitting sources. We find that also a uniform mixture of sources and dust does not reproduce the observed line ratios. Instead, these are well reproduced by a clumpy dust screen. This more realistic treatment of the geometry results in extinction corrected (Ly/H)C values consistent with Case B recombination theory, whereas a uniform dust screen model would imply values (Ly/H)C higher than 8.7. Our analysis shows that there is no need to invoke “ad-hoc” multi phase media in which the Ly photons only scatter between the dusty clouds and eventually escape.
Subject headings:
galaxies: ISM — ISM: structure1. Introduction
In the pre-JWST (James Webb Space Telescope) era we depend strongly on the observation of Ly emission for both spectroscopic confirmation and, often, the actual discovery of very high-redshift () galaxies. Furthermore, the evolution with redshift of the clustering properties and luminosity function of Ly emitters could be used to infer important information about the re-ionization epoch, if the physics governing the Ly escape were well understood. In the local universe, where the physical properties of galaxies can in principle be determined in great detail, the number of known Ly emitting galaxies is extremely small (on the order of a dozen objects, e.g., Giavalisco et al., 1996; Ostlin et al., 2008).
Numerous theoretical works demonstrate how the observed Ly emission and its equivalent width (EW) depend on different factors including not only the age of the stellar population, the stellar initial mass function, the metal and dust content (Charlot & Fall, 1993), but also the relative geometries of interstellar H I and H II regions and the kinematics of the neutral gas (e.g., Panagia & Ranieri, 1973a, b; Neufeld, 1990; Verhamme et al., 2006; Dijkstra et al., 2006; Laursen & Sommer-Larsen, 2007). All of these studies point to a preferential attenuation at resonant frequencies, although it is likely that the homogeneous interstellar medium (ISM) model is a great over-simplification. In contrast to the homogeneous case, a multiphase ISM in which the dust lies in cold neutral clouds (which Ly photons cannot penetrate), would actually serve to preserve Ly photons, leading to a relative enhancement of the Ly EW and the Ly / Balmer line ratios (e.g. Neufeld, 1991; Hansen et al., 2006). This latter mechanism has been proposed to explain the high Ly EW sources observed at high redshift (Finkelstein et al., 2008) and the high Ly/H ratio inferred for low- dusty Ly emitters (Atek et al., 2008, 2009).
Recently Deharveng et al. (2008) presented the results from a slitless spectroscopic survey tuned to identify low- Ly emitters with the Galaxy Evolution Explorer (GALEX) satellite. The survey covered 5.6 deg2 and identified 96 Ly emitters with redshifts in the range . All galaxies have measured Ly EW and line intensities. The EW distribution of the Ly emitters is similar to that at , but their fraction among star-forming galaxies is smaller.
We are conducting a program of spectroscopic followup of the GALEX Ly emitters. In this letter we present the comparison of the Ly/H and H/H ratios for the galaxies observed so far.
2. Observations and data analysis
Optical spectra of 31 of the Deharveng et al. galaxies were acquired with the the Double-Beam Spectrograph (DBSP, Oke & Gunn, 1982) mounted on the Hale 5m telescope at Palomar Observatory. The objects were selected to be visible from the Palomar Observatory (in the following fields GROTH, NGPDWS, and SIRTFFL from Deharveng et al. 2008), and to have so that H would fall in the covered spectral range. The sample is presented in Table 1 available in the electronic version of the paper. We used the D55 dichroic to split the light at Å into a blue and a red channel. The red spectra were acquired with the 600 lines mm-1 grating, and cover the wavelength range between 5800Å and 8500Å. The blue spectra and a detailed description of the data will be presented in a forthcoming paper (Scarlata et al., in preparation). Six objects have redshifted H (H) lines outside the observed spectral range. The exposure times rangedbetween s and s. During the observations seeing ranged from 1 to 15. The galaxies were observed using a 15 wide slit, providing a spectral resolution of 8Å (i.e., 280 km s-1 at ). This resolution is high enough to resolve the H from [N II] emission lines. To check for slit loss, we also observed 8 galaxies with the 50 wide slit.
Bias subtraction, flat-field normalization, wavelength calibration, and extraction of the 1D spectra were performed with standard IRAF packages. The wavelength-dependent instrumental response was removed by normalizing each spectrum with the response curve derived from the spectrum of a standard star observed in one of our photometric nights. The final flux calibration was performed using the total –band magnitude of each galaxy available from the Sloan Digital Sky Survey (SDSS, York et al., 2000). We convolved each spectrum with the filter transmission curve111The 900Å width of the filter is fully contained within the observed red spectra. and compare the resulting flux with the total SDSS flux. With this approach the calibrated spectra are simultaneously corrected for slit losses, due to the 15 size of the slit222The median half–light radius of the sample galaxies is 09.. Although valid for the stellar component (i.e., the continuum) of the galaxies, if the gas is more concentrated than the stars this correction might introduce a systematic overestimate of the emission line intensities (without affecting the line ratios). In order to check this effect, we computed , i.e. the ratio between the H fluxes measured from the 15 and the 50 slit, for those galaxies for which the two spectra were available. On average, the line intensities agree to within 25%. This potential source of error would affect the ratio between our measured optical line intensities and that of Ly, in the direction of systematically underestimating the Ly/H ratio. One source has a Ly/H/ ratio . Even for this object a 25% error on the H would not result in a Ly/H ratio greater than the case B value.
We measured line intensities and EWs by fitting a Gaussian to the emission lines, and checked the results using the IRAF package SPLOT. All Balmer emission line intensities were corrected for stellar absorption, fitting the continuum of each spectrum between 2600 and 6600Å rest–frame with synthetic templates from the Bruzual & Charlot library (Bruzual & Charlot, 1993, 2003). Templates with constant star formation history, different age and metallicity were employed. The median value of the stellar absorption rest frame EW for H and H in our galaxies are, respectively, 3.38Å and 4.18Å. For an EW of 20Å, these values correspond to a flux correction of about 21% and 27% in H and H, respectively. We also applied a Ly stellar absorption correction of 10Å EW to all galaxies with a best–fit age older than 35 Myrs, following Valls-Gabaud (1993).
3. AGN identification

Deharveng et al. (2008) identified broad-line AGN in their sample of Ly emitters as those objects with Ly line widths broader than 1200 km s-1. Narrow line AGN could not be identified since other diagnostic lines of AGN activity were either too faint, or fell in a noisy part of the UV spectra. In order to identify the narrow line AGN, we have used the classic Baldwin et al. (1981, BPT) diagram of [O III]/H versus [N II]/H(shown in Figure 1).
The theoretical maximum line ratios possible for pure stellar photoionization are shown as a dashed curve in Figure 1 (Kewley et al., 2001). To be conservative, we use the Kauffmann et al. (2003) empirical separation between active and star-forming galaxies (solid line). We find that in 2 of our Ly emitters the gas is likely to be ionized by an active nucleus. We note that both cases are in the region of the diagram where stellar photoionization cannot be excluded on the basis of theoretical calculations (Kewley et al., 2001). Among the six galaxies that could not be placed on the BPT diagram, we could still classify 5 of them using either [N II]/H ratio, or the line width. We identify the AGN as those galaxies for which (Miller et al., 2003; Carter et al., 2001). We add 2 AGN based on the [N II]/H ratio. Finally, one of the two galaxies for which the H is too red to be covered by our spectrum has an [O III] line width typical of an AGN ( km s-1). To summarize, we identify 5 AGN out of a sample of 30 galaxies, i.e, the fraction of Ly emitters classified as AGN is 17%, consistent with the recent measurement by (Cowie et al., 2009, 15%), and marginally consistent with the measurement by Finkelstein et al. (2009b, 43). However, Finkelstein et al. (2009) classify AGN using also the presence of high ionization emission lines, that may be indicative of a high-excitation star forming galaxy, rather than an active nucleus.
In the following analysis we only consider those 20 galaxies that are classified as star-forming, and with both H and H detected in the spectrum.
4. Dust Geometry and reddening
In the absence of scattering, the EW of a line is by definition unaffected by dust extinction. For this reason, the Ly EW has often been used to study the effect of scattering on the Ly photons, by comparing the observed values with those expected theoretically (e.g., Giavalisco et al., 1996). The intrinsic Ly EW is, however, predicted to vary by more than 2 orders of magnitude within the first ten Myrs of a star-burst (Charlot & Fall, 1993), and depends on the IMF of the stellar population.
The observed line intensities depend only on the number of ionizing photons and the attenuation produced by dust along the line of sight. Compared to EW, line ratios are a more direct probe of the obscuration of the line photons. For this reason, the comparison of the ratios of resonant to non-resonant lines (i.e., Ly/H) with the ratio of two non-resonant lines (H/H) is optimal for quantifying the effects of dust extinction and resonant scattering on the escape of Ly photons.
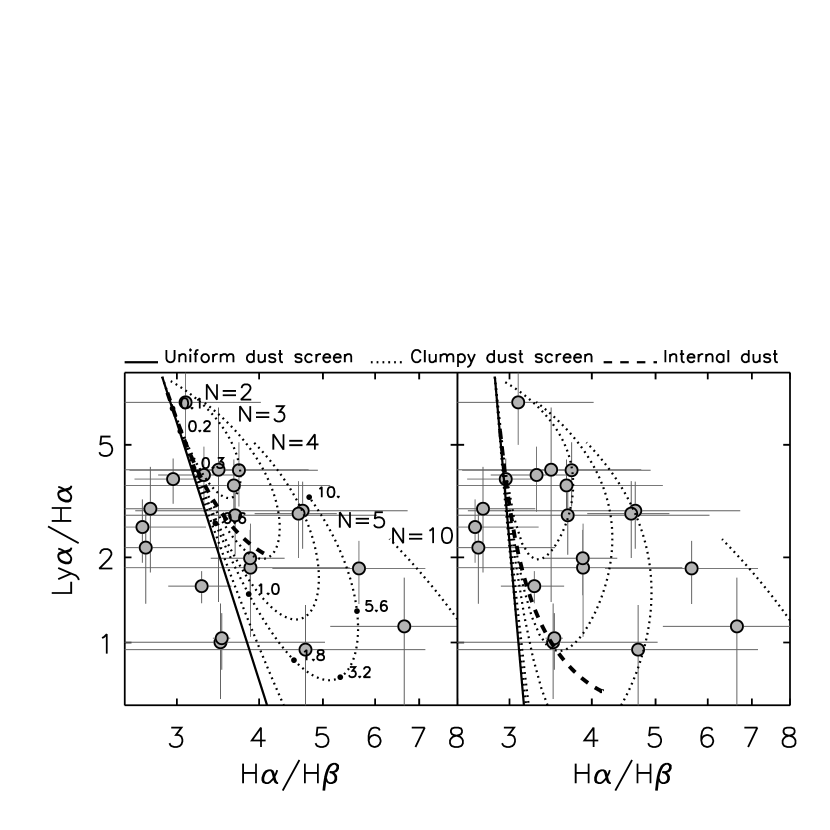
In Figure 2 we show the Ly/H ratio as a function of the observed H/H ratio. Both quantities are corrected for stellar absorption. In the absence of dust, for Case B recombination, K, and cm-3, the expected line ratios are 2.86 and 8.7, for H/H, and Ly/H respectively (Pengelly, 1964). The galaxies show a broad range of H/H values going from the value predicted in Case B recombination theory, up to an H/H. Apart from one galaxy, the Ly/H ratio is always smaller than % of the value predicted for Case B.
In order to interpret the observed line ratios, we will first ignore the effects of resonant scattering on the Ly photons, and consider only the effect of the dust extinction (derived using the H/H ratio) on the Ly/H ratio. Traditionally, this analysis is carried out under the simplifying assumption that the dust is distributed uniformly in a screen far from the source (e.g. Giavalisco et al., 1996; Hayes et al., 2007; Atek et al., 2008; Finkelstein et al., 2008, 2009a). Although valid for point like sources, this simple approximation is found not to hold in more complex systems, as shown by the analysis of Galactic and extragalactic H II regions, where the uniform dust screen approximation fails to reproduce the observed Balmer line ratios (e.g., Natta & Panagia, 1984; Caplan & Deharveng, 1986). More complex geometries do predict different attenuation laws, with the net effect of removing the linearity between the dust optical depth and the logarithm of the observed line intensity.
In order to illustrate this effect, we consider here three different geometries of the dust around the line emitting regions: ) uniform dust screen in front of the emitting sources; ) dust distributed in clumps; ) sources uniformly mixed within uniform dust. The light attenuation333The attenuation is defined as , where and are the observed and intrinsic intensities at . has a different behavior in the three cases. In model ) the attenuation is given by the classical , where the optical depth follows the appropriate extinction curve, and depends only on the intrinsic grain properties. We assume that the dust/gas relative geometry does not affect the physical properties of the grains, and we adopt the extinction curve as parametrized by Cardelli et al. (1989, ). In model ) Natta & Panagia (1984) calculate the attenuation assuming that the dust clumps are Poissonian distributed, and that all clumps have the same optical depth, . Within each clump, follows the Cardelli et al. (1989) extinction law. If is the average number of clumps along the line of sight, then they find that . For a large average number of clumps, and a moderate value of for each clump, the attenuation tends to the uniform dust screen. However, the two models differ greatly if the clumps have large optical depth. In the limit of opaque clumps, the attenuation tends towards the constant value of , i.e., the extinction becomes independent of wavelength, because only the un-extinguished light can be seen. In the third case considered, goes as (Mathis, 1972). In this model for , the attenuation reaches the asymptotic value of . Curves corresponding to the three models are shown in Figure 2 with different line styles as indicated on top of the figure. We use to parametrize the observed line ratios in each of the three models. The black dots along the curve of the clumpy distribution with are labeled with the optical depth at that position.
In reality, Ly photons will be scattered within the clumps, effectively enhancing their chances of being absorbed by dust. This effect can be folded in into the model by assuming that the optical depth for Ly photons, , is higher than the corresponding continuum optical depth, i.e., . The left panel of Figure 2 shows the same models described above, but computed accounting for the scattering of the Ly photons, assuming, as an example, . As expected, the net effect of increasing the optical depth of the Ly photons results in lower values of the Ly/H ratios for small optical depth. However, for high values of the optical depth, the asymptotic behavior of the curves remains unchanged, and so do our conclusions.
5. Discussion
From Figure 2 we can see that at H/H the uniform dust screen model (solid line) predicts an observed Ly/H ratio of 10% of the Case B value. Clearly, the observed values of Ly/H for H/H are much higher than the prediction of a simple dust screen. Correcting the Ly luminosities using the attenuation derived for a uniform dust screen would result in a corrected line ratio –hereafter (Ly/H)C– well above the predicted value of 8.7. Neufeld (1991) and Hansen et al. (2006) discuss a multi-phase geometry, where the dust is confined in cold clumps and immersed in ionized gas. A topology of this kind could serve to shield the Ly photons from the effect of the dust absorption, because resonant photons would be scattered on the surface of the clumps, without crossing them. The Balmer and continuum photons, not affected by the presence of the neutral Hydrogen, would pass through the clumps, leading to a relative enhancement of the Ly EW and Ly / Balmer line ratios. Given the stochastic nature of the Ly scattering, this model should also result in some objects with uncorrected Ly/H greater than the predicted Case B value. As noted above, we do not observe any galaxy with Ly/H. Furthermore, if the continuum is affected by the dust while the Ly photons are not, then this should result in a correlation between the Ly EW and the observed H/H ratio. In fact the four most extreme cases (with Ly/H ratios more than 10 times higher the dust screen value) have among the lowest EW.
A model with the dust uniformly mixed with the sources is not able to reproduce the galaxies with high line ratios (dashed line in Figure 2). This is due to the asymptotic behavior of the attenuation curve for large optical depth. While in a uniform dust screen the H/H (and Ly/H) can reach arbitrarily high (low) values, in the uniformly mixed model the observed H/H ratio reaches the asymptotic value of , and similarly a Ly/H of . In this model the light that is able to reach the observer must come through a thin superficial shell of the galaxy.
Figure 2 demonstrates that the clumpy dust screen can explain the observed data. By varying the average number of clumps along the line of sight, and the intrinsic optical depth of the clumps, the clumpy distribution of dust allows H/H ratios as high as 6 while still allowing a Ly/H ratio of . This is due to the fact that for high values of only the fraction of light that is traveling along sight lines relatively clear of clumps is able to escape the galaxy. We consider an average number of clumps along the line of sight in the range from 2 to 10. It is reasonable to expect that galaxies may have different physical structure, depending on the orientation and size of the galaxies, and that they can be statistically described by different values of .
For three galaxies H/H ratio is consistent with 2.86 (case B), while the Ly/H ratios are % lower than Case B would predict. Such galaxies require an additional mechanism to reduce Ly without affecting the Balmer photons. Possibly, the Ly photons pass through a neutral Hydrogen cloud, without scattering on its surface. This would not alter the observed Balmer line ratios but could suppress part of the Ly photons. Kinematically resolved spectra might test this hypothesis, depending on the kinematics of the H I with respect to the H II region.
6. Conclusions
We have presented the analysis of optical spectra of a sample of 31 Ly emitters, previously identified by Deharveng et al. (2008). We find that in 17% of the Ly emitters the line ratios require the hard ionizing continuum produced by an AGN. This fraction is in agreement with the fraction of AGN discovered in local samples of emission line galaxies, covering a similar range of luminosities.
A uniform dust screen is not able to simultaneously reproduce the observed high values of Ly/H and H/H line ratios. Traditionally, these are explained with ad hoc multiphase models in which Ly photons are shielded from the dust, while non-resonant photons are not (e.g., Neufeld, 1991). We consider alternative possibilities for the geometry of the dust around the emitting sources and find that the observed line ratios are well reproduced by a clumpy dust distribution. We cannot rule out the possibility that a combination of dusty and uniform medium is responsible for the observed line ratios. Our analysis shows that there is no need to invoke models requiring a significant percentage of Ly photons to escape from the galaxy through resonant scattering that avoids the dust. Furthermore, the assumption of a uniform dust screen would result in an over-correction of the Ly intensity.
References
- Atek et al. (2008) Atek, H., Kunth, D., Hayes, M., Ostlin, G., Mas-Hesse, J. M. 2008, A&A, 488, 491
- Atek et al. (2009) Atek, H., Kunth, D., Schaerer, D. et al. 2009, ArXive e-prints 0906.5349
- Baldwin et al. (1981) Baldwin, J. A., Phillips, M. M., Terlevich, R. 1981, PASP, 93, 5
- Bruzual & Charlot (1993) Bruzual, A. G. & Charlot, S. 1993, ApJ, 405, 538
- Bruzual & Charlot (2003) Bruzual, G. & Charlot, S. 2003, MNRAS, 344, 1000
- Caplan & Deharveng (1986) Caplan, J. & Deharveng, L. 1986, A&A, 155, 297
- Cardelli et al. (1989) Cardelli, J. A., Clayton, G. C., Mathis, J. S. 1989, ApJ, 345, 245
- Carter et al. (2001) Carter, B. J., Fabricant, D. G., Geller, M. J., Kurtz, M. J., & McLean, B. 2001, ApJ, 559,606
- Charlot & Fall (1993) Charlot, S. & Fall, S. M. 1993, ApJ, 415, 580
- Cowie et al. (2009) Cowie, L.L., Barger, A.J., Hu, E.M., 2009, ArXive e-prints 0909.0031
- Deharveng et al. (2008) Deharveng, J.-M., Small, T., Barlow, T. A. et al. 2008, ApJ, 680, 1072
- Dijkstra et al. (2006) Dijkstra, M., Haiman, Z., & Spaans, M. 2006, ApJ, 649, 14
- Finkelstein et al. (2008) Finkelstein, S. L., Rohads, J. E., Malhotra, S. et al. 2008, ApJ, 678, 655
- Finkelstein et al. (2009a) Finkelstein, S. L., et al., 2009, ApJ, 700, 276
- Finkelstein et al. (2009b) Finkelstein, S. L., et al., 2009, ApJ, ArXive e-prints 0906.4554
- Giavalisco et al. (1996) Giavalisco, M., Koratkar, A., & Calzetti, D. 1996, ApJ, 466, 831
- Hansen et al. (2006) Hansen, M. & Oh, S. P. 2006, MNRAS, 367, 979
- Hayes et al. (2007) Hayes, M. et al. 2007, MNRAS, 382, 1465
- Kauffmann et al. (2003) Kauffmann, G. et al. 2003, MNRAS, 341, 33
- Kewley et al. (2001) Kewley, L. J. et al. 2001, ApJ, 556, 121
- Laursen & Sommer-Larsen (2007) Laursen, P. & Sommer-Larsen, J. 2007, ApJ, 657, L69
- Mathis (1972) Mathis, J. S. 1972, ApJ, 176, 651
- Miller et al. (2003) Miller, C. J. et al. 2003, ApJ, 597, 142
- Natta & Panagia (1984) Natta, A. & Panagia, N. 1984, ApJ, 287, 228
- Neufeld (1990) Neufeld, D. A. 1990, ApJ, 350, 216
- Neufeld (1991) Neufeld, D. A. 1991, ApJ, 370, L85
- Oke & Gunn (1982) Oke, J. B. & Gunn, J. E. 1982, PASP, 94, 586
- Ostlin et al. (2008) Ostlin, G. et al. 2008, ArXiv e-prints
- Panagia & Ranieri (1973a) Panagia, N. & Ranieri, M. 1973a, A&A, 24, 219
- Panagia & Ranieri (1973b) Panagia, N. & Ranieri, M. 1973b, in Les N´ebuleuses Plan´etaires, 275–280
- Pengelly (1964) Pengelly, R. M. 1964, MNRAS, 127, 145
- Valls-Gabaud (1993) Valls-Gabaud, D. 1993, ApJ, 419, 7
- Verhamme et al. (2006) Verhamme, A., Schaerer, D., & Maselli, A. 2006, A&A, 460, 397
- York et al. (2000) York, D. G. et al. 2000, AJ, 120, 1579
| Object | RA | DEC | Ly flux(a)(a) Ly flux from Deharveng et al. (2008). | H flux | H flux | (b)(b)Redshift computed from the optical emission lines. | Class(c)(c)Class: Galaxy classification based on the optical emission lines. SFstar–forming galaxy, AGN active nucleus. |
|---|---|---|---|---|---|---|---|
| (deg) | (deg) | erg cm-2 s-1 | erg cm-2 s-1 | erg cm-2 s-1 | |||
| GROTH–13305 | 215.8867 | 52.6237 | 1.70 | (1.490.10) | (2.2 0.1) | 0.2836 | SF |
| GROTH–14069 | 215.3526 | 52.6555 | 1.80 | (2.580.10) | (7.37 0.69) | 0.2582 | SF |
| GROTH–17005 | 215.1805 | 52.7188 | 2.87 | (1.180.08) | (3.23 0.52) | 0.2467 | SF |
| GROTH–17525 | 215.8241 | 52.7135 | 2.62 | (2.580.13) | 6.15 | 0.2770 | SF |
| GROTH–17867 | 215.8429 | 52.7425 | 1.21 | (1.280.10) | (2.73 0.43) | 0.2774 | SF |
| GROTH–19002 | 214.4387 | 52.7719 | 2.94 | (5.770.58) | 3.04 | 0.2439 | SF |
| GROTH–36336 | 214.5818 | 53.3393 | 2.24 | (1.950.15) | 1.04 | 0.2647 | SF |
| GROTH–36896 | 214.9730 | 53.3764 | 3.29 | (2.530.05) | (4.46 0.50) | 0.1942 | SF |
| GROTH–5715 | 214.2262 | 52.4111 | 3.59 | (1.780.07) | (3.82 0.34) | 0.2466 | SF |
| GROTH–37457 | 214.7951 | 53.2660 | 4.38 | (2.430.12) | 8.00 | 0.2639 | AGN |
| GROTH–31403 | 214.2910 | 53.0867 | 2.25 | (1.100.06) | (2.99 0.55) | 0.2672 | SF |
| GROTH–21404 | 215.1861 | 52.8351 | 2.53 | (2.060.06) | (5.30 0.29) | 0.2518 | SF |
| GROTH–3525 | 214.7796 | 52.3522 | 2.41 | (1.300.11) | 1.79 | 0.2649 | AGN(d)(d)Classification in SF or AGN based on the [N II]/H ratio. GROTH–23096 was classified as an AGN based on the width of the [O III] emission lines. |
| GROTH–37380 | 215.1904 | 53.3248 | 1.93 | (1.320.08) | (4.92 0.38) | 0.2631 | SF |
| GROTH–12279 | 214.3008 | 52.5991 | 2.08 | (1.340.06) | (5.02 0.43) | 0.2612 | SF |
| GROTH–20285 | 215.1330 | 52.7994 | 4.11 | (1.410.03) | (4.08 0.28) | 0.2517 | SF |
| GROTH–7430 | 214.4311 | 52.4683 | 7.67 | (2.030.08) | (6.85 0.91) | 0.2079 | SF |
| NGPDWS–23690 | 219.8446 | 35.3075 | 5.88 | (3.860.10) | (9.95 0.63) | 0.2477 | SF |
| NGPDWS–10002 | 219.0922 | 34.9421 | 4.33 | (2.060.06) | (7.52 0.44) | 0.2685 | SF |
| NGPDWS–33782 | 219.5770 | 35.6305 | 6.05 | (1.800.08) | (5.45 0.39) | 0.2618 | SF |
| NGPDWS–11927 | 219.1004 | 34.9935 | 4.34 | (7.090.48) | … | 0.2145 | SF(d)(d)Classification in SF or AGN based on the [N II]/H ratio. GROTH–23096 was classified as an AGN based on the width of the [O III] emission lines. |
| NGPDWS–23216 | 218.6954 | 35.2844 | 4.09 | (3.660.40) | 5.74 | 0.1902 | SF |
| NGPDWS–6731 | 219.1529 | 34.8428 | 1.01 | (4.410.11) | (9.61 0.47) | 0.2796 | AGN |
| NGPDWS–28521 | 219.0262 | 35.4586 | 4.05 | (1.520.08) | (4.07 0.52) | 0.2493 | SF |
| NGPDWS–35813 | 219.0558 | 35.7291 | 3.70 | (7.410.47) | (2.39 0.30) | 0.2596 | SF |
| NGPDWS–32840 | 219.2433 | 35.5977 | 2.32 | (3.830.15) | 5.69 | 0.2058 | AGN(d)(d)Classification in SF or AGN based on the [N II]/H ratio. GROTH–23096 was classified as an AGN based on the width of the [O III] emission lines. |
| SIRTFFL–14450 | 259.2110 | 59.9642 | 2.22 | (2.140.02) | (6.10 0.14) | 0.1815 | SF |
| SIRTFFL–14085 | 258.1492 | 59.9468 | 2.87 | (3.210.07) | (9.83 0.80) | 0.2203 | SF |
| SIRTFFL–10895 | 258.5918 | 59.8333 | 6.18 | (1.230.05) | … | 0.2297 | SF(d)(d)Classification in SF or AGN based on the [N II]/H ratio. GROTH–23096 was classified as an AGN based on the width of the [O III] emission lines. |