Characterising the Far-infrared Properties of Distant X-ray Detected AGNs: Evidence for Evolution in the Infrared–X-ray Luminosity Ratio
Abstract
We investigate the far-infrared properties of X-ray sources detected in the Chandra Deep Field-South (CDF-S) survey using the ultra-deep 70 µm and 24 µm Spitzer observations taken in this field. Since only 30 (i.e., %) of the 266 X-ray sources in the region of the 70 µm observations are detected at 70 µm, we rely on stacking analyses of the 70 µm data to characterise the average 70 µm properties of the X-ray sources as a function of redshift, X-ray luminosity and X-ray absorption. Using Spitzer-IRS data of the Swift-BAT sample of active galactic nuclei (hereafter, AGNs), we show that the 70/24 µm flux ratio can distinguish between AGN-dominated and starburst-dominated systems out to . Among the X-ray sources detected at 70 µm we note a large scatter in the observed 70/24 µm flux ratios, spanning almost a factor of 10 at similar redshifts, irrespective of object classification, suggesting a range of AGN:starburst ratios. From stacking analyses we find that the average observed 70/24 µm flux ratios of AGNs out to an average redshift of 1.5 are similar to AGNs with similar X-ray luminosities ( erg s-1) and absorbing column densities ( ). Furthermore, both high redshift and AGNs follow the same tendency toward warmer 70/24 µm colours with increasing X-ray luminosity (). From analyses of the Swift-BAT sample of AGNs, we note that the 70 µm flux can be used to determine the infrared (8-1000 µm) luminosities of high redshift AGNs. We use this information to show that erg s-1AGNs at high redshifts () have infrared to X-ray luminosity ratios (hereafter, ) that are, on average, and times higher than AGNs with similar X-ray luminosities at and , respectively. By comparison, we find that the ratios of erg s-1 AGNs remain largely unchanged across this same redshift interval. We explore the consequences that these results may have on the identification of distant, potentially Compton-thick AGNs using ratios. In addition, we discuss possible scenarios to account for the observed increase in the ratio with redshift, including changes in the dust covering factor of AGNs and/or the star formation rates of their host galaxies. Finally, we show how deep observations to be undertaken by the Herschel Space Observatory will enable us to discriminate between these proposed scenarios and also identify Compton-thick AGNs at high redshifts.
keywords:
galaxies: Active Galaxies, High Redshift, Infrared: Galaxies, X-rays: Galaxies1 Introduction
Deep X-ray surveys undertaken by the Chandra and XMM-Newton observatories have provided the most efficient method to date of identifying large numbers of active galactic nuclei (hereafter, AGNs) out to high redshifts (; e.g., Alexander et al. 2001; Barger et al. 2003; Bauer et al. 2004; Szokoly et al. 2004; Brandt & Hasinger 2005; Mainieri et al. 2005). Due to the high penetrating power of hard (i.e., 2 keV) X-rays, they provide a means of identifying AGNs that is much less biased toward unobscured AGNs than, for example, that obtained at optical wavelengths alone. Consequently, deep X-ray surveys have revealed that a large fraction (up to 75%; Mainieri et al. 2002; Dwelly & Page 2006; Tozzi et al. 2006; Tajer et al. 2007) of highly obscured AGNs are often unidentified or misclassified by observations at other wavelengths (e.g. Barger et al. 2003; Szokoly et al. 2004). Furthermore, as the central engines of AGNs are the only compact objects capable of producing luminous X-ray emission (i.e., erg s-1), observations at these high energies provide the most reliable method of measuring the intrinsic power of the central engine without suffering from significant contamination by star-formation.
Although X-rays provide an ideal means of studying the central engines of AGNs, they yield limited information on the regions outside the central few parsecs. For example, although X-ray observations have been used extensively to measure the amount of absorbing gas (i.e. ) along our line of sight to the central engine (e.g. Mushotzky et al. 1993; Bassani et al. 1999; Malizia et al. 2003; Guainazzi et al. 2005), they tell us little about the spatial extent and covering factor of the putative obscuring dusty torus, a key component of the unification models that have become a cornerstone of AGN research over the past two decades (e.g. Antonucci & Miller 1985; Krolik & Begelman 1988; Antonucci 1993). Furthermore, as any X-ray emission from stellar processes will be swamped by the presence of an AGN, X-rays alone provide little insight into the relationship between star-formation and AGN activity that is predicted by both galaxy formation models (e.g. Kauffmann & Haehnelt 2000; Benson et al. 2003; Granato et al. 2004; Bower et al. 2006; Booth & Schaye 2009) and locally defined black hole–bulge relationships (e.g. Magorrian et al. 1998; Gebhardt et al. 2000; Tremaine et al. 2002; McLure & Dunlop 2002). Observations at infrared (hereafter, IR) wavelengths can provide significant insights on both these counts.
Like X-rays, the longer IR wavelengths (i.e., 5 µm) are largely unaffected by absorption from interstellar gas/dust. However, because IR radiation is typically produced via the reprocessing of shorter wavelength light by dust, it also provides a means to study the dusty environments surrounding AGNs. Furthermore, as both AGNs and starbursting systems are capable of producing large amounts of IR radiation, the study of AGNs at these wavelengths can provide insights into the processes that connects AGN activity and star-formation. However, despite considerable gains in our understanding of the IR properties of AGNs since the launch of the Spitzer Space Telescope, there remains many unresolved questions. For example, we currently lack a clear picture of how the IR emission of AGNs is affected by the differences in the intrinsic power of the central engine and, perhaps more importantly, whether it evolves over cosmic time. As a result, our understanding of both the putative torus and the interplay between AGN activity and star-formation is limited.
To date, most studies of the IR properties of AGNs have concentrated on the relatively short wavelength data provided by the IRAC instrument (3.6 µm, 4.5 µm, 5.8 µm and 8.0 µm) and the 24 µm observations taken with the MIPS instrument on-board the Spitzer Space Telescope (e.g. Lutz et al. 2004; Stern et al. 2005; Donley et al. 2007; Daddi et al. 2007). However, studies of high redshift objects at these shorter wavelengths are hindered by the presence of strong spectral features at 12 µm (in particular polycyclic aromatic hydrocarbons [PAHs], silicate absorption features and strong emission lines) that shift into these wavebands at . For example, the IR luminosities of high redshift galaxies are overestimated by a factor of (depending on redshift and ) when using 24 µm data alone compared to that calculated using the full IR SED incorporating longer wavelength data (at 70 µm and 160 µm; see Papovich et al. 2007; Magnelli et al. 2009, Magnelli et al. 2009 [in prep.]). Furthermore, as emission from high redshift starbursting systems peaks at longer wavelengths than those probed by the 24 µm waveband, the sole use of near and mid-IR observations hampers our ability to efficiently distinguish between star-formation and AGN dominated systems. This too can be resolved by incorporating longer wavelength IR data into our analysis. Undoubtedly, the launch of the Herschel Space Telescope, with its ability to observe the universe at , will help in addressing these issues. However, progress can be made now by applying stacking analyses to deep Spitzer 24 µm and 70 µmobservations, enabling us to measure the average IR properties of AGNs at a sensitivity level comparable to that achievable for individual sources in the proposed deep Herschel fields (e.g. the HGOODS Key Programme111URL: http://herschel.esac.esa.int/Docs/KPOT/GOODS_Herschel.pdf; PI: D. Elbaz).
In this paper we investigate the mid to far-IR properties of X-ray detected AGNs that lie in the confusion-limited 70 µm and 24 µm Spitzer-MIPS Far-Infrared Deep Extragalactic Legacy Survey (FIDEL) and Great Observatories Origins Deep Survey (GOODS). We identify AGNs using the 1 Ms Chandra Deep Field-South X-ray observations (which have high quality X-ray spectral constraints published in Tozzi et al. 2006) and explore their 70 µm fluxes, luminosities, and 70/24 µm flux ratios (hereafter, ) as a function of redshift, X-ray luminosity, and X-ray absorption. As part of our analysis we use the Swift-BAT sample of local, well studied AGNs to develop diagnostics to distinguish between starburst (hereafter, SB) and AGN dominated systems at . In the CDF-S field we find evidence that more X-ray luminous AGNs have warmer, more AGN dominated IR colours and that high–, low X-ray luminosity (i.e., , erg s-1) AGNs are significantly more IR luminous than their low redshift counterparts (i.e., , erg s-1). This increase in IR luminosity may be interpreted as tentative evidence of larger dust covering factors in high redshift AGNs, supporting results from deep X-ray surveys which find evidence of larger levels of at similar redshifts (e.g. La Franca et al. 2005; Hasinger 2008. However, a proportion of this increase may also be attributed to higher levels of star-formation in these systems. We show that deep, far-IR Herschel surveys will resolve the dominant process behind this increase in IR luminosity and enable the discrimination between AGN and star-formation dominated systems out to 5–6.
Throughout this work we adopt km s-1 Mpc-1, , and . We report 1 errors for detected sources and provide 3 upper limits for undetected sources (3).
2 Data
Our main focus throughout this work is the analysis of the mid and far-infrared (MIR [5–30 µm] and FIR [30–300 µm], respectively) emission of X-ray detected sources in the CDF-S field. To aid in the interpretation of the CDF-S data, we also make use of archival Spitzer-IRS spectra and IRAS data for the Swift-BAT sample of local X-ray AGNs, two archetypal AGNs (NGC 1068 and NGC 6240), and a distant quasi-stellar object (QSO) sample. We describe the CDF-S sample in §2.1 and the comparison samples in §2.2.
2.1 CDF-S Sample of X-ray Detected AGNs & Starbursts
2.1.1 Chandra Data
The X-ray data for our main sample are taken from the 1 Ms CDF-S X-ray observations (Giacconi et al. 2002), as analysed by Alexander et al. (2003). In total there are 201, 304, and 326 X-ray detected objects in this region down to limiting 2-8 keV fluxes of , and erg s-1 cm-2, respectively. The CDF-S data is deep enough to detect star-formation activity out to . Since the primary aim of this study is to explore the IR properties of X-ray detected AGNs, we have used the Bauer et al. (2004) X-ray source classifications to separate AGNs from star-forming galaxies. In the full catalogue of X-ray sources, there are 288 X-ray AGNs and 15 X-ray SBs (the remaining 23 are classed as either normal galaxies or stars and are excluded from further discussion). The absorption corrected 2–10 keV X-ray luminosities () and X-ray absorption column densities () are taken from Tozzi et al. (2006). Here, we only consider those 266 X-ray AGNs/SBs with well defined and measurements. Spectroscopic and photometric redshifts for these 266 X-ray AGNs/SBs were also taken from Tozzi et al. (2006); 137 have spectroscopic redshifts (113 of which are described as secure, see Tozzi et al. 2006 for details). We use photometric redshifts for the remaining 129 X-ray AGNs/SBs that lack spectroscopic redshifts.
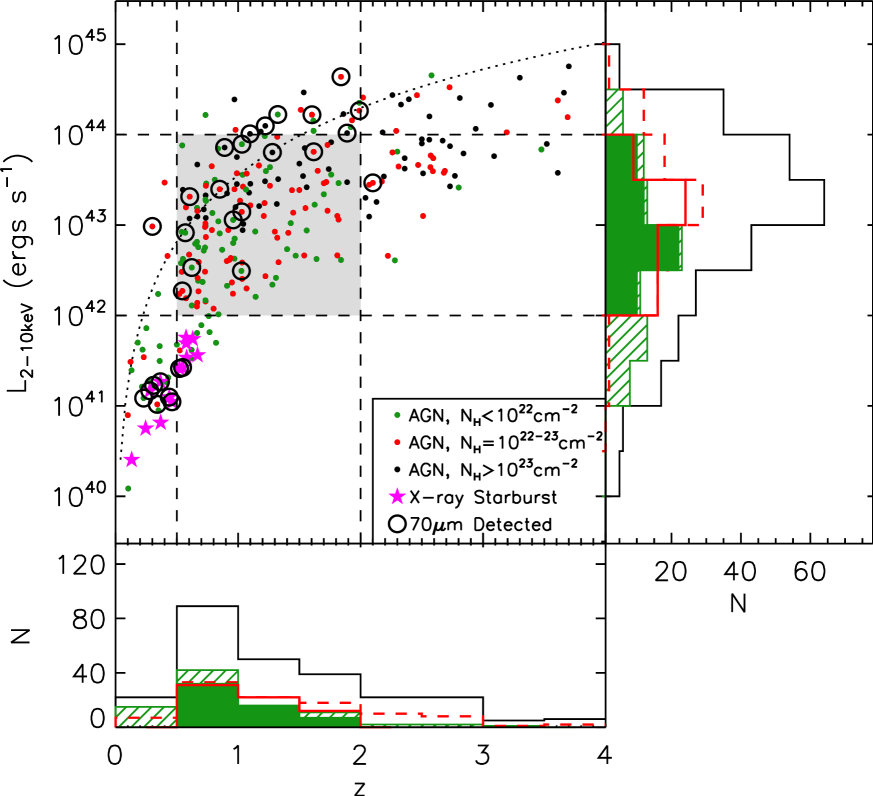
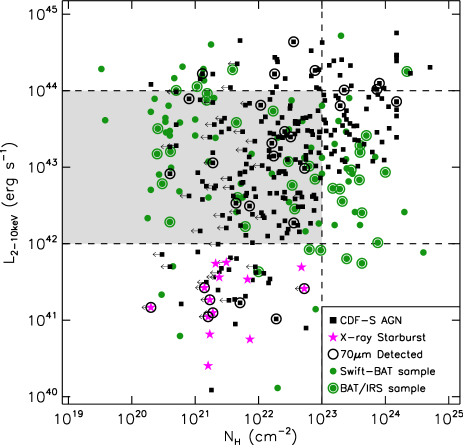
In Fig. 1 we present the -redshift distribution of the 266 X-ray AGNs/SBs considered in this study. As is to be expected in flux limited samples, there is a strong bias toward the detection of more luminous sources at higher redshifts. Furthermore, as is shown in Fig. 2, there is a bias toward higher column densities at higher X-ray luminosities because a) only the brightest X-ray sources can be detected behind and b) it is difficult to measure low values of at high redshifts due to the absorption cut-off being shifted out of the lowest Chandra energy band. In our analysis we consider two main samples: a) the full sample of classified X-ray AGNs/SBs and b) a ‘Restricted’ sample limited to those AGNs with erg s-1 and within the redshift range of (indicated by the shaded regions in Figs.1 and 2). The ‘Restricted’ sample is used to mitigate the effects of absorption and selection biases on the average results; the and range of the restricted sample is also well matched to the 0 Swift-BAT comparison sample (see §2.2.1).
2.1.2 Spitzer Data
The 24 µm and 70 µm Spitzer-MIPS GOODS/CDF-S222URL: http://www.stsci.edu/science/goods/ observations (PID: 20147; P.I.: D. Frayer) and FIDEL333URL: http://irsa.ipac.caltech.edu/data/SPITZER/FIDEL/ legacy surveys (PID: 30948; P.I.: M. Dickinson) are the deepest available at these wavelengths and therefore present the best datasets to study the MIR to FIR emission of AGNs in the high– universe. While the FIDEL region covers the full E-CDFS (Lehmer et al. 2005), the deepest region is the 10′ 10′ region centred on the CDF-S field covered by the GOODS observations. The raw 70 µm data were processed off-line using the Germanium Reprocessing Tools (GeRT), following the techniques described in Frayer et al. (2006). The final mosaics, produced by MOPEX444URL: http://ssc.spitzer.caltech.edu/postbcd/download-mopex.html, have a pixel scale of 4.0″. The 70 µm sensitivity is 2.0 mJy in the CDF-S field and 3.0 mJy in the outer E-CDFS regions. The 24 µm images produced using MOPEX have a pixel scale of 1.2″. The sky coverage at 24 µm is inhomogeneous and the sensitivity ranges from 30 to 70 Jy (). Assuming a SNR of 4.1 for the the 24 µm observations (corresponding to an mean flux limit of 50 Jy) there are 14025 detected sources in the FIDEL field.
2.1.3 X-ray–IR source matching
We matched the classified X-ray sources to the 70 µm sources assuming a search radius of 2.0″ for those sources in the GOODS field with 24 µm/IRAC counterparts and 4.0″ in the larger FIDEL field. This yields 30 matches which are listed in Table 1, representing 11% of the 266 X-ray AGNs/SBs. Using the -statistic (); e.g., see Downes et al. 1986 and Eqn 1 in Pope et al. 2006) and a 70 µm source density 2.0 deg-2, the chance of one or more 70 µm source lying within 4.0″of an X-ray source is %. Given the small value of , it was not necessary to apply the correction to the matching procedure described by Downes et al. (1986).
We matched the X-ray sources to the 24 µm sources using a 3.0″ search radius; this search radius was found to provide the best compromise between finding real matches while reducing the number of spurious matches. Out of the 266 CDF-S X-ray AGN/SBs we found 172 have 24 µm counterparts (i.e., 65%). The number of spurious matches in the CDF-S field was estimated to be using two approaches (1) by calculating the area of the field covered by 24 µm sources, assuming that each source is a circle of radius 3.0″, and (2) by shifting the positions of the 24 µm sources by a random displacement between 20 and 55 and then re-matching to the X-ray sample. This spurious matching fraction is consistent with the -statistic (3%), assuming 1.5 deg-2 (see above). In spite of the larger -statistic associated with the 24 µm matches compared to the 70 µm matches, the correction described in Downes et al. (1986) need only be applied to 15 (6%) of the 266 X-ray sources and has negligible effect on any of our results.
All but one of the 70 µm detected sources has a 24 µm counterpart. Further investigation reveals that the lack of a matched 24 µm counterpart is the result of the larger PSF of the 70 µm image; at the corresponding position in the 24 µm image there is a cluster of sources that lie just outside the 3.0″ matching radius which blend to form a single “source” in the 70 µm image. To mitigate source blending we de-blend the 70 µm sources with Gaussians placed at the 24 µm positions. It is these ‘de-blended’ fluxes that are reported in Table 1.
2.1.4 24 µm and 70 µm stacking procedure
As the majority of the X-ray sources are not detected at 70 µm we rely on stacking analyses to provide insight into their average MIR to FIR properties. Stacking was performed using the code of Huynh et al. (2007). Cutouts of 128″ x 128″ (32 x 32 pixels) were made from the 70 µm image at the stack positions and combined using a weighted mean. The 70 µm stacked flux density was measured using an aperture of 8.0″ at the stacked image center. Offset stacks were generated using random but nearby offset positions (″) in the 70 µm image. Two hundred randomly offset stacks were made and the uncertainty in the stacked flux is taken as the standard deviation of the measured flux density in the 200 offset stacks.
We created stacks that either include or exclude the 70 µm detected sources; the former (hereafter, “all”) provides a global average of the FIR properties of all X-ray sources and the latter (hereafter, “undetected”) provides the average of the 70 µm undetected X-ray sources that is less skewed by individual bright 70 µm sources. We also stack only the 70 µm detected sources for comparison (hereafter, “detected”). Because the all stacks often appear to be dominated by the few 70 µm detected sources we generally use the detected and undetected stacks in our analysis.
In order to isolate trends between the IR emission from AGNs and other physical properties we further split the ‘Restricted’ sample (see §2.1.1) in terms of ( erg s-1, erg s-1), ( , ) and redshift (, ).
2.2 Comparison Samples
In our analysis we compare the results from the sample of CDF-S X-ray AGNs/SBs to the IR properties of two archetypal AGNs, a sample of bright QSOs from Richards et al. (2006) and, most importantly, a sample derived from local () AGNs in the Swift-BAT catalogue of hard X-ray detected AGNs (see §2.2.1, appendix and Tueller et al. 2008). For the latter we selected those AGNs that cover the same range of X-ray properties (i.e. and ; see Fig. 2) as the CDF-S X-ray AGNs sample and also have archival Spitzer-IRS spectra and/or IRAS flux density measurements. The result is a sample that is directly comparable to the more distant CDF-S AGNs, but which has far superior IR data due to the relative proximity of the sources.
2.2.1 The Swift-BAT Sample
The Swift telescope is currently undertaking a survey of X-ray bright ( 5 erg s-1 cm-2) AGNs using its on-board Burst Alert Telescope (BAT); the second data release (DR2) of this survey has recently been published in Tueller et al. (2008). As the BAT instrument is sensitive only to very hard X-rays (14-195 keV) this survey has resulted in a sample of local555135 of the 153 AGNs with measured redshifts in the BAT sample (presented in Tueller et al. 2008) have . AGNs that is largely unaffected by absorption (to ). The and distributions of the 104 AGNs for which archival 2-10 keV data exist (Bassani et al. 1999; Winter et al. 2009) are comparable to the CDF-S sample (see Figs. 7 and 10 of Winter et al. 2009). Of these 104 AGNs, 61 have flux density measurements from all four IRAS bands (these 61 objects are hereafter referred to as the BAT/IRAS sample) which we convert to using Eqns. 2 and 3 in Table 1 of Sanders & Mirabel (1996). A search of the Spitzer archives reveals that 36 of the 104 AGNs with 2-10 keV data have Spitzer-IRS spectroscopy between 5.2–38 µm (these 36 objects are hereafter referred to as the BAT/IRS sample) which we use in conjunction with IRAS data to derive the expected observed 24 µm and 70 µm fluxes at the redshifts covered by the CDF-S sample. All of the AGNs in the BAT/IRS sample are also in the BAT/IRAS sample. See appendix for full details of the IRS/IRAS analysis.
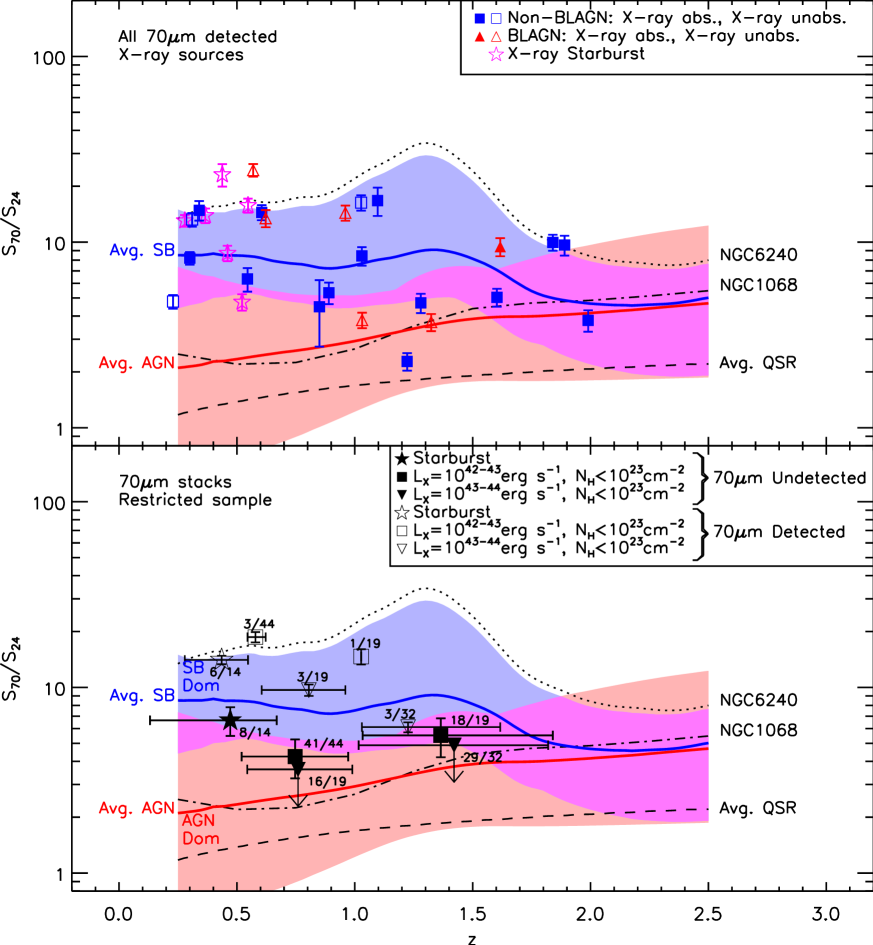
On separating the BAT/IRS sample into SB and AGN dominated objects we find that the ratio is able to discriminate between these two types of sources out to (see shaded regions in Fig. 4 and appendix). Furthermore, we note that the 70 µm flux density can predict the infrared luminosities of all the BAT/IRS objects (i.e., both SB-dominated and AGN-dominated AGNs), as well as the starburst galaxies described in Brandl et al. (2006), to within a factor of 3. This compares to a factor 12 uncertainty in using 24 µm flux densities alone (see appendix and Fig. 11).
In the plots that follow, we indicate the average IR properties of the BAT/IRS sample using red and blue lines for the AGN and SB dominated systems, respectively. Shading is used to indicate the range of MIR and FIR properties of the BAT/IRS sample.
2.2.2 NGC 1068, NGC 6240 and the QSO sample
In addition to the BAT/IRS sample we also compare the CDF-S AGNs with two well studied heavily obscured AGNs, NGC 1068 and NGC 6240. The former is regarded as the “quintessential” type-II AGN, showing evidence of a hidden broad line region in polarised light (e.g. Antonucci & Miller 1985); the latter is a heavily obscured AGN that is SB-dominated at infrared wavelengths and is often cited to characterise the properties of faint X-ray AGNs. The tracks for these AGNs were derived from archival Spitzer-IRS spectra following the same procedure as used for the BAT/IRS sample as outlined in the appendix.
Finally, we use the average QSO SED of Richards et al. (2006) to give an
indication of the typical IR properties of luminous, unobscured
type-I AGNs.
We stress that the comparison samples considered here do not cover the full range of SEDs seen in the general galaxy population. It is known, for example, that very strongly starbursting systems have larger flux ratios than NGC 6240 (e.g. Arp 220). Furthermore, some quiescent galaxies are known to have low flux ratios similar to those of AGNs in the BAT/IRS sample (see Alexander et al., in prep). However, our main aim here is to explore the IR emission of AGNs with X-ray properties comparable to the CDF-S AGNs, which excludes such extreme systems. We find that known starbursting systems, such as those presented in Brandl et al. (2006), all produce expected flux ratios either consistent with or higher than those of the SB-dominated BAT/IRS AGNs, as indicated by the shaded region in Fig. 11.
3 Results
In our analysis we investigate the IR properties of the CDF-S X-ray AGNs and SBs, including the flux ratios, the IR luminosities and the IRX-ray luminosity ratios. To aid in our analysis we compare the properties of the CDF-S X-ray sources with expectations based on the more detailed analysis of nearby AGNs with the same X-ray properties as the CDF-S sample (i.e., ; ). Since only a minority of CDF-S X-ray AGNs are detected at 70 µm, our analyses rely significantly on 70 µm stacking analyses and the 24 µm fluxes of individual sources.
3.1 Individual 70 µm detected sources
3.1.1 X-Ray properties and redshift distribution
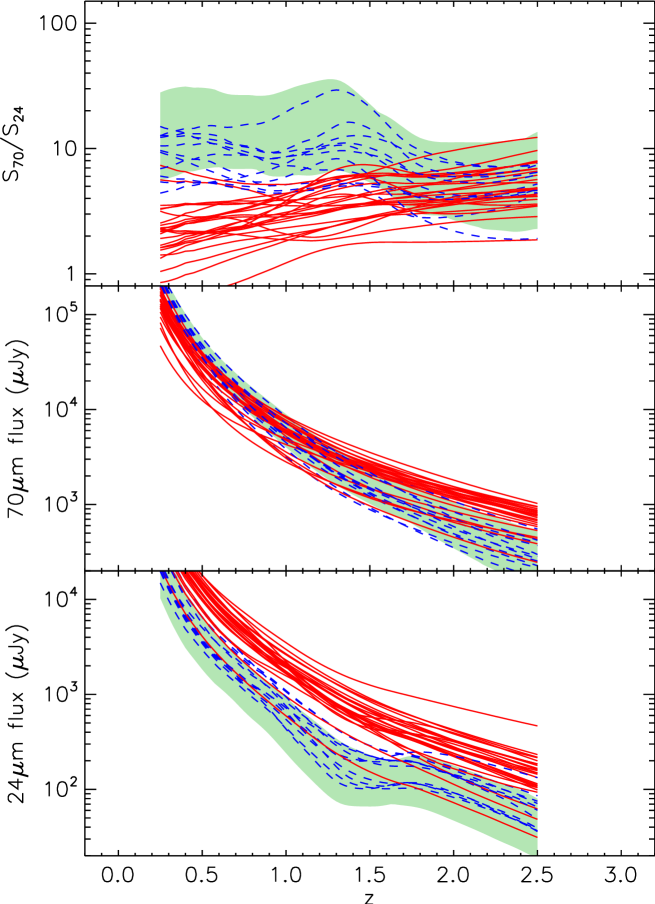
In Fig. 1 we show the X-ray luminosity-redshift distribution for the CDF-S X-ray AGNs/SBs and highlight the 70 µm detected objects. As might be expected, there is a preference for bright X-ray AGNs to be detected at 70 µm. However, there are up to 2 orders of magnitude difference in for 70 µm-detected sources at the same redshift, suggesting a large range of X-ray/IR luminosity ratios. As we show in Fig. 3, detection at 70 µm is strongly dependent on the 24 µm flux density. None of the AGNs with Jy, and fewer than a quarter (10/45; 22%) of those with Jy, are detected at 70 µm. Conversely, the majority (19/28; 68%) of those AGNs with Jy are detected at 70 µm.
The 70 µm detected sources span a broad range of X-ray properties. Of the 29 sources detected at both 70 µm and 24 µm, 15 (52%) are non-broad-line AGNs (non-BLAGNs), 6 (21%) are broad-line AGNs (BLAGNs) and 8 (28%) are X-ray detected SBs. These 70 µm detected sources comprise 15/218 (7%) of the non-BLAGNs, 6/34 (18%) of BLAGNs and 6/14 (43%) of the X-ray detected SBs; the bias toward the BLAGNs and X-ray detected SBs could be due to the BLAGNs and SBs having high and large IR–X-ray luminosity ratios, respectively. The 70 µm detection of AGNs shows no apparent dependency on absorbing column density: for example, at , 6/17 ( 35%) 70 µm detected sources are unabsorbed ( ), 5/17 ( 29%) are absorbed ( ) and 6/17 ( 35%) are heavily absorbed ( ).
3.1.2 Distinguishing between SB and AGN dominated systems
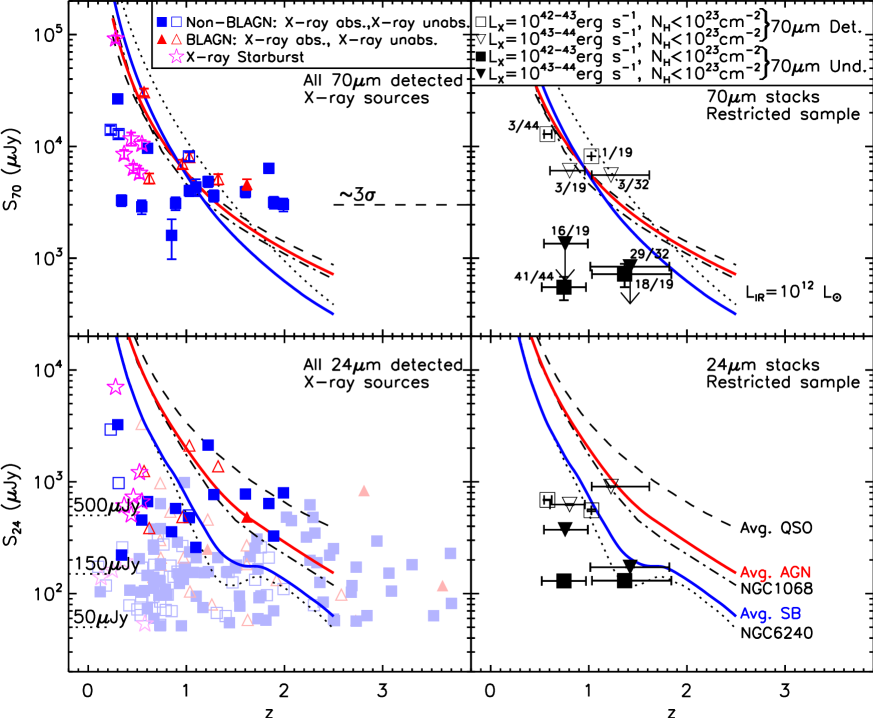
In Fig. 4 we show the flux ratios of all of the CDF-S X-ray AGNs/SBs and compare them to the range expected for the BAT/IRS AGN sample and the well studied local AGNs and quasars; see section 2.2.1 and appendix. The flux ratio provides an effective discrimination between those AGNs with AGN-dominated or SB-dominated IR SEDs to . Using the tracks derived for the BAT/IRS sample we find that 15/23 (65%) and 5/23 (22%) of the 70 µm detected CDF-S AGNs have flux ratios consistent with SB-dominated and AGN-dominated systems, respectively; the remaining three 70 µm detected AGNs lie in regions of the plot that are consistent with either SB or AGN dominated systems. Ten ( 42%) of the 70 µm detected CDF-S AGNs have flux ratios within a factor of 1.5 of the NGC 6240 track, five of which are X-ray absorbed and five of which are X-ray unabsorbed. The maximum flux ratio of the 70 µm detected sources is . This is marginally inconsistent with Papovich et al. (2007) who found 3/30 (10%) X-ray detected AGNs in their 70 µm selected sample with . However, the larger area covered by their survey increases the likelihood of finding rare AGNs with more extreme flux ratios that are not represented by our comparison samples; see §2.2.
Among the 70 µm detected sources we find no difference in flux ratio between BLAGNs and non-BLAGNs, nor between X-ray absorbed and X-ray unabsorbed AGNs (i.e., and , respectively), implying that the material that absorbs photons at X-ray and optical wavelengths is optically thin to rest frame MIR–FIR radiation, see §3.1.1. The average flux ratios and redshifts of the absorbed (unabsorbed) 70 µm detected AGNs are and 666Given errors correspond to the standard deviation in the stacked flux, respectively.
All six 70 µm detected X-ray SBs have flux ratios consistent with that expected of SB-dominated systems. However, one of the SBs has a flux ratio larger than that expected from the BAT/IRS sample and is typical of the extreme SB systems presented in Brandl et al. (2006), see Fig. 11. The 70 µm detected X-ray SBs also span the same range of flux ratios as the seven 70 µm detected X-ray AGNs that lie in the same redshift interval (i.e., ), providing further evidence that these AGNs have SB-dominated IR SEDs.
3.1.3 IR fluxes and luminosities of individual, 70 µm-detected AGNs
Since we can provide a good characterisation of the basic IR SEDs of the 70 µm-detected CDF-S X-ray AGNs, we can accurately estimate their IR luminosities. We derive for the 70 µm detected sources by first selecting one of the five tracks plotted in Fig. 4 that best matches the flux ratio of a given CDF-S X-ray AGN, then scaling its IR luminosity to reproduce of the CDF-S source if observed at the same redshift. Estimating in this manner assumes that the IR SEDs of AGNs at the redshifts covered by the CDF-S observations are similar to those seen in the comparison AGN samples. We take some confidence that this is indeed the case as the range of flux ratios of the 70 µm detected subsample is largely bounded by the tracks of our comparison sample.
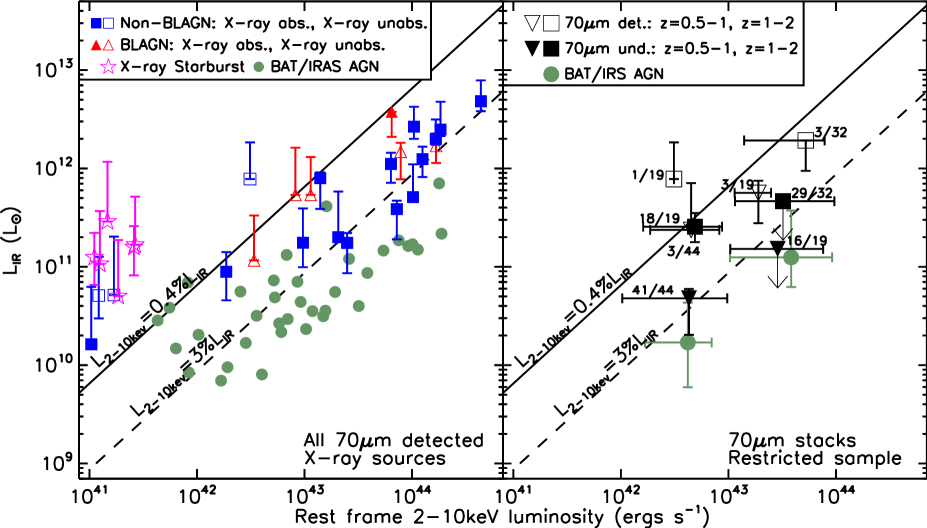
In the left panel of Fig. 5 we show the of the 70 µm detected sample plotted as a function of . We find no significant difference in between BLAGNs and non-BLAGNs or between X-ray absorbed and unabsorbed AGNs. This independence of on classification provides further supporting evidence that the material that absorbs photons at X-ray and optical wavelengths is optically thin to rest frame MIR–FIR radiation, see §§3.1.1 & 3.1.2. The 70 µm detected CDF-S X-ray AGNs are typically more IR luminous than their counterparts in the BAT/IRAS sample of local AGN. This result may be due to the low sensitivity of the 70 µm observations, which could lead to a bias towards the detection of the most IR-luminous AGNs; indeed, the range of IR luminosities ( 2 orders of magnitude) for the CDF-S X-ray AGNs is narrower than the range of X-ray luminosities ( 3 orders of magnitude). Overall, the ratios of the 70 µm detected CDF-S AGNs/SBs span almost 2 orders of magnitude.
The 70 µm detected X-ray SBs have higher ratios than the majority (20/22; 91%) of the 70 µm detected X-ray AGNs. We find all three 70 µm detected X-ray AGNs with erg s-1 have ratios and flux ratios comparable to the 70 µm detected X-ray SBs (Tozzi et al. 2006 index: 525, 538, 575; see Table 1). However, two of these sources (index: 525, 538) have optical spectra consistent with AGNs (Szokoly et al. 2004) while the remainder (index: 575) has a flat X-ray spectral index in the deeper 2 Ms CDF-S catalogue (; Luo et al. 2008). While this confirms their classification as AGNs, it is clear that their IR SEDs are SB dominated.
As only a small fraction of the CDF-S X-ray AGN sample is detected at 70 µm we are unable to reliably constrain the IR properties of the majority of the CDF-S X-ray AGNs/SBs using the 70 µm data alone. To better characterise the IR properties for the majority of the CDF-S X-ray AGNs we therefore use stacking analyses.
3.2 24 µm and 70 µm stacking analysis
The advantage of stacking analyses is that it provides the average properties of sources that lie below the individual source detection limit. However, naturally, information is lost on the fluxes of individual sources. We also stacked the 70 µm and 24 µm data following the procedure outlined in §2.1.4 and present the results in Table 2; although the majority of the CDF-S X-ray sources are detected at 24 µm, we stacked the 24 µm data to provide flux density constraints consistent with those obtained at 70 µm. For completeness, we report the results from stacking the whole sample as well as a range of subsamples (split into bins of , , , 24 µm flux density, and object classification). As noted in §2.1.4, we stacked all X-ray sources in each subsample (“all”), and also stacked only the 70 µm detected objects (“detected”) and only the 70 µm undetected objects (“undetected”). The majority of our analyses will focus on the ‘Restricted’ sample to reduce selection and sensitivity biases (see §2.1.1).
All of the CDF-S X-ray sample is detected significantly in the 70 µm stacks, with an average flux density of =4824 210 Jy. Significant detections () are also found from 70 µm stacking analyses for the majority of the subsamples; however, we note that only 9 ( 50%) of the eighteen 70 µm undetected subsamples are significantly detected. From stacking the CDF-S X-ray sample in bins of 24 µm flux density (i.e. =50-150 Jy, 150-500 Jy and 500 Jy), we find that the 70 µm flux density and the significance of the detection is positively correlated with the 24 µm flux density of the stacked sources, confirming our previous result for the 70 µm detected sources; see §3.1.
We find that when the ‘Restricted’ sample is stacked in bins of and (i.e., stacks 5, 6, 7 and 8 in Table 2) only one 70 µm undetected stack is detected at 70 µm at a significance . The upper limits for these non-detections reveal no significant differences in the IR properties of these subsamples; they are all consistent with 4 and L⊙. The lack of any significant difference between these stacks may be interpreted as providing further tentative evidence that the material that absorbs X-rays is optically thin to rest frame MIR–FIR radiation, see §§3.1.1, 3.1.2 & 3.1.3. Similarly, none of the erg s-1, 70 µm undetected stacks (rows 13 and 14 of Table 2) are detected at in either redshift bin ( 0.5–1 and 1–2). However, in this case the upper limits do provide significant insight into the IR properties of the CDF-S X-ray AGNs, revealing that high AGNs have, on average, warmer flux ratios than their low counterparts (as discussed in §3.2.1).
We proceed with the analysis of the stacked data following a similar procedure as outlined in §3.1 for the 70 µm detected sources.
3.2.1 SB/AGN contribution to the average IR emission of AGNs
In the lower panel of Fig. 4 we show the flux ratios of the ‘Restricted’ subsamples split in terms of and (rows 11, 12, 13 and 14 of Table 2). We find that the average flux ratios of all four 70 µm undetected stacks lie within the range of flux ratios expected for the BAT/IRS AGNs out to 2.5, and run roughly parallel to the average AGN-dominated and average SB-dominated tracks (see §2.2.1 and appendix). The simplest interpretation of this result is that there is little change in the average IR colour with redshift for AGNs in both the erg s-1 and erg s-1 bins. However, the conservative upper limits on the flux ratios of the erg s-1 70 µm undetected AGNs place them below those of the erg s-1 70 µm undetected AGNs in each redshift bin. Based on the BAT/IRS tracks this result suggests that the more X-ray luminous AGNs may have, on average, more AGN-dominated IR SEDs than their lower counterparts; however, deeper data will be required to confirm this result. However, we find that the stacks of the erg s-1 AGNs lie in ambiguous regions of the plot, which limits the conclusions that can be directly derived on the relative contributions from AGN and SB activity to these stacks using the flux ratios alone; in §4.1 we explore a variety of approaches to constrain the relative AGN and SB contributions using additional data.
3.2.2 Average IR fluxes and luminosities
The average IR luminosities of the stacked subsamples are calculated by taking the same approach as that used for the individual 70 µm detected sources (see §3.1.3). For those stacks with less than 3 detections we use the nominal flux ratio (rather than upper limits) when determining the closest match out of the five tracks considered; although we note that using upper limits to select the appropriate track changes the estimates of by less than 20%. In both redshift bins the nominal flux ratios of the erg s-1 and erg s-1 70 µm undetected stacks are most closely matched by the average AGN and average QSO SEDs, respectively. We note, however, that the 3 upper limits on the flux ratios of stacked erg s-1 AGNs are also consistent with the average AGN SED; see Fig. 4.
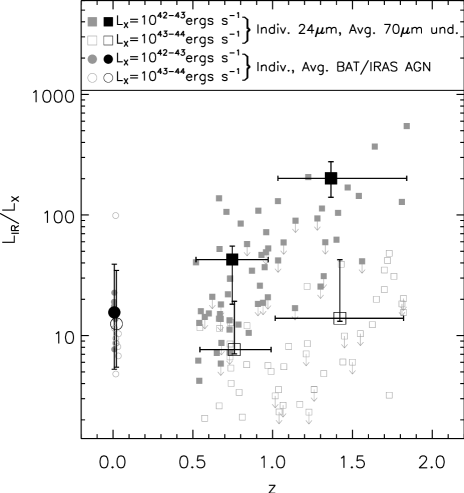
In Fig. 5 we plot the IR luminosity versus for the CDF-S X-ray sources and the BAT/IRAS sample. In the case of the erg s-1 undetected AGNs, we find that is larger by a factor of for the AGNs when compared to the AGNs (2.5 L⊙ and 5.0 L⊙, respectively), and a factor of 20 times larger than the average log(/erg s-1), BAT/IRS AGN (i.e., at ; 1.3 L⊙). This is in spite of these subsamples having almost the same average X-ray luminosities (4.9, 4.3 erg s-1and 3.7 erg s-1for , and AGNs, respectively). This difference corresponds to a factor of and increase in from to and from to , respectively (these conservative errors correspond to the full range of IR luminosities derived using all five tracks in Fig. 4). The stacked data therefore suggest that the average ratio of erg s-1 AGNs strongly evolves with redshift, as illustrated in Fig. 6. Although this result is based on stacking analyses, we show in §3.3 that we obtain the same result using 24 µm constraints for individual sources.
The 70 µm undetected stacks of the erg s-1 AGNs at both 0.5–1 and 1–2 are not significantly detected, limiting the constraints that we can place on using the 70 µm data alone; the limits are 1.5 L⊙ and 4.6 L⊙ for the AGNs at 0.5–1 and 1–2, respectively (these upper limits include the uncertainty in the – correction). However, because the upper limits on the flux ratios of these stacks provide significant constraints to the range of potential matching BAT/IRS AGN SEDs we can estimate the average IR luminosities from the stacked 24 µm flux densities to a much higher degree of accuracy than would normally be the case (to within a factor of 3, rather than 12). This reduced uncertainty is based on the fact that the flux ratios of the erg s-1 AGN stacks restricts us to AGN-dominated BAT/IRS SEDs, which all have similar – ratios. Using the stacked 24 µm flux density we obtain =5.6 L⊙ and 1.2 L⊙ for the erg s-1 AGNs in the and redshift bins, respectively, corresponding to a factor of 2 increase between these redshift ranges. For comparison, the average of erg s-1 AGNs in the BAT/IRS sample is 1.2 L⊙. Given the average X-ray luminosities of these AGNs (i.e., 3.8 erg s-1, 2.9 erg s-1 and 3.2 erg s-1 for the 0, 0.5–1 and 1–2 AGNs, respectively), we constrain the change in to a factor of between 0.5–1 and 1–2 and to a factor of between and 1–2, both of which are consistent with no evolution; see Fig. 6.
A number of recent studies have shown that the MIR emission of AGNs can be used as a good proxy for their intrinsic luminosities (e.g. Krabbe et al. 2001; Lutz et al. 2004; Maiolino et al. 2007; Horst et al. 2008). Understanding how the X-ray–MIR relationship changes with redshift would be very useful for detecting potentially heavily obscured AGNs (e.g., Daddi et al. 2007; Fiore et al. 2008; Georgantopoulos et al. 2008). However, previous X-ray–MIR studies of AGNs have been limited to extremely high luminosity sources (i.e., 3 erg s-1) at redshifts beyond . Using the results from our stacking analyses we can constrain the X-ray–MIR luminosity ratios (hereafter we focus on ) of more typical, distant AGNs found in deep, multi-wavelength surveys. At the ratios of the Average AGN and Average QSO SEDS are consistent with Lutz et al. (2004) (i.e., and , respectively)777We also note that the ratios of the Average AGN and Average QSO at are largely consistent with the relationship presented in Krabbe et al. (2001) (i.e., and , respectively).. To calculate the ratios of the CDF-S AGNs we assume the same SEDs as those used to derive their ratios (i.e., Average AGN and Average QSO for erg s-1 and erg s-1 AGNs, respectively). We therefore find that the average ratios of erg s-1 AGNs increase from at to and at and , respectively. By contrast, the average ratios of erg s-1 AGNs remain largely unchanged to (i.e., 1–2). Our data therefore suggest that deep IR observations can be used as a reliable method of identifying intrinsically bright (i.e., erg s-1), potentially Compton-thick AGNs. However, we urge caution when using either the or ratios to locate less luminous obscured AGNs (i.e., erg s-1) unless other indicators of luminous AGN activity are present (e.g., emission line spectra; see Alexander et al. 2008).
| (1) | (2) | (3) | (4) | (5) | (6) | (7) | (8) | (9) | (10) | (11) | (12) | (13) | (14) |
|---|---|---|---|---|---|---|---|---|---|---|---|---|---|
| T06 | A03 | Name | RA | Dec | flag | log() (ergs s | ( | () | Classification | ||||
| 7 | 312 | J033301.8-275818 | 53.2574 | -27.9718 | 1.840 | 0.6 | 44.64 | 3.57 | 6370 620 | 640 11 | 9.96 0.99 | 12.7 | Abs. Non-BLAGN |
| 29 | 240 | J033239.0-275701 | 53.1626 | -27.9505 | 0.300 | 0.9 | 42.98 | 5.32 | 26600 2100 | 3239 11 | 8.20 0.64 | 11.2 | Abs. Non-BLAGN |
| 31 | 230 | J033237.9-275213 | 53.1577 | -27.8704 | 1.603 | 3.0 | 44.22 | 1.79 | 3920 430 | 777.4 9.3 | 5.05 0.56 | 12.3 | Abs. Non-BLAGN |
| 31 | 230 | J033237.9-275213 | 53.1577 | -27.8704 | 1.603 | 3.0 | 44.22 | 1.79 | 3920 430 | 248.3 9.3 | 15.8 1.8 | 12.2 | Abs. Non-BLAGN |
| 36 | 204 | J033233.1-274548 | 53.1379 | -27.7634 | 1.030 | 0.5 | 43.15 | 1.73 | 4020 440 | 477 13 | 8.42 0.96 | 11.9 | Abs. Non-BLAGN |
| 44 | 173 | J033226.6-274036 | 53.1108 | -27.6767 | 1.031 | 3.0 | 43.89 | 0.08 | 8010 770 | 2107 15 | 3.80 0.37 | 12.2 | Unabs. BLAGN |
| 46 | 163 | J033225.3-274219 | 53.1052 | -27.7054 | 1.617 | 3.0 | 43.81 | 1.08 | 4580 500 | 485 13 | 9.4 1.1 | 12.6 | Abs. BLAGN |
| 51 | 118 | J033217.3-275221 | 53.0719 | -27.8728 | 1.097 | 3.0 | 44.01 | 22.42 | 4340 740 | 259.2 8.6 | 16.7 2.9 | 11.7 | Abs. Non-BLAGN |
| 52 | 117 | J033217.2-274304 | 53.0718 | -27.7178 | 0.569 | 3.0 | 42.91 | 0.04 | 30500 2300 | 1247 10 | 24.4 1.9 | 11.7 | Unabs. BLAGN |
| 56 | 88 | J033213.3-274241 | 53.0554 | -27.7115 | 0.605 | 3.0 | 43.31 | 1.62 | 9620 860 | 665 16 | 14.5 1.3 | 11.3 | Abs. Non-BLAGN |
| 69 | 38 | J033201.5-274138 | 53.0063 | -27.6941 | 0.850 | 0.4 | 43.40 | 3.20 | 1600 620 | 356.9 8.9 | 4.5 1.8 | 11.2 | Abs. Non-BLAGN |
| 72 | 30 | J033158.3-275043 | 52.9931 | -27.8453 | 1.990 | 0.5 | 44.26 | 7.77 | 3020 400 | 796.2 9.1 | 3.79 0.50 | 12.4 | Abs. Non-BLAGN |
| 77 | 311 | J033301.7-274543 | 53.2570 | -27.7620 | 0.622 | 3.0 | 42.53 | 0.44 | 5190 540 | 385.7 9.1 | 13.5 1.4 | 11.1 | Unabs. BLAGN |
| 78 | 193 | J033230.1-274524 | 53.1256 | -27.7568 | 0.960 | 3.0 | 43.06 | 0.19 | 6960 640 | 484 12 | 14.4 1.4 | 11.7 | Unabs. BLAGN |
| 98 | 260 | J033244.3-275142 | 53.1846 | -27.8618 | 0.279 | 3.0 | 41.17 | 0.02 | 91600 6700 | 7020 11 | 13.05 0.95 | 11.5 | Unabs. Starburst |
| 122 | 295 | J033257.7-274549 | 53.2404 | -27.7636 | 2.100 | 0.5 | 43.47 | 2.58 | 4030 460 | - | - | - | Abs. Non-BLAGN |
| 152 | 302 | J033259.4-274859 | 53.2476 | -27.8165 | 1.280 | 0.6 | 43.80 | 19.41 | 3620 430 | 769 11 | 4.71 0.56 | 12.0 | Abs. Non-BLAGN |
| 155 | 60 | J033208.0-274240 | 53.0335 | -27.7111 | 0.545 | 3.0 | 42.27 | 3.59 | 2880 410 | 455 10 | 6.33 0.92 | 10.9 | Abs. Non-BLAGN |
| 175 | 284 | J033252.0-274437 | 53.2165 | -27.7438 | 0.522 | 3.0 | 41.41 | 5.26 | 5770 580 | 1213 11 | 4.76 0.48 | 11.2 | Abs. Starburst |
| 206 | 109 | J033216.3-273930 | 53.0678 | -27.6586 | 1.324 | 3.0 | 44.22 | 0.13 | 5100 540 | 1376 12 | 3.71 0.39 | 12.2 | Unabs. BLAGN |
| 242 | 285 | J033251.9-274229 | 53.2164 | -27.7083 | 1.027 | 3.0 | 42.49 | 0.72 | 8150 750 | 500 11 | 16.3 1.5 | 11.9 | Unabs. Non-BLAGN |
| 253 | 131 | J033220.1-274448 | 53.0839 | -27.7467 | 1.890 | 1.9 | 44.02 | 73.51 | 3160 380 | 327.20 0.20 | 9.6 1.2 | 12.4 | Abs. Non-BLAGN |
| 268 | 278 | J033249.3-274050 | 53.2056 | -27.6806 | 1.222 | 3.0 | 44.10 | 80.44 | 4850 520 | 2127 16 | 2.28 0.25 | 12.1 | Abs. Non-BLAGN |
| 525 | 129 | J033219.9-274123 | 53.0828 | -27.6899 | 0.229 | 3.0 | 41.09 | 0.00 | 14000 1200 | 2932 17 | 4.79 0.41 | 10.7 | Unabs. Non-BLAGN |
| 538 | 65 | J033208.6-274649 | 53.0359 | -27.7803 | 0.310 | 3.0 | 41.23 | 0.51 | 12900 1100 | 973 14 | 13.2 1.1 | 10.7 | Unabs. Non-BLAGN |
| 553 | 292 | J033256.8-275318 | 53.2366 | -27.8885 | 0.366 | 3.0 | 41.27 | 0.17 | 8520 770 | 612.3 7.1 | 13.9 1.3 | 10.7 | Unabs. Starburst |
| 567 | 236 | J033238.9-274732 | 53.1620 | -27.7925 | 0.460 | 3.0 | 41.05 | 0.16 | 6370 600 | 730.9 8.9 | 8.72 0.83 | 11.1 | Unabs. Starburst |
| 575 | 115 | J033217.2-274922 | 53.0715 | -27.8230 | 0.340 | 3.0 | 41.02 | 1.90 | 3290 370 | 221.5 9.5 | 14.8 1.8 | 10.2 | Abs. Non-BLAGN |
| 577 | 224 | J033236.3-274933 | 53.1512 | -27.8258 | 0.547 | 3.0 | 41.42 | 0.14 | 10470 890 | 664 10 | 15.8 1.4 | 11.2 | Unabs. Starburst |
| 608 | 318 | J033304.0-275027 | 53.2665 | -27.8409 | 0.890 | 3.0 | 43.86 | 150.00 | 3090 410 | 578.0 9.3 | 5.34 0.71 | 11.6 | Abs. Non-BLAGN |
| 646 | 266 | J033245.2-274724 | 53.1884 | -27.7903 | 0.438 | 3.0 | 41.10 | 0.19 | 11700 1600 | 507.2 8.6 | 23.1 3.2 | 11.0 | Unabs. Starburst |
Notes: (1) Source index from Tozzi et al. (2006). (2) Source index from Alexander et al. (2003). (3) Source name. (4-5) X-ray position (J2000). (6) Source redshift. (7) Redshift flag. (8) Intrinsic (i.e., corrected for absorption) luminosity. (9) Column density in units of . (10) 70 µm flux. (11) 24 µm flux. (14) 70/24 µm flux ratio. (13) derived from the 70 µm flux using the method described in the text. (14) Classification from Bauer et al. (2004). Information in cols. (1),(3)-(9) is taken from Tozzi et al. (2006).
| (3) | (4) | (5) | (6) | (7) | (8) | ||||||||||||||
|---|---|---|---|---|---|---|---|---|---|---|---|---|---|---|---|---|---|---|---|
| (1) | (2) | Mean z | log() (ergs s-1) | Stacked () | Stacked () | ||||||||||||||
| Index | Description | All | Det. | Und. | All | Det. | Und. | All | Det. | Und. | All | Det. | Und. | All | Det. | Und. | All | Det. | Und. |
| 1 | 14 | 6 | 8 | 0.46 | 0.44 | 0.47 | 41.41 | 41.26 | 41.49 | 9960 500 | 22400 1200 | 630 110 | 736.8 | 1592.9 | 94.7 | 11.0 | 11.3 | 10.1 | |
| 2 | 25 | 3 | 22 | 0.43 | 0.29 | 0.45 | 41.60 | 41.12 | 41.64 | 1540 160 | 10070 550 | 380 170 | 235.7 | 1183.5 | 106.4 | 10.4 | 10.8 | 10.5 | |
| 3 | 12 | 0 | 12 | 3.52 | - | 3.52 | 44.31 | - | 44.31 | 280 180 | - | 280 180 | 127.5 | - | 127.5 | - | - | - | |
| 4 | 34 | 6 | 28 | 1.54 | 1.02 | 1.65 | 43.94 | 43.74 | 43.97 | 2050 150 | 10050 450 | 330 160 | 419.3 | 957.3 | 304.1 | 12.0 | 12.3 | 11.9 | |
| 5 | 32 | 3 | 29 | 0.74 | 0.72 | 0.74 | 43.10 | 42.88 | 43.12 | 2180 170 | 14200 830 | 940 170 | 301.6 | 820.2 | 247.9 | 11.2 | 11.7 | 10.9 | |
| 6 | 19 | 2 | 17 | 1.38 | 1.03 | 1.42 | 43.39 | 43.61 | 43.35 | 1230 160 | 8080 540 | 420 170 | 265.0 | 1156.6 | 160.1 | 11.7 | 12.2 | 11.7 | |
| 7 | 31 | 3 | 28 | 0.75 | 0.67 | 0.76 | 42.99 | 43.20 | 42.96 | 750 140 | 4700 380 | 330 150 | 180.0 | 494.0 | 146.3 | 10.8 | 11.4 | 10.9 | |
| 8 | 32 | 2 | 30 | 1.38 | 1.32 | 1.39 | 43.35 | 43.59 | 43.33 | 680 140 | 4300 330 | 440 150 | 174.4 | 480.3 | 154.0 | 11.4 | 12.3 | 11.7 | |
| 9 | 63 | 6 | 57 | 0.74 | 0.69 | 0.75 | 43.05 | 43.07 | 43.05 | 1440 110 | 9450 460 | 600 110 | 241.7 | 657.1 | 198.0 | 11.0 | 11.5 | 10.7 | |
| 10 | 51 | 4 | 47 | 1.38 | 1.18 | 1.40 | 43.36 | 43.60 | 43.34 | 920 110 | 6190 320 | 470 120 | 208.1 | 818.5 | 156.2 | 11.5 | 12.3 | 11.2 | |
| 11 | 44 | 3 | 41 | 0.74 | 0.58 | 0.75 | 42.63 | 42.65 | 42.63 | 1390 130 | 12850 820 | 550 130 | 167.8 | 688.3 | 129.7 | 11.0 | 11.4 | 10.7 | |
| 12 | 19 | 1 | 18 | 1.35 | 1.03 | 1.37 | 42.68 | 42.49 | 42.69 | 1110 170 | 8150 750 | 720 170 | 153.0 | 555.6 | 130.6 | 11.7 | 11.9 | 11.4 | |
| 13 | 19 | 3 | 16 | 0.77 | 0.81 | 0.76 | 43.43 | 43.28 | 43.46 | 1510 200 | 6060 410 | 660 230 | 413.1 | 625.9 | 373.2 | 11.1 | 11.8 | 11.2 | |
| 14 | 32 | 3 | 29 | 1.40 | 1.23 | 1.42 | 43.53 | 43.72 | 43.51 | 870 140 | 5540 340 | 390 150 | 240.9 | 906.1 | 172.1 | 11.5 | 12.3 | 11.7 | |
| 15 | 68 | 0 | 68 | 1.40 | - | 1.40 | 43.73 | - | 43.73 | 260 90 | - | 260 90 | 113.2 | - | 113.2 | 11.4 | - | 11.4 | |
| 16 | 68 | 10 | 58 | 1.37 | 1.00 | 1.44 | 43.75 | 43.52 | 43.78 | 1263 97 | 4420 180 | 720 110 | 285.9 | 456.9 | 256.4 | 11.7 | 11.9 | 11.5 | |
| 17 | 20 | 13 | 7 | 1.10 | 1.01 | 1.27 | 44.02 | 44.01 | 44.04 | 7040 230 | 10120 300 | 1330 320 | 1113.4 | 1199.7 | 953.0 | 12.2 | 12.3 | 11.6 | |
| 18 | 156 | 23 | 133 | 1.35 | 1.01 | 1.41 | 43.79 | 43.86 | 43.77 | 1570 66 | 7640 190 | 520 70 | 316.7 | 876.8 | 219.9 | 11.7 | 12.1 | 11.3 | |
Notes: (1) Stack index. (2) Stack description. (3) The numbers of CDF-S AGNs/SBs in each stack. (4) Mean redshift of the sources in each stack. (5) Logarithm of the mean, absorption corrected X-ray luminosity of the sources in each stack. (7) Stacked 70 µm flux density per source. (8) Stacked 24 µm flux density per source. (9) Infrared luminosity per source (over the 8-1000 µm interval), derived from the 70 µm flux density. Upper limits include the uncertainty on the – correction. We do not calculate for stack (4), AGN, as the mean redshift is beyond the range of the tracks derived from the BAT/IRS sample.
| Stacks | Avg. AGN/QSO | BAT/IRAS closest match | |||||||||
|---|---|---|---|---|---|---|---|---|---|---|---|
| 41 | 28 | 0.7 | 42.6 | 42.6 | 42.7 | 26.2 | 24.9 | 18.0 | 28.1 | 20.3 | |
| 19 | 10 | 1.4 | 42.7 | 42.6 | 201.2 | 133.3 | 112.6 | 80.2 | 164.2 | 100.2 | |
| 16 | 15 | 0.8 | 43.5 | 43.4 | 17.4 | 7.7 | 6.4 | 5.3 | 8.9 | 7.7 | |
| 30 | 19 | 1.4 | 43.5 | 43.4 | 35.1 | 13.9 | 11.4 | 7.8 | 19.9 | 14.1 | |
3.3 24 µm Properties
The results on the ratios in §3.2 were based on stacking analyses, which could be biased by a few bright 70 µm undetected sources. Since the majority of the CDF-S X-ray AGNs are individually detected at 24 µm, we can perform a complementary test of our results that does not rely significantly on stacking analyses. The advantage of this approach is that we can assess the range of for the X-ray AGNs, although there can be considerable uncertainty in the conversion between 24 µm flux density and for individual objects; see Fig. 3. However, as we show in Fig. 3, provided the average SED is not predominantly starburst dominated, then we can predict the average ratio, on the basis of the 24 µm data, to within a factor of 3; on the basis of Fig. 4, the average SEDs are AGN dominated, and would be increasingly so if the stacked 70 µm flux is dominated by bright undetected sources. Furthermore, so long as the average SEDs of the 0.5–1 AGNs are the same as the 1–2 AGNs, then we can accurately assess the relative change in between these redshifts; we provide evidence in §4.1 that this does appear to be the case. To convert from 24 µm flux densities to we use the same SEDs as assumed when calculating from the stacked 70 µm flux densities (i.e., Average AGN and Average QSO for the erg s-1 and erg s-1 AGNs, respectively; see §3.2.2). For those AGNs that are undetected at 24 µm we calculated upper limits on assuming Jy; however, we note that this assumption has a small effect on our average results (i.e., only changes by 35% even if we assume extreme upper limits of Jy). The average ratios derived from the 24 µm fluxes are given in Table 1.
We include in Fig. 6 the individual ratios calculated using the values derived from 24 µm fluxes of the 70 µm undetected AGNs in the ‘Restricted’ sample. For both the erg s-1 and erg s-1 AGNs the mean ratios increase with redshift by factors of 4.5 and 1.8, respectively. These results are in qualitative agreement with those obtained from the 70 µm stacks and indicates that the stacks are not dominated by a few extreme sources; these results are also confirmed by the median ratios presented in Table 3. However, we note that there is a factor of 2 offset between the ratios derived from the 70 µm stacks and individual 24 µm flux densities. This is caused by the difference between the flux ratios of the 70 µm undetected stacks and the assumed SEDs (see Fig. 4) and disappears if we assume the SEDs of the two individual BAT/IRS AGNs that most closely reproduce (at both redshift bins) the flux ratios of the 70 µm undetected erg s-1 and erg s-1 stacks: NGC 1275 and Mrk 290, respectively.
4 Discussion
We have provided multiple lines of evidence for an increase in the ratio for AGNs over the redshift range , with erg s-1 AGNs 5 times more infrared luminous at than at (and times more infrared luminous than at ). The evidence for an increase in for erg s-1 AGNs is less conclusive: a factor of 2 between and and no change from and .
These results provide new insight into the production of IR emission from distant AGNs and lead to a number of questions, which we address below.
4.1 What is driving the increase in ?
The ratio for the erg s-1 AGNs at is higher than that found for lower redshift X-ray AGNs; see Table 3. However, the ratio for the erg s-1 AGNs is broadly consistent with submillimeter emitting galaxies (SMGs) hosting AGN activity (250; Alexander et al. 2005). On the basis of sensitive Spitzer-IRS spectroscopy, the large ratio from AGN-hosting SMGs appears to be due to intense star-formation activity, with an average contribution to from AGN activity of 10% (e.g., Pope et al. 2008; Menéndez-Delmestre et al. 2007, 2009). Can the increase in the average ratio of the AGNs also be due to increased star-formation activity?
There is no clear relative offset between the stacked flux ratio and the AGN-dominated track for the erg s-1 AGNs over the redshift range , appearing to suggest that the relative AGN/SB contribution to has not changed with redshift. If we derive the relative AGN/SB contribution to the stacked using the average AGN and SB tracks, then we estimate 60% and 70% of the AGNs with erg s-1 have AGN-dominated SEDs at and , respectively; by comparison, the stacked of the erg s-1 AGNs suggest 100% have AGN-dominated SEDs over the full redshift range. However, since it is difficult to unambiguously determine the relative AGN/SB contribution to from the flux ratios at (see Fig. 4), this result should be considered tentative.888We note that we also find a similar fraction (%) of erg s-1 AGNs at have IRAC 3.6–8.0 µm colours suggesting AGN-dominated SEDs (based on Stern et al. 2005) as that found for erg s-1 AGNs at . This also suggests that the relative AGN/SB contribution for erg s-1 AGNs is constant with redshift but we caution that this result is based on shorter-wavelength data than used to derive . Therefore, we explore below the implication of our results assuming both an increase in star formation and AGN activity.
If the observed increase in is attributed to star-formation it would imply a significantly higher (i.e., a factor of 5) ratio between star-formation and black hole growth at compared to , and a factor of increase between and . Whether this has significant implications for the black-hole–bulge mass relationship depends on the location of the star-formation in the host galaxy and on the AGN fraction (i.e., the duty cycle of black-hole growth). For example, using Eqn. 4 of Kennicutt (1998) to derive the star-formation rate from and deriving the mass accretion rate from , we estimate that the ratio between the average star-formation and mass accretion rate is 500 in the AGNs, which is consistent with the black-hole to bulge mass ratio observed in the local universe (i.e., 800; McLure & Dunlop 2002; Marconi & Hunt 2003). This would appear to suggest a closer relationship between black-hole and stellar growth at than found at , where the average star-formation and mass accretion rate would be 100 (and 30 at ), based on the same assumptions as above. However, these different results could be reconciled if the AGN fraction is higher at higher redshifts or if the majority of the star formation at higher redshifts is occurring in the galaxy disk rather than the galaxy bulge, or vice-versa.
If, however, the increase in the ratio is due to the AGN, it would imply that a larger fraction of the intrinsic emission from the accretion disk is reprocessed by dust. This increase in the ratio may therefore be due to larger AGN dust covering factors at higher redshifts; there is tentative evidence that this is indeed the case from measurements of the obscured to unobscured ratios of AGNs in deep X-ray surveys (e.g. La Franca et al. 2005; Hasinger 2008). Results presented in Hasinger (2008) predict a factor of 2 increase in the ratio of obscured-to-unobscured AGNs between and , significantly lower than what we measure here. However, this is based on a sample of AGNs covering a broader range of than focused on here and there is evidence that any increase in the dust covering fraction will be weaker in more X-ray luminous AGNs (e.g. Ueda et al. 2003; Akylas et al. 2006; Treister et al. 2008; and supported by the reduced ratios of the erg s-1 AGNs reported here). Therefore, on the basis of the X-ray survey results, it is plausible that at least some of the increase in ratio is due to a larger dust covering factor at than seen at lower redshifts. An increase in dust-covering factor with redshift is predicted by a number of theoretical models, which suggest that AGNs undergo early growth during a hidden phase before expelling their obscuring gas and dust, revealing a luminous, unobscured quasar (Silk & Rees 1998; Springel et al. 2005; Hopkins et al. 2006).
More direct constraints on the origin of the increase in the ratio will be placed using the Herschel Space Observatory (see §4.3) and Spitzer-IRS, for the fraction of X-ray AGNs that have Spitzer-IRS data (J. R. Mullaney, in preparation).

4.2 What is the contribution of AGNs to the cosmic IR background?
We can use the results of our stacking analysis to place constraints on the AGN contribution to the 70 µm background. If we stack all of the 251 X-ray AGNs, irrespective of whether they are individually detected at 70 µm we obtain an average 70 µm flux density of 104080 Jy, and therefore an integrated 70 µm flux density of 26020 mJy, over the 391.3 arcmin2 of the CDF-S field. On the basis of the analysis of the IR background in both GOODS fields and the Lockman Hole (e.g., Dole et al. 2006), this corresponds to 5% of the average resolved 70 µm background. This constraint is a lower limit since (1) the X-ray observations will not have identified the most heavily obscured luminous AGNs in this field, (2) the 70 µm field is too small to include X-ray bright AGNs, and (3) the X-ray observations are not sensitive to the lowest-luminosity AGNs.
On the basis of Tozzi et al. (2006), we would predict 80% of erg s-1, AGNs in the CDF-S (i.e., to 5) to be X-ray undetected. If we assume that they have the same IR SED as the X-ray detected AGNs then they increase our estimate of the resolved 70 µm background by a factor of five to 25%; from a study of nearby sources, Lutz et al. (2004) finds that the IR emission of AGNs is not significantly depressed in the most heavily obscured sources (we confirm that this is also the case for the BAT/IRS sample). Since X-ray surveys are insensitive to the most heavily obscured AGNs (i.e., Compton-thick sources with cm-2), the overall contribution to the 70 µm background could potentially double to % (e.g., Daddi et al. 2007; Alexander et al. 2008).
To estimate the contribution to the 70 µm background from bright AGNs that are too rare to lie in the small CDF-S field would require the same analyses as performed here to be made on a shallower survey that covers a larger area of the sky. As it stands, the most accurate 70 µm analysis in a larger field is that of Papovich et al. (2007) of the E-CDFS. They find that bright AGNs (i.e., erg s-1) contribute only 7 to the IR background at 70 µm, corresponding to an insignificant fraction (%) of the total IR background at this wavelength. However, the E-CDFS field is not a great deal larger than the CDF-S field and a full study of the contribution of X-ray bright AGNs to the IR background will require the analysis of the much larger COSMOS999URL: http://cosmos.astro.caltech.edu/ and/or Bootes101010URL: http://www.lsstmail.org/noao/noaodeep/ fields at 70 µm.
4.3 What advances may we expect for deep surveys with Herschel?
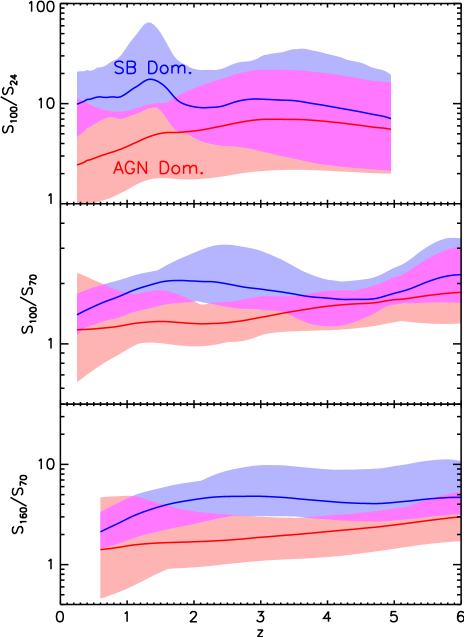
Our study of the FIR properties of X-ray detected AGNs allows us to place constraints on the properties of AGNs detected in deep Herschel fields at µm. We anticipate that the improved sensitivity of the Herschel-PACS instrument over Spitzer-MIPS will result in a significant increase in the fractions of X-ray AGNs that will be detected at FIR wavelengths, which will provide more direct insight into the processes driving the increase in at . Depending on the assumed SED we predict that approximately 45-60%, 50-70%, 50-65% and 45-65% of the CDF-S X-ray sources at , and , respectively, will be detected at 100 µm in the proposed ultradeep HGOODS survey (limiting flux = 0.6 mJy; see Fig. 7). These estimated detection levels are calculated by extrapolating the 24 µm flux densities along the Average SB-dominated and Average AGN-dominated SEDs (derived from the BAT/IRS sample).
In Fig. 8 we present the results of passing the IR spectra of the BAT/IRS sample through the various PACS filter response curves. Our analysis shows that, although the flux ratio will not push our constraints on the relative contributions from AGN activity and star formation to higher redshifts (due to the influence of the MIR spectral features that shift into the observed 24 µm band at high redshifts), the and flux ratios will “take over” and provide this information out to a redshift of (i.e., the redshift of the most distant AGNs currently detected in the deepest X-ray surveys). Deep, infrared observations undertaken by Herschel will therefore provide a method of identifying a significant proportion of the long sought after population of Compton-thick AGNs out to 6.
5 Summary
We have investigated the MIR and FIR properties of X-ray detected AGNs and SBs in the CDF-S using deep 24 µm and 70 µm observations undertaken by the Spitzer Space Telescope as part of the GOODS and FIDEL legacy surveys. Out of the 266 X-ray AGNs/SBs, 30 (11%) and 172 (65%) have counterparts at 70 µm and 24 µm respectively, with a bias towards the detection of SBs and BLAGNs at 70 µm. As the majority of CDF-S X-ray AGNs are undetected at 70 µm we rely on stacking analysis to measure their average MIR and FIR properties. We compare the IR properties of the CDF-S AGNs/SBs with those of a sample of local AGNs that have X-ray properties (i.e., and ) covering the same range as the CDF-S AGNs (i.e., the BAT/IRS sample). In the following points we summarise the main conclusions of this study:
-
1.
We find strong evidence at both 24 µm and 70 µm that the average infrared luminosity of erg s-1 AGNs at is significantly higher than those at and (i.e., by a factor of and , respectively). This difference corresponds to a factor of and increase in /, respectively. This large increase in is not, however, seen for AGNs with higher X-ray luminosities (i.e., erg s-1). We therefore argue that deep IR observations can be used as a reliable method to identify intrinsically bright (i.e.., erg s-1) Compton-thick AGNs, but urge caution when using this ratio to locate less luminous obscured AGNs (i.e., erg s-1), unless other indicators of AGN activity are present.
-
2.
Due to the low numbers of AGNs detected at 70 µm we are unable to establish what process is driving this increase in the average ; however, both increased star-formation and/or increased AGN dust covering factors are likely candidates. If the former, then the epoch may represent a period of rapid growth of the bulge to black hole mass ratio. However, there is tentative evidence from X-ray observations that the dust covering fraction is, indeed, higher at large redshifts. We predict that forthcoming deep surveys to be carried out by the Herschel Space Observatory will enable us to resolve what process is driving the increase in . See sections 3.2.2, 3.3, 4.1.
-
3.
On average, more X-ray luminous CDF-S AGNs have lower flux ratios. Based on the infrared properties of a sample of local AGNs with similar X-ray properties (i.e., and ), we conclude that more X-ray luminous CDF-S AGNs have IR SEDs that are more AGN-dominated (rather than SB dominated). See section 3.2.1.
-
4.
Despite measuring a large increase in among AGNs (see point 1 above), we find that the X-ray detected AGNs in the CDF-S contribute only 5% of the 70 µm background. However, if we extrapolate this fraction to take into account those 80% of AGNs that are undetected in X-rays, we estimate that 25% of the 70 µm background is attributable to AGNs. See section 4.2.
-
5.
We anticipate that the undertaking of deep, FIR surveys by the Herschel Space Observatory will allow us to detect between 40% and 75% of the X-ray detected AGNs in the 1 Ms CDF-S, depending on whether the infrared SEDs are predominantly AGN or SB-dominated, respectively. Furthermore, the FIR diagnostics used in our analysis can be directly applied to the PACS filters on board Herschel to enable us to discriminate between AGNs with SB-dominated or AGN-dominated infrared SEDs. See section 4.3.
acknowledgements
We would like to thank David Elbaz for his useful comments on the paper and for providing us with the PACS filter response curves. We would also like to thank Chris Done for her useful comments on the bolometric luminosities of X-ray detected AGNs. Furthermore, we would like to thank the anonymous referee for their comments, particularly those concerning the X-ray to IR matching procedure. This work is based (in part) on observations made with the Spitzer Space Telescope and has made use of the NASA/ IPAC Infrared Science Archive, which are both operated by the Jet Propulsion Laboratory, California Institute of Technology under a contract with NASA. Support for this work was provided by NASA through an award issued by JPL/Caltech. We gratefully acknowledge support from the Leverhulme Trust (JRM; DMA) and the Royal Society (DMA).
References
- Akylas et al. (2006) Akylas A., Georgantopoulos I., Georgakakis A., Kitsionas S., Hatziminaoglou E., 2006, A&A, 459, 693
- Alexander et al. (2003) Alexander D. M., Bauer F. E., Brandt W. N., Schneider D. P., Hornschemeier A. E., Vignali C., Barger A. J., Broos P. S., Cowie L. L., Garmire G. P., Townsley L. K., Bautz M. W., Chartas G., Sargent W. L. W., 2003, AJ, 126, 539
- Alexander et al. (2005) Alexander D. M., Bauer F. E., Chapman S. C., Smail I., Blain A. W., Brandt W. N., Ivison R. J., 2005, ApJ, 632, 736
- Alexander et al. (2001) Alexander D. M., Brandt W. N., Hornschemeier A. E., Garmire G. P., Schneider D. P., Bauer F. E., Griffiths R. E., 2001, AJ, 122, 2156
- Alexander et al. (2008) Alexander D. M., Chary R.-R., Pope A., Bauer F. E., Brandt W. N., Daddi E., Dickinson M., Elbaz D., Reddy N. A., 2008, ApJ, 687, 835
- Antonucci (1993) Antonucci R., 1993, ARA&A, 31, 473
- Antonucci & Miller (1985) Antonucci R. R. J., Miller J. S., 1985, ApJ, 297, 621
- Barger et al. (2003) Barger A. J., Cowie L. L., Capak P., Alexander D. M., Bauer F. E., Fernandez E., Brandt W. N., Garmire G. P., Hornschemeier A. E., 2003, AJ, 126, 632
- Bassani et al. (1999) Bassani L., Dadina M., Maiolino R., Salvati M., Risaliti G., della Ceca R., Matt G., Zamorani G., 1999, ApJS, 121, 473
- Bauer et al. (2004) Bauer F. E., Alexander D. M., Brandt W. N., Schneider D. P., Treister E., Hornschemeier A. E., Garmire G. P., 2004, AJ, 128, 2048
- Benson et al. (2003) Benson A. J., Bower R. G., Frenk C. S., Lacey C. G., Baugh C. M., Cole S., 2003, ApJ, 599, 38
- Booth & Schaye (2009) Booth C. M., Schaye J., 2009, ArXiv e-prints, 0904.2572
- Bower et al. (2006) Bower R. G., Benson A. J., Malbon R., Helly J. C., Frenk C. S., Baugh C. M., Cole S., Lacey C. G., 2006, MNRAS, 370, 645
- Brandl et al. (2006) Brandl B. R., Bernard-Salas J., Spoon H. W. W., Devost D., Sloan G. C., Guilles S., Wu Y., Houck J. R., Weedman D. W., Armus L., Appleton P. N., Soifer B. T., Charmandaris V., Hao L., Higdon J. A. M. S. J., Herter T. L., 2006, ApJ, 653, 1129
- Brandt & Hasinger (2005) Brandt W. N., Hasinger G., 2005, ARA&A, 43, 827
- Daddi et al. (2007) Daddi E., Alexander D. M., Dickinson M., Gilli R., Renzini A., Elbaz D., Cimatti A., Chary R., Frayer D., Bauer F. E., Brandt W. N., Giavalisco M., Grogin N. A., Huynh M., Kurk J., Mignoli M., Morrison G., Pope A., Ravindranath S., 2007, ApJ, 670, 173
- Dole et al. (2006) Dole H., Lagache G., Puget J.-L., Caputi K. I., Fernández-Conde N., Le Floc’h E., Papovich C., Pérez-González P. G., Rieke G. H., Blaylock M., 2006, A&A, 451, 417
- Donley et al. (2007) Donley J. L., Rieke G. H., Pérez-González P. G., Rigby J. R., Alonso-Herrero A., 2007, ApJ, 660, 167
- Downes et al. (1986) Downes A. J. B., Peacock J. A., Savage A., Carrie D. R., 1986, MNRAS, 218, 31
- Dwelly & Page (2006) Dwelly T., Page M. J., 2006, MNRAS, 372, 1755
- Elvis et al. (1994) Elvis M., Wilkes B. J., McDowell J. C., Green R. F., Bechtold J., Willner S. P., Oey M. S., Polomski E., Cutri R., 1994, ApJS, 95, 1
- Fiore et al. (2008) Fiore F., Grazian A., Santini P., Puccetti S., Brusa M., Feruglio C., Fontana A., Giallongo E., Comastri A., Gruppioni C., Pozzi F., Zamorani G., Vignali C., 2008, ApJ, 672, 94
- Frayer et al. (2006) Frayer D. T., Huynh M. T., Chary R., Dickinson M., Elbaz D., Fadda D., Surace J. A., Teplitz H. I., Yan L., Mobasher B., 2006, ApJL, 647, L9
- Gebhardt et al. (2000) Gebhardt K., Bender R., Bower G., Dressler A., Faber S. M., Filippenko A. V., Green R., Grillmair C., Ho L. C., Kormendy J., Lauer T. R., Magorrian J., Pinkney J., Richstone D., Tremaine S., 2000, ApJL, 539, L13
- Genzel et al. (1998) Genzel R., Lutz D., Sturm E., Egami E., Kunze D., Moorwood A. F. M., Rigopoulou D., Spoon H. W. W., Sternberg A., Tacconi-Garman L. E., Tacconi L., Thatte N., 1998, ApJ, 498, 579
- Georgantopoulos et al. (2008) Georgantopoulos I., Georgakakis A., Rowan-Robinson M., Rovilos E., 2008, A&A, 484, 671
- Giacconi et al. (2002) Giacconi R., Zirm A., Wang J., Rosati P., Nonino M., Tozzi P., Gilli R., Mainieri V., Hasinger G., Kewley L., Bergeron J., Borgani S., Gilmozzi R., Grogin N., Koekemoer A., Schreier E., Zheng W., Norman C., 2002, ApJS, 139, 369
- Granato et al. (2004) Granato G. L., De Zotti G., Silva L., Bressan A., Danese L., 2004, ApJ, 600, 580
- Guainazzi et al. (2005) Guainazzi M., Matt G., Perola G. C., 2005, A&A, 444, 119
- Hasinger (2008) Hasinger G., 2008, A&A, 490, 905
- Hopkins et al. (2006) Hopkins P. F., Hernquist L., Cox T. J., Di Matteo T., Robertson B., Springel V., 2006, ApJS, 163, 1
- Horst et al. (2008) Horst H., Gandhi P., Smette A., Duschl W. J., 2008, A&A, 479, 389
- Huynh et al. (2007) Huynh M. T., Pope A., Frayer D. T., Scott D., 2007, ApJ, 659, 305
- Kauffmann & Haehnelt (2000) Kauffmann G., Haehnelt M., 2000, MNRAS, 311, 576
- Kennicutt (1998) Kennicutt Jr. R. C., 1998, ARA&A, 36, 189
- Krabbe et al. (2001) Krabbe A., Böker T., Maiolino R., 2001, ApJ, 557, 626
- Krolik & Begelman (1988) Krolik J. H., Begelman M. C., 1988, ApJ, 329, 702
- La Franca et al. (2005) La Franca F., Fiore F., Comastri A., Perola G. C., Sacchi N., Brusa M., Cocchia F., Feruglio C., Matt G., Vignali C., Carangelo N., Ciliegi P., Lamastra A., Maiolino R., Mignoli M., Molendi S., Puccetti S., 2005, ApJ, 635, 864
- Lehmer et al. (2005) Lehmer et al. B. D., 2005, ApJS, 161, 21
- Luo et al. (2008) Luo et al. B., 2008, ApJS, 179, 19
- Lutz et al. (2004) Lutz D., Maiolino R., Spoon H. W. W., Moorwood A. F. M., 2004, A&A, 418, 465
- Magnelli et al. (2009) Magnelli B., Elbaz D., Chary R. R., Dickinson M., Le Borgne D., Frayer D. T., Willmer C. N. A., 2009, ArXiv e-prints
- Magorrian et al. (1998) Magorrian J., Tremaine S., Richstone D., Bender R., Bower G., Dressler A., Faber S. M., Gebhardt K., Green R., Grillmair C., Kormendy J., Lauer T., 1998, AJ, 115, 2285
- Mainieri et al. (2002) Mainieri V., Bergeron J., Hasinger G., Lehmann I., Rosati P., Schmidt M., Szokoly G., Della Ceca R., 2002, A&A, 393, 425
- Mainieri et al. (2005) Mainieri V., Rosati P., Tozzi P., Bergeron J., Gilli R., Hasinger G., Nonino M., Lehmann I., Alexander D. M., Idzi R., Koekemoer A. M., Norman C., Szokoly G., Zheng W., 2005, A&A, 437, 805
- Maiolino et al. (2007) Maiolino R., Shemmer O., Imanishi M., Netzer H., Oliva E., Lutz D., Sturm E., 2007, A&A, 468, 979
- Malizia et al. (2003) Malizia A., Bassani L., Stephen J. B., Di Cocco G., Fiore F., Dean A. J., 2003, ApJL, 589, L17
- Marconi & Hunt (2003) Marconi A., Hunt L. K., 2003, ApJL, 589, L21
- McLure & Dunlop (2002) McLure R. J., Dunlop J. S., 2002, MNRAS, 331, 795
- Menéndez-Delmestre et al. (2007) Menéndez-Delmestre K., Blain A. W., Alexander D. M., Smail I., Armus L., Chapman S. C., Frayer D. T., Ivison R. J., Teplitz H. I., 2007, ApJL, 655, L65
- Menéndez-Delmestre et al. (2009) Menéndez-Delmestre K., Blain A. W., Smail I., M. Alexander D., Chapman S. C., Armus L., Frayer D., Ivison R. J., Teplitz H., 2009, ApJ, 699, 667
- Mushotzky et al. (1993) Mushotzky R. F., Done C., Pounds K. A., 1993, ARA&A, 31, 717
- Papovich et al. (2007) Papovich C., Rudnick G., Le Floc’h E., van Dokkum P. G., Rieke G. H., Taylor E. N., Armus L., Gawiser E., Huang J., Marcillac D., Franx M., 2007, ApJ, 668, 45
- Pope et al. (2008) Pope A., Chary R.-R., Alexander D. M., Armus L., Dickinson M., Elbaz D., Frayer D., Scott D., Teplitz H., 2008, ApJ, 675, 1171
- Pope et al. (2006) Pope A., Scott D., Dickinson M., Chary R.-R., Morrison G., Borys C., Sajina A., Alexander D. M., Daddi E., Frayer D., MacDonald E., Stern D., 2006, MNRAS, 370, 1185
- Richards et al. (2006) Richards G. T., Lacy M., Storrie-Lombardi L. J., Hall P. B., Gallagher S. C., Hines D. C., Fan X., Papovich C., Vanden Berk D. E., Trammell G. B., Schneider D. P., Vestergaard M., York D. G., Jester S., Anderson S. F., Budavári T., Szalay A. S., 2006, ApJS, 166, 470
- Sanders & Mirabel (1996) Sanders D. B., Mirabel I. F., 1996, ARA&A, 34, 749
- Silk & Rees (1998) Silk J., Rees M. J., 1998, A&A, 331, L1
- Springel et al. (2005) Springel V., Di Matteo T., Hernquist L., 2005, MNRAS, 361, 776
- Stern et al. (2005) Stern D., Eisenhardt P., Gorjian V., Kochanek C. S., Caldwell N., Eisenstein D., Brodwin M., Brown M. J. I., Cool R., Dey A., Green P., Jannuzi B. T., Murray S. S., Pahre M. A., Willner S. P., 2005, ApJ, 631, 163
- Szokoly et al. (2004) Szokoly G. P., Bergeron J., Hasinger G., Lehmann I., Kewley L., Mainieri V., Nonino M., Rosati P., Giacconi R., Gilli R., Gilmozzi R., Norman C., Romaniello M., Schreier E., Tozzi P., Wang J. X., Zheng W., Zirm A., 2004, ApJS, 155, 271
- Tajer et al. (2007) Tajer et al. M., 2007, A&A, 467, 73
- Tozzi et al. (2006) Tozzi P., Gilli R., Mainieri V., Norman C., Risaliti G., Rosati P., Bergeron J., Borgani S., Giacconi R., Hasinger G., Nonino M., Streblyanska A., Szokoly G., Wang J. X., Zheng W., 2006, A&A, 451, 457
- Treister et al. (2008) Treister E., Krolik J. H., Dullemond C., 2008, ApJ, 679, 140
- Tremaine et al. (2002) Tremaine S., Gebhardt K., Bender R., Bower G., Dressler A., Faber S. M., Filippenko A. V., Green R., Grillmair C., Ho L. C., Kormendy J., Lauer T. R., Magorrian J., Pinkney J., Richstone D., 2002, ApJ, 574, 740
- Tueller et al. (2008) Tueller J., Mushotzky R. F., Barthelmy S., Cannizzo J. K., Gehrels N., Markwardt C. B., Skinner G. K., Winter L. M., 2008, ApJ, 681, 113
- Ueda et al. (2003) Ueda Y., Akiyama M., Ohta K., Miyaji T., 2003, ApJ, 598, 886
- Winter et al. (2009) Winter L. M., Mushotzky R. F., Reynolds C. S., Tueller J., 2009, ApJ, 690, 1322
Appendix A The Swift-BAT Comparison Sample
To aid in the interpretation of the Spitzer MIPS data used to characterise the CDF-S X-ray sample, we selected a local sample of AGNs from the Swift-BAT survey with Spitzer-IRS low-resolution spectroscopy (5.2–38 µm). The Spitzer-IRS data allows us to accurately distinguish between AGNs with AGN-dominated and SB-dominated IR SEDs on the basis of the MIR spectral features in the Swift-BAT AGNs. The Swift-BAT survey provides the ideal local AGN comparison sample since the sensitivity of the BAT telescope to hard X-ray photons (14–195 keV) provides an almost absorption-independent selection of AGNs (to ). Indeed, the range of X-ray luminosities and absorbing column densities of the Swift-BAT AGNs are comparable to those of the CDF-S AGNs (see Tueller et al. 2008 and Winter et al. 2009); see §2.2.1.

Thirty-six of the 104 Swift-BAT AGNs with good-quality and constraints from Winter et al. (2009) or Bassani et al. (1999) have both Short-Low (SL; 3.6” x 136.0”; 60–127) and Long-Low (LL; 10.5” x 360”; 57–126) Spitzer-IRS spectroscopy, providing full coverage at 5.2–38 µm. All 36 BAT/IRS AGNs were observed in staring-mode with two nod positions, which are required for background subtraction. Basic Calibrated Data (BCD) images were combined and cleaned as described in Goulding & Alexander (2009). Differing nod positions were subtracted from each other to produce background subtracted images before extracting the spectra using spice111111URL: http://ssc.spitzer.caltech.edu/postbcd/spice.html. The objects were sufficiently bright and the observations were sufficiently short that there was no significant effect from latent charge build-up on the detector. Long-slit orders were clipped using the wavelength trim ranges given in Table 5.1 of the Spitzer-IRS Observers manual121212The Spitzer-IRS Observers Manual is available at http://ssc.spitzer.caltech.edu/irs/dh/. The continuum of each source in every order was fitted using a first or second-order polynomial. The spectra were then matched to give a single continuous spectrum for each source. Flux calibration was carried out using the latest available Spitzer-IRS calibration files (version 17.2) and is largely consistent with archival IRAS 25 µm flux densities (to within a factor of 2.5 in 97% of cases). The BAT/IRS AGNs have absorption corrected 2-10 keV luminosities spanning 4.3 erg s-1 to 1.9 erg s-1 and absorbing column densities in the range 2.5 to 2.2 (i.e., roughly the same as those CDF-S X-ray AGN/SBs with and measurements published in Tozzi et al. 2006).

To determine whether the flux ratio can distinguish between SB and AGN dominated systems, we classified the BAT/IRS sample into those objects with a) a prominent PAH feature at 6.2 µm, which we assume is a good indicator of a strong starburst component (SB-dominated; e.g., Genzel et al. 1998; 11 objects), and b) a power-law MIR to FIR continuum with no sign of any PAH feature at 6.2 µm, which we assume indicates an AGN-dominated object (25 objects). The 6.2 µm PAH feature is preferred over other lines as it lies in a region of the IR spectrum that is largely free of other strong spectral features, in particular the silicate absorption/emission band at 9.7 µm. We show the Spitzer-IRS spectra of the BAT/IRS sample in Fig. A1 (AGN-dominated systems) and Fig. A2 (SB-dominated systems).
To calculate the expected flux ratio tracks each of for the 36 BAT/IRS AGNs as a function of redshift, we shift each spectrum by a factor of in wavelength (where is increased from 0.25 to 2.5 in steps of 0.025) and pass the resulting spectrum through the MIPS 24 µm and 70 µm filters. To determine the observed 70 µm fluxes at requires knowledge of the IR SED beyond the wavelength coverage of the Spitzer-IRS spectra (i.e., µm). To provide this longer wavelength coverage, we extrapolated the longest wavelength bin of the IRS spectra to the 60 µm and 100 µm flux densities from the IRAS Point Source and Faint Source Catalogues131313Available from: http://irsa.ipac.caltech.edu/applications/Gator/index.html. Thirty-two of the 36 AGNs with IRS data have well constrained IRAS 60 µm and 100 µm fluxes. The remaining 4 (all classed as AGN dominated) have IRAS 60 µm or 100 µm flux densities that are flagged as upper limits in the IRAS catalogues. However, including these faint sources in our average AGN SED by assuming the upper limits as detections has no effect on any of our results. In Fig. 11, we show the flux ratios derived from the BAT/IRS sample as a function of redshift. There is a clear separation between AGN and SB dominated systems at , showing that the flux ratio can be used as an efficient method to determine whether AGN or star-formation activity dominates the IR emission of X-ray detected AGNs.
Calculating for high redshift sources using the 24 µm flux density alone is susceptible to systematic errors caused by spectral features that are redshifted into this waveband at . We can use the BAT/IRS sample to establish the uncertainties in deriving from either 70 µm or 24 µm data. In the lower panels of Fig. 11 we show the expected observed frame 70 µm and 24 µm fluxes for the BAT/IRS sample, if observed at z=0.25-2.5 and normalised to L⊙ (the normalisation factor, L⊙/, is derived by calculating from the IRAS flux densities using the equations presented in Table 1 of Sanders & Mirabel 1996). Depending on the shape of the IR SED, sources of the same can differ in their observed 24 µm flux density by up to a factor of 12 at , compared to factor of only 3 at 70 µm. This range of 70 µm flux density is almost independent of redshift out to , indicating that is up 4 times more accurate for determining when no information on the SED shape is available.