Study of sdO models. Pulsation Analysis
Abstract
We have explored the possibility of driving pulsation modes in models of sdO stars in which the effects of element diffusion, gravitational settling and radiative levitation have been neglected so that the distribution of iron-peak elements remains uniform throughout the evolution. The stability of these models was determined using a non-adiabatic oscillations code. We analysed 27 sdO models from 16 different evolutionary sequences and discovered the first ever sdO models capable of driving high-radial order g-modes. In one model, the driving is by a classical -mechanism due to the opacity bump from iron-peak elements at temperature K. In a second model, the driving result from the combined action of -mechanisms operating in three distinct regions of the star: (i) a carbon-oxygen partial ionization zone at temperature K, (ii) a deeper region at temperature K, which we attribute to ionization of argon, and (iii) at the transition from radiative to conductive opacity in the core of the star.
keywords:
stars: oscillations – stars: variables: other1 Introduction
Hot subluminous O-stars (hereafter sdOs) are evolved objects on the way to becoming low-mass white dwarfs. Most sdOs are thought to have an inert carbon-oxygen core, with the luminosity provided by helium and hydrogen burning shells. The wide ranges of surface parameters, from 40 to 100 kK for effective temperature () and 4.0 to 6.5 for surface gravity (), spreads sdOs across a broad region in the HR diagram, that is crossed by post Asymptotic Giant Branch (post-AGB), post Red Giant Branch (post-RGB) and post Extended Horizontal Branch (post EHB) single star evolutionary tracks. This degeneracy in evolutionary paths plus possible binary star formation scenarios hampers reliable determination of sdO origins. This situation is not helped by the wide variety in sdO spectra: While they share a common characteristic of a He II 4686Å line, a diversity of lines with different strengths of He I, He II and sometimes H are possible, rendering spectral classification an open issue (Jeffery et al. 1997; Ströer et al. 2007).
The spectral analysis and determination of physical parameters has the drawback of requiring the use of non-LTE atmospheric codes due to high effective temperatures, which yielded disagreements in the largest existent studies (Dreizler et al. 1990; Thejll et al. 1994) until recently. Recent analyses of 130 sdOs by Ströer et al. (2007) and Hirsch & Heber (2008) showed that they segregate into two main groups regarding helium content: (1) helium-deficient sdOs with subsolar He abundances, no traces of carbon or nitrogen and a large spread in and , and (2) helium-enriched sdOs with supersolar He abundances and C and/or N lines present, spreading between 40-50 kK in and 5.5 to 6 in . Group (1) sdOs are classified as post-EHB descendants of hot subdwarf B-stars (hereafter sdBs). To explain the origins of group (2) sdOs, the authors invoke different channels: (i) merger of two helium white dwarfs formed by binary evolution (Webbink 1984; Han et al. 2002), which explains the He enrichment, but does not quite reproduce the observed - distribution, (ii) non-canonical evolution of a single star that experiences a phase of mixing from the H-shell into the envelope while on the RGB (Sweigart, 1997) and (iii) evolution of a RGB star whose envelope is almost completely stripped by Roche-lobe overflow in a binary, pre-emptying the He - core flash (Driebe et al., 1999). This last scenario has problems in explaining the observed metal enrichment. (See Ströer et al. (2007) and references therein for a thorough review of sdO formation mechanisms).
Another way to attack the problem of untangling the different evolutionary scenarios proposed for sdOs, and in which this paper focuses, is the use of asteroseismological methods (provided, of course, that sdOs are pulsating stars). Asteroseismological analysis can yield information such as the mass of the star, envelope, and inner structure through the Brunt-Väisälä frequency and/or sound speed, as long as we can identify the oscillation modes present in the star.
The first theoretical exploration of the potential of sdOs as pulsators was carried out by Charpinet et al. (1997a). The stability analysis of full stellar sdO models corresponding to seven evolutionary sequences starting on the EHB found all sdO models stable.
The previous year, Charpinet et al. (1996) had theoretically predicted the pulsator behaviour of sdBs due to a -mechanism caused by iron enhancement in the envelope of the star. Since the observational confirmation of the first pulsating sdB star by Kilkenny et al. (1997), we now know of about forty of these stars (Oreiro et al., 2009) termed V361 Hya, or more commonly EC 14026 stars, which coexist in the same area of the HR diagram with non-pulsating sdBs. They cluster in at 33 000 K and 5.8 dex and show oscillations with typical periods in the range 80–200 s, which have been identified with low-degree and low-radial order p-modes. Today, the sdB variable stars also include the long period pulsators V1093 Her (Green et al., 2003) also excited by the same mechanism (Fontaine et al., 2003), a handful of hybrid pulsators (e.g. Oreiro et al. 2005) and a unique He-sdB star (Ahmad & Jeffery, 2005). For more details on sdB stars we refer the reader to the excellent review by Østensen (2009).
The goal of the present work is to complete the observational search for sdO pulsators (Rodríguez-López, Ulla & Garrido 2007; Rodríguez-López et al. 2005; Rodríguez-López et al. 2004) that proceeded in the period 2003–2006, and which has yielded non-conclusive results. The thrilling discovery of the first sdO pulsator, SDSS J160043.6+074802.9, (abbreviated J1600+0748) by a team of South African astronomers (Woudt et al., 2006), gave real support to our theoretical exercise. The recent discovery of p-mode oscillations in sdO models that included radiative levitation of iron (Fontaine et al., 2008) is able to account for the the very fast multiperiodic oscillations observed in the range 60 to 120 s, hence establishing the same iron opacity mechanism found in sdB stars as responsible for sdO oscillations, and reinforcing the conclusion that radiative levitation and gravitational settling are two key ingredients in driving pulsations (Charpinet et al. 1997b; Charpinet, Fontaine & Brassard 2009).

Our aim is to investigate the possibility of driving pulsation modes in theoretical models of sdO stars – coming from fully evolutionary sequences– with the aid of a non-adiabatic oscillations code. Thus, sdO models were specifically built using the evolutionary code JMSTAR (Lawlor & MacDonald 2006 and references therein). The code was used to further evolve these sdO models to more advanced state of evolution, providing the tracks taken in the HR diagram. The sdO models are used as input to the GraCo non-adiabatic oscillations code (Moya, Garrido & Dupret 2004; Moya & Garrido 2008), which predicts which oscillation modes of the models are excited.
The paper is structured as follows: In Section 2 we give some general remarks about the evolution code, the structural models and the non-adiabatic oscillations code. Section 3 briefly describes the non-adiabatic stability analysis carried on the sdO models. Sections 4, 5 and 6 describe the analysis for the most interesting models found. We summarise all the analysed models in Section 7, and the discussion and conclusions in Section 8.
2 The tools
2.1 The evolution code and the sdO models
To have accurate theoretical models of sdO stars is of great importance in the subsequent pulsation analysis. The distribution of the thermodynamical quantities, such as pressure, temperature, density, and the chemical composition in the interior of the star, will determine the theoretical spectrum of modes computed by the non-adiabatic oscillations code.
| Model number | M | X(H) | X(He3) | X(He4) | X(C) | X(N) | X(O) | X(other) | Z | |||
|---|---|---|---|---|---|---|---|---|---|---|---|---|
| & name | (K) | (M⊙) | ||||||||||
| 1 p675_8057 | 79 000 | 5.70 | 0.478 | 0.675 | 0.21 | 6.1E-05 | 0.72 | 3.4E-02 | 1.0E-02 | 5.2E-03 | 1.7E-02 | 0.07 (0.02) |
| 1.1 p675_9065 | 90 000 | 6.50 | 0.478 | 0.675 | 0.20 | 5.4E-05 | 0.73 | 3.5E-02 | 1.0E-02 | 5.1E-03 | 1.7E-02 | 0.07 (0.02) |
| 2 p650_7960 | 79 000 | 5.95 | 0.491 | 0.650 | 0.68 | 2.4E-04 | 0.30 | 3.0E-03 | 1.7E-03 | 1.0E-02 | 5.3E-03 | 0.02 |
| 3 etap 685 | 55 000 | 5.89 | 0.471 | 0.685 | 0.43 | 1.4E-04 | 0.55 | 9.6E-04 | 8.1E-03 | 5.6E-03 | 5.3E-03 | 0.02 |
| 4 etap 690 | 55 000 | 5.95 | 0.471 | 0.690 | 0.33 | 4.5E-05 | 0.65 | 6.3E-04 | 1.0E-02 | 4.0E-03 | 5.3E-03 | 0.02 |
| 5 etap 695 | 55 200 | 5.98 | 0.471 | 0.695 | 0.27 | 2.8E-05 | 0.71 | 9.0E-04 | 1.1E-02 | 3.2E-03 | 5.4E-03 | 0.02 |
| 6 etap 700 | 55 000 | 6.02 | 0.470 | 0.700 | 0.18 | 5.6E-05 | 0.78 | 1.5E-02 | 7.8E-03 | 2.6E-03 | 9.8E-03 | 0.04 (0.02) |
| 7 eta 600t45 | 45 000 | 4.95 | 0.497 | 0.600 | 0.59 | 2.5E-04 | 0.36 | 7.3E-03 | 4.2E-03 | 2.4E-02 | 1.5E-02 | 0.05 |
| 7.1 eta 600t70 | 70 000 | 5.95 | 0.497 | 0.600 | 0.59 | 1.9E-04 | 0.35 | 7.3E-03 | 4.3E-03 | 2.4E-02 | 1.5E-02 | 0.05 |
| 8 eta 650t45 | 45 000 | 5.26 | 0.469 | 0.650 | 0.59 | 1.2E-03 | 0.35 | 7.4E-03 | 4.2E-03 | 2.4E-02 | 1.5E-02 | 0.05 |
| 8.1 eta 650t70 | 70 000 | 6.22 | 0.468 | 0.650 | 0.59 | 1.1E-03 | 0.36 | 7.4E-03 | 4.2E-03 | 2.4E-02 | 1.5E-02 | 0.05 |
| 9 eta 700t45 | 45 000 | 6.13 | 0.454 | 0.700 | 1.6E-03 | 8.2E-07 | 0.93 | 1.1E-02 | 2.7E-02 | 3.7E-03 | 2.7E-02 | 0.07 (0.05) |
| 9.1 eta 700t70 | 70 000 | 6.34 | 0.453 | 0.700 | 1.63E-03 | 3.6E-07 | 0.93 | 1.1E-02 | 2.7E-02 | 3.7E-03 | 2.7E-02 | 0.07 (0.05) |
| 10 eta 675t45mixi | 45 000 | 4.18 | 0.479 | 0.675 | 0.26 | 5.2E-05 | 0.60 | 6.0E-02 | 9.5E-03 | 5.4E-02 | 1.7E-02 | 0.14 (0.02) |
| 10.1 15773t54g45 | 54 500 | 4.54 | 0.479 | 0.675 | 0.24 | 4.3E-05 | 0.61 | 6.3E-02 | 9.7E-03 | 5.6E-02 | 1.7E-02 | 0.15 (0.02) |
| 10.2 15873t58g47 | 58 300 | 4.68 | 0.479 | 0.675 | 0.24 | 4.1E-05 | 0.62 | 6.4E-02 | 9.8E-03 | 5.7E-02 | 1.7E-02 | 0.14 (0.02) |
| 10.3 16973t69g51 | 69 000 | 5.14 | 0.479 | 0.675 | 0.19 | 2.4E-05 | 0.65 | 7.1E-02 | 1.0E-02 | 6.2E-02 | 1.9E-02 | 0.16 (0.02) |
| 10.4 17773t77g54 | 77 000 | 5.39 | 0.479 | 0.675 | 0.16 | 1.4E-05 | 0.67 | 7.7E-02 | 1.1E-02 | 6.7E-02 | 2.0E-02 | 0.17 (0.02) |
| 10.5 18273t84g56 | 84 500 | 5.63 | 0.479 | 0.675 | 0.13 | 9.0E-06 | 0.69 | 8.1E-02 | 1.1E-02 | 7.0E-02 | 2.1E-02 | 0.18 (0.02) |
| 10.6 18573t91g59 | 90 700 | 5.93 | 0.479 | 0.675 | 0.11 | 5.9E-06 | 0.70 | 8.4E-02 | 1.2E-02 | 7.3E-02 | 2.1E-02 | 0.19 (0.02) |
| 11 eta 675t45mixnmi | 45 000 | 4.36 | 0.480 | 0 | 0.48 | 3.0E-04 | 0.45 | 2.8E-02 | 5.9E-03 | 2.9E-02 | 1.0E-02 | 0.07 (0.02) |
| 12 eta 675t70mix1i | 70 000 | 5.16 | 0.479 | 0.675 | 0.19 | 2.3E-05 | 0.65 | 7.1E-02 | 1.1E-02 | 6.2E-02 | 1.9E-02 | 0.16 (0.02) |
| 13 eta 675t70mix2i | 70 000 | 5.20 | 0.479 | 0.675 | 0.16 | 1.6E-05 | 0.66 | 7.5E-02 | 1.1E-02 | 6.6E-02 | 2.0E-02 | 0.18 (0.02) |
| 14 eta 675t70mixnmi | 70 000 | 5.43 | 0.480 | 0 | 0.48 | 3.0E-04 | 0.45 | 2.8E-02 | 5.9E-03 | 2.9E-02 | 1.0E-02 | 0.07 (0.02) |
| 15 eta 675t90mixi | 90 000 | 5.86 | 0.479 | 0.675 | 0.11 | 6.2E-06 | 0.70 | 8.4E-02 | 1.2E-02 | 7.3E-02 | 2.1E-02 | 0.19 (0.02) |
| 15.1 18742t98g63 | 97 600 | 6.28 | 0.479 | 0.675 | 0.09 | 3.4E-06 | 0.71 | 8.8E-02 | 1.2E-02 | 7.6E-02 | 2.2E-02 | 0.20 (0.02) |
| 16 eta 675t90mixnmi | 90 000 | 6.58 | 0.480 | 0 | 0.48 | 3.0E-04 | 0.45 | 2.8E-02 | 5.9E-03 | 2.9E-02 | 1.0E-02 | 0.07 (0.02) |
The evolution code JMSTAR was used to calculate a total of 16 initial sdO models corresponding to different evolutionary sequences (Table 1 shows some of their relevant properties). The models were built in a first step to account for the physical parameters of the pulsator sdOs candidates found in our simultaneous observational survey, and in a second step, trying to map out the sdO domain in the HR diagram. All of the models were created by evolving a 1 M star, starting on the pre-Main Sequence. The initial metallicity is solar (Z = 0.02) except models 7–9 for which Z = 0.05. The code follows the complete evolution of the star continuously to the sdO stage, and beyond. Fig. 1 roughly depicts the sdO domain in the HR diagram and the location of the constructed models. Their domain is located between the instability strips of the sdB variables and the GW Vir stars (low-degree g-mode pulsators excited by the C/O opacity mechanism)
To obtain sdO models, the mass loss rate on the RGB is enhanced by a factor ranging from 1.60 to 1.85 compared to canonical Reimers’ mass loss rates. Most of the hydrogen-rich envelope is removed just after or even before the helium core flash. At the highest RGB rates, the model stars leave the RGB and evolve to higher temperatures at constant luminosity, avoiding the AGB. They then suffer a helium-core flash just before or slightly after they enter a white dwarf cooling phase. After the core flash, the star is an EHB/sdB star burning He quiescently in the core. After core He exhaustion, the star enters the He shell burning sdO phase. The calculations are stopped when the model stars reach the (final) white dwarf phase. A born-again phase due to a very late thermal pulse occurs in some of the sequences. In this case, flash-driven convection carries nuclear processed material to the surface of the star, enriching the atmosphere with He, C, N and O. For particular models with sdO characteristics (see Table 1), we have performed a stability analysis.
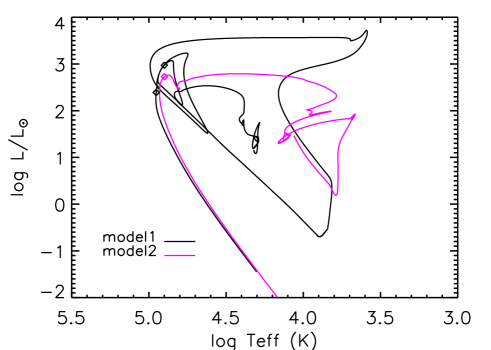
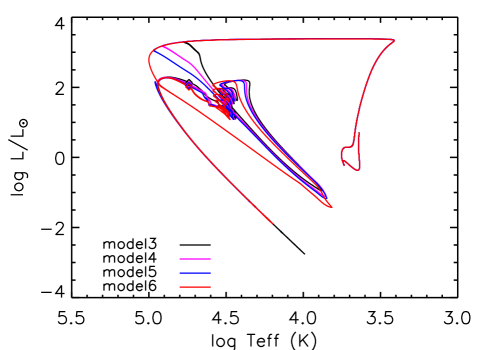
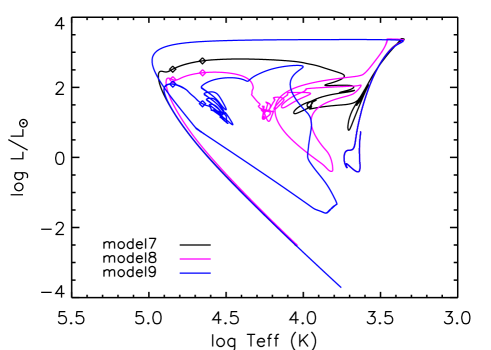
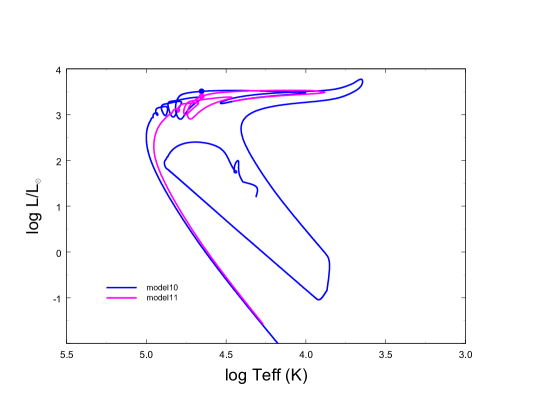
The evolutionary tracks on which models 1–2, 3–6, 7–9 and 10–11 lie are depicted in Fig. 2, 3, 4 and 5. The complex evolution, near = 30 000 K () in models 3 to 6, and in a wider range of temperatures for models 7–9, occurs near the end of the helium-core flash when the star is settling to a quiescent helium burning phase in the core, that is, the sdB phase. At the high mass loss rates used to create models 3–6, the mass loss induced by the hot star wind is sufficient to expose internal He-rich layers. Thus, although the photospheres are not He-rich when the models reach the Horizontal Branch, they become He enriched due to the stellar wind as they evolve from sdBs to sdOs. Note that Fig. 2 shows only the part of the evolutionary tracks that occurs after the EHB phase.
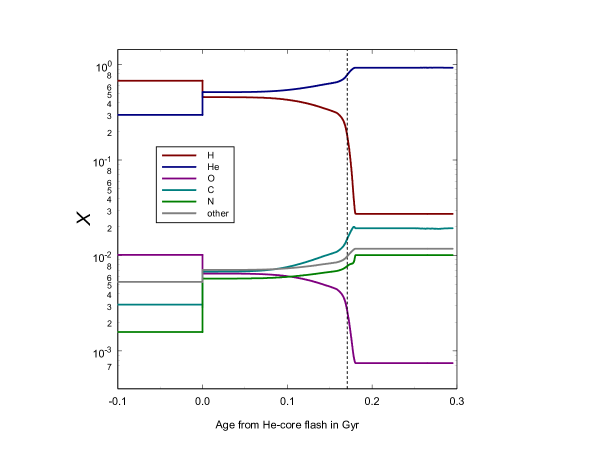
There is an important difference between the evolutionary sequence of model 6 and the similar sequences of models 3–5. For model 6, the He-core flash occurs after the star has entered the white dwarf cooling phase, and in a similar manner to the evolution of post-AGB ’Born-Again’ stars (see e.g. Lawlor & MacDonald 2006 and references therein), the convection zone that develops above the off-center He-burning region penetrates into the H-rich envelope. However, unlike the ’Born-Again’ stars, this occurs when the He-burning region has become inactive and the temperature is too low for proton capture reactions to occur. The result of the mixing is to introduce C12 produced by the 3- process into the envelope, together with O18 and Ne22 produced by N14 -captures. Shortly after the end of the He-core flash, this material is convected throughout the H-rich envelope, increasing the heavy element abundance to . For models 3–5, the convection zone above the off-center He-burning region does not penetrate into H-rich envelope and there is no increase in the surface heavy element abundances. The temporal evolution of the photospheric abundances for the model 6 sequence is shown in Fig. 6.
Models 10 to 16 require special comment. They are also late core helium flashers, but after they had arrived on the Zero Age Horizontal Branch (ZAHB) ad hoc extra-mixing was included for the purpose of bringing heavy elements to the surface to increase the envelope metallicity. Due to the extra-mixing, helium is also taken to higher temperatures, leading to helium shell flashes. Flash-driven convection then leads to further mixing of heavy elements to the surface. These helium shell flashes are responsible for the loops in Fig. 5, near K and . For models 11 (see Fig. 5), 14 and 16 mass loss was switched off in the calculations once they arrived on the ZAHB.
2.2 The oscillations code
We used the GraCo fully non-adiabatic oscillations code (Moya et al. 2004; Moya & Garrido 2008), which is based on the Unno et al. (1989) formulation to study the sdO models described above. Because the thermal and dynamical time scales become comparable in the outer parts of the star, a non-adiabatic treatment of the oscillations is required in order to properly describe the dynamical characteristics of the oscillations, i.e. which modes will grow or decay with time. The non-adiabatic treatment does not significantly modify the eigenfrequencies with respect to the adiabatic, at least for our purposes, although it will modify the amplitudes and phases of the eigenfunctions. This proves to be very important in using multicolor photometry for mode identification of pulsating stars, although this is beyond the scope of this paper.
3 Non Adiabatic Stability Analysis
We used GraCo to calculate modes from to with frequencies between 0.3 to 20 mHz (50 to 3000 s), searching for excited short and/or long periods.
The stability or instability of a model is given by the growth rate as a function of the frequency. We used the Dziembowski, Moskalik & Pamyatnykh (1993) definition of the growth rate: with the convention that positive (negative) values indicate driving (damping) of a particular mode.
In discussing which regions of the model contribute to driving or damping, we made use of the derivative of the work integral as a function of the fractional mass depth111The fractional mass depth parameter ) gives a better resolution of the envelope structure, which is more relevant to pulsations than the structure of the deep interior. (), which gives the energy locally gained or lost by the displaced material during one pulsation cycle. A positive (negative) value of at a given location indicates that this region contributes locally to driving (damping) a mode. Correspondingly, the running work integral () is also used to illustrate the relative importance of driving and damping zones.
In the next sections we describe the more interesting models found in the analysis.
4 Model 8: eta 650t45
This model, taken from an evolutionary sequence with initial heavy element abundance Z = 0.05, has =45 000 K and . Although it was found stable in the whole frequency range, it has a narrow intermediate frequency region, corresponding to low-radial order p-modes, with a weak tendency to instability, which seemed interesting in terms of explaining a possible selection mechanism for observed modes in the only sdO pulsator found to date (Rodríguez-López et al. (2009b).


|

|


|

|
The model propagation diagram, representative of all the models used in the analyses, plus the opacity are shown in Fig. 7. There are three main bumps in the Rosseland opacity profile (scale given in the right axis): the shallowest at corresponds to the helium ionization zone, where He II turns to He III at K; the maximum at , which we will refer to as the Z-bump, is mainly due to iron-peak elements at K; and the one at is the deep opacity bump at K, which results from a combination of K-shell photoionization of carbon and oxygen and spin orbit effects in L-shell bound free transitions of iron (Rogers & Iglesias, 1992). It is clear from the opacity profile that the He II partial ionization zone is too high in the envelope to have any significant weight in the driving of the modes.
The Brunt-Väisälä () and the Lamb frequencies () are plotted for . The Brunt-Väisälä frequency has maxima where gradients in chemical composition are steepest. Hence, the peak at accounts for the transition between the C/O core and the He burning shell, while the secondary peak at is the transition between the radiative He and H burning shell. All the energy transport in the model is radiative except at where , indicating that this is a convection zone associated with ionization of heavy elements producing an increase in the opacity rendering convective energy transport more efficient than radiation. We note here that models of sdB stars usually have a convective core and a radiative envelope with a thin convection zone produced by the partial ionization of HeII/HeIII (Charpinet et al., 2000).

The g- and p-mode propagation zones are determined respectively by and , with being the real part of the eigenfrequency. Fig. 7 shows that g-modes cannot propagate in the outer envelope, and that p-modes cannot propagate in the innermost part of the star, except for modes with very high-radial order222The radial order, represented by , or sometimes , gives the number of nodes of each mode, in the radial direction.. The diagram also gives broad constraints on the range of frequencies in which modes can propagate. It gives an upper limit for the angular frequencies of g-modes, – depending somewhat on the degree – corresponding to cyclic frequencies mHz or periods s. In the case of p-modes it gives a lower limit for eigenfrequencies, , which translates to cyclic frequencies mHz or periods s. Hence modes with oscillation eigenfrequencies in the range are mixed modes, i.e. they behave as p-modes in the outer part of the star and as g-modes in the inner zones. These limits correspond to a range in the frequency propagation of mHz or a range in periods of s. These mixed modes are typical of evolved stars, like sdOs, and hamper the identification of the modes: P and G modes’ propagation zones are not separated by an evanescent zone, but their frequency ranges overlap significantly, as derived above. We should then be cautious about the nomenclature and emphasise that whenever we refer to a p- (g-) mode, we refer in fact to mixed modes with nodes mainly in the P (G) mode propagation zone (see position of nodes for modes p1, p30 in Fig. 7); except for those with high-radial orders (see nodes for mode g88 in Fig. 7) i.e. g-modes with mHz, and p-modes with mHz, far out of the frequency range considered here. In practice, for this model, modes with mHz (or k33) do not have modes in the G mode region.
We plot the growth rate vs. frequency for modes (the behaviour being analogous for any degree ) in Fig. 10, up to 15 mHz, as higher frequencies were found highly stable. The model is stable as the growth rate is negative in the whole frequency range. However there are 3 regions of interest in regard to stability:
-
•
between about 0.5 to 1 mHz, where modes are not completely stable
-
•
from about 2.5 to 5 mHz, a highly-stable region
-
•
from mHz to 15 mHz, where the growth rate shows an oscillatory behaviour.
The differential work (), running work integral (), and opacity, for six modes (marked with diamonds in Fig. 10) chosen to be representative of the growth rate profile, give some insight into the local contributions and their relative importance to the work integral.
Fig. 8 shows the g100 mode (on the left) with mHz and , which is representative of the low frequency region where the growth rate is not so negative. We identify a driving region at the location of the deep opacity bump as responsible for the not complete stabilization of the modes. However, due to the large number of nodes in the deepest region, radiative damping exceeds driving and the modes are stable.
The g15 mode (centre) with mHz and represents the high-stability region found at frequencies between 2.5–5 mHz. The region where maximum energy interchange for the model occurs where the ratio of the dynamical to thermal timescales is 1 (corresponding to ). For low-radial-order g-modes, maximum energy interchange takes place at , where the derivative of the opacity does not favour driving, yielding a complete stabilization of the modes.
The onset of the oscillatory behaviour is represented by the g1 mode (right) with mHz and . The mode gains a bit in instability due to the development of a weak driving region at , i.e. the Z-bump location. Its oscillating nature is due to the rise and fall of a driving zone at this Z-bump location, as we show next.
We plot 3 modes belonging to the third region of stability in Fig. 9. On the left panel, we plot p2 mode with mHz and . We see that the reason for the low value of the growth rate is the vanishing driving region, whereas all the remaining energy contributes to damping.
The mode with maximum growth rate is p9 (centre) with mHz and . The reason is the maximum developing of the driving region at the location of the Z-bump.
The decrease of the growth rate at high frequencies is due to the energy damping region becoming wider and wider, as is the case for the p11 mode (right) with mHz and .
Thus, the interplay between the development and extinction of a driving region at the Z-bump location is responsible for the oscillatory behaviour of the growth rate.
In an attempt to thoroughly investigate the properties of this model (and in particular the peculiar behaviour of the growth rate), we explored the behaviour of the kinetic energy of the modes. This lead to the discovery of a mode trapping structure in the g- and p-mode spectra, the details of which will be presented elsewhere (Rodríguez-López et al., 2009b).
5 Model 10: eta 675t45mixi
This is the first of seven models – models 10 to 16, see Table 1– created by introducing an artificial extra-mixing in the post-ZAHB evolution with the purpose of raising the metallicity in the envelope in an attempt to drive pulsations, as explained in Section 2.1.
Model 10 was our first model discovered to be unstable. We found that high-radial order g-modes are driven through the action of a -mechanism due to the Z-bump at K, the same mechanism that drives oscillations in sdB stars. Although the extra-mixing has significantly increased the abundances of C and O in the driving region, this has very little effect on the opacity there. Hence the presence of instability in this model shows that radiative levitation of iron is not a necessary condition for pulsations of sdO stars, as long as the metallicity is sufficiently increased. More evolved models from this evolutionary sequence (models 10.1 - 10.6 in Table 1) were also tested for pulsational instability. We found pulsations were driven in models with K and . So, the instability strip for this evolutionary sequence was found to be K and , and may extend to lower temperature and surface gravity.
The evolutionary track on the – diagram described by the time evolution of the model is shown in Fig. 11. The positions of the initial model 10 and the subsequent model found unstable are marked with diamonds. Crosses indicate intermediate structural models found stable in the stability analysis. The whole evolutionary time for this model is about 300 000 yr, while e-folding times of the excited modes are of the order of to 10 yr, so modes have enough time to grow in amplitude.
The growth rate profile for modes is shown in Fig. 12. We found two regions with excited modes (similar growth rate profiles and instability regions where found for the other degrees):
-
•
within the frequency range mHz (periods 52–58 min), which correspond to modes from g203 to g182 and
-
•
within the frequency range mHz (periods 40–44 min), which correspond to modes from g152 to g138


|

|
These modes fall within a wider range favoured for instability between mHz. Meanwhile, modes with frequencies mHz were found highly stable with . We have selected a few representative modes, marked with diamonds in Fig. 12, for further discussion. The profiles of the differential work, running work integral, and opacity for these representative modes are shown in Fig. 13.
We chose the g190 mode with mHz and (Fig. 13, left) as representative of the two ‘islands’ of instability. There is a wide driving zone centered at , the location of the Z-bump responsible for the instability.
To represent the stability zone between the two ‘islands’ of instability and, moreover, the stability zone up to 2 mHz, we chose the g177 mode (Fig. 13, centre) with mHz and . The stability is due to the near extinction of the previous driving region and most of the significant energy contributing to damp the modes. The development and extinction of the region contributing to driving (with its maximum taking place at the location of the Z-bump) at the expense of a damping region is produced in the frequency range between 0.2 to 1.5 mHz and is responsible for the oscillatory profile of the growth rate.
Finally, mode p89 (Fig. 13, right) with mHz and is representative of the high stability of low and high-radial order p-modes. The stability is due to a wide damping region at the location of the Z-bump.
Model 10.1 of this same evolutionary sequence was found unstable in the frequency range (for , and similarly for other degrees):
-
•
0.71 to 0.75 mHz (periods 22-23 min) which corresponds to modes from g81 to g76.
6 Model 15: eta 675t90mixi
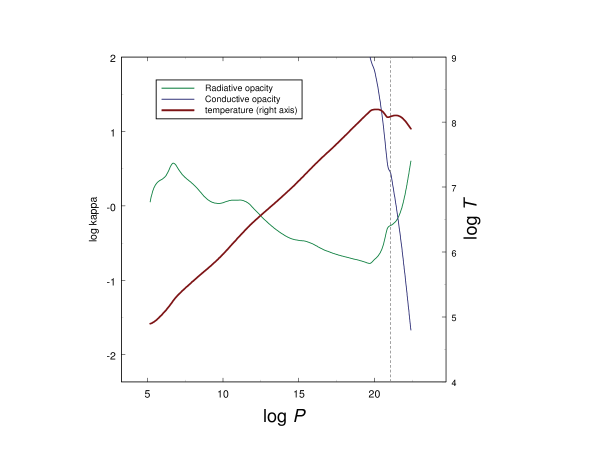
This is the second model found unstable in our study. We found it drives two overstable modes. This driving is achieved through the action of three different driving regions: (i) the opacity bump at K which for this model is due to a combination of opacity from iron-peak elements and, because of their increased abundances due the extra-mixing, opacity from C and O, (ii) a driving region at K, located immediately above the hydrogen burning shell, and most likely due to the K-edge of highly ionised argon (Rogers & Iglesias, 1992), and (iii) an opacity bump that occurs at the transition from radiative to conductive energy transport. At the high temperatures and densities in the core the radiative opacity is dominated by free - free absorption. Because the core temperature gradient is relatively small, the radiative opacity increases with the density. On the other hand the electrons become more degenerate with increasing density and the conductive opacity decreases. The combination of these two opacity variations gives a maximum in the opacity, corresponding to the opacity bump in driving region (iii) (see Fig. 18). Tests cancelling out the contribution of the nuclear energy generation show that the mechanism is not responsible for this deepest driving region, nor for region (ii). The instability was obtained for modes (similar for other modes with other degrees):
-
•
g27 with mHz and and
-
•
g24 with mHz and .
This corresponds to periods in the range 7–8 min. Model 15 has one of the lowest H mass fraction, and one of the largest He, C and O mass fractions (see Table 1), which extend with constant values from the surface of the star down in the envelope until about . It has also the largest metallicity, Z=0.19, of the whole series of models.
The propagation diagram and opacity of model 15 (Fig. 14) shows that the region of mixed modes is reduced compared to that of model 8, which is representative of most of the models used in this study. We also note that the Z-bump has shifted to shallower regions, with its maximum at compared to for the models with K or for models with K.


|

|

|

|
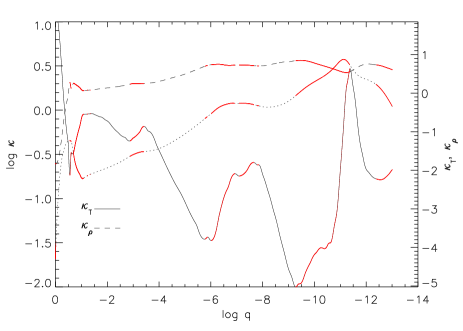
A plot of the Rosseland mean opacity and its opacity derivatives, and is shown in Fig. 15. Opacity derivatives play an important role in the mechanism as the necessary condition for driving is given by the expression (Unno et al., 1989):
| (1) |
Regions in the star fulfilling this criterion are shown in red in Fig. 15. All the regions involved in the effective driving of the two excited modes are potential driving regions, together with the region of the Z-bump, also involved in the p-mode excitation (see below) and the very surface of the star, which, on the contrary, has no significant weight in the driving.
The age of this model from when it first became an sdO is about 10 000 yr, which is less than the linear growth rate e-folding times found: and yr for g24 and g27, respectively. However, the effective temperature remains near 90 000 K for more than yr after this particular model. Therefore, from the rate of change of the effective temperature, the evolutionary time scale for this model is about yrs, and modes may be able to develope observable amplitudes.
The normalised growth rate of the model is given in Fig. 19. It has a low frequency region with mHz where the two overstable modes are driven, and in which high and low values of the growth rate alternate for consecutive modes. There is a highly stable region at intermediate frequencies mHz and finally, a tendency to driving is found in the high frequency range with mHz where low-radial order p-modes are found.
An example of a quasi-unstable mode in the very low frequency region, below 1 mHz, is given in Fig. 16 (left) by the g63 mode with mHz and . The high values of the growth rate are due to driving from region (i). At the high effective temperatures of this model this opacity bump occurs high in the envelope, at , which favours pulsations, as heat interchange is more effective.
An example of a mode in the low frequency region which has lost its tendency to driving is given in Fig. 16 (centre) by the g35 mode with mHz and . In addition to driving region (i), a driving region at (corresponding to K in temperature) has developed near the location of the deep opacity bump due to the transition from radiative to conductive energy transport in the semi-degenerate material. However, radiative damping right above this region exceeds the driving effect of both regions, damping the modes.
One of the two unstable modes found, g24 with mHz and is shown in Fig. 16 (right). A new driving region, which we attribute to Ar ionization, has developed at , where K. The model is able to achieve instability due to the combined driving of two of the three regions: the first and second, or the first and third regions, but modes are stable if only the first, or the joint second and third regions contribute to the differential work. It is the first time, to our knowledge, that driving of modes due to such a combined action of driving regions has been reported. This may give us a useful tool to explore physical processes, in particular energy transport, in dense hot regions.

A mode representative of the intermediate frequency region with the lowest values of the growth rate is the g6 mode with mHz and (Fig. 17, left). Modes at intermediate frequencies have maximum energy interchange at , where the derivative of the opacity does not favour driving, which results in maximum stabilization of the modes.
Fig. 17 (right) shows mode p7 with mHz and , as an example of a quasi-unstable mode in the high frequency region where the low-radial order p-modes are found. This mode falls within the region of observed modes for J1600+0748. Surprisingly, due to the high of the model, the high values of the growth rate are due to a wide driving region caused by Z-bump. However, driving is not achieved as it is counterbalanced by a damping region located at the base of the Z-bump.
Further evolved models in the evolutionary sequence were analysed and found stable.
7 Summary of the results
We present a summary of the stability analysis carried out for all the analysed models and submodels in Table 2. We give , , metallicity and if a tendency to instability – or actual instability – was found in the g- and/or p-mode spectrum and which driving region was responsible for it. In addition, we give the frequency and period range most favoured for instability.
| Model number | Teff | log g | Z | g-modes | p-modes | Freq. range | Period range |
|---|---|---|---|---|---|---|---|
| & name | (K) | (mHz) | (s) | ||||
| 1 p675_8057 | 79 000 | 5.70 | 0.07 | C/O | Z | 0.5–1.5, 10–14 | 700–2000, 70–100 |
| 1.1 p675_9065 | 90 000 | 6.50 | 0.07 | C/O | – | 0.5–5 | 200–2000 |
| 2 p650_7960 | 79 000 | 5.95 | 0.02 | C/O | – | 0.5–1 | 1000–2000 |
| 3 etap 685 | 55 000 | 5.89 | 0.02 | C/O | – | 0.5–2.5 | 400–2000 |
| 4 etap 690 | 55 000 | 5.95 | 0.02 | C/O | – | 0.5–2.5 | 400–2000 |
| 5 etap 695 | 55 200 | 5.98 | 0.02 | C/O | – | 0.5–3 | 300–2000 |
| 6 etap 700 | 55 000 | 6.02 | 0.04 | C/O | – | 0.5–2.5 | |
| 7 eta 600t45 | 45 000 | 4.95 | 0.05 | z | – | 2–5 | 200–500 |
| 7.1 eta 600t70 | 70 000 | 5.95 | 0.05 | C/O | – | 0.5–1.5 | 700–2000 |
| 8 eta 650t45 | 45 000 | 5.26 | 0.05 | – | z | 7–9.5 | 100–150 |
| 8.1 eta 650t70 | 70 000 | 6.22 | 0.05 | C/O | – | 0.5–3.5 | 300–2000 |
| 9 eta 700t45 | 45 000 | 6.13 | 0.07 | C/O | – | 1–7 | 150–1000 |
| 9.1 eta 700t70 | 70 000 | 6.34 | 0.07 | C/O | – | 0.5–4 | 250–2000 |
| 10 eta 675t45mixi | 45 000 | 4.18 | 0.14 | Z | – | 0.2–0.9 | 1100–5000 |
| 10.1 15773t54g45 | 54 500 | 4.54 | 0.15 | Z | – | 0.3–2 | 500–3300 |
| 10.2 15873t58g47 | 58 300 | 4.68 | 0.14 | Z | – | 0.3–2.5 | 400–3000 |
| 10.3 16973t69g51 | 69 000 | 5.14 | 0.16 | C/O+Z | – | 0.2–3.5 | 300–5000 |
| 10.4 17773t77g54 | 77 000 | 5.39 | 0.17 | C/O+ Z | – | 0.2–1.5, 4–6.5 | 700–5000, 150–250 |
| 10.5 18273t84g56 | 84 500 | 5.63 | 0.18 | C/O | Z | 0.2–1, 8–11 | 1000–5000, 90–125 |
| 10.6 18573t91g59 | 90 700 | 5.93 | 0.19 | C/O | Z | 0.2–3, 17–21 | 300–5000, 50–60 |
| 11 eta 675t45mixnmi | 45 000 | 4.36 | 0.07 | Z | – | 0.4–0.7 | 1400–2500 |
| 12 eta 675t70mix1i | 70 000 | 5.16 | 0.16 | C/O + Z | – | 0.2–1, 2.5–4 | 1000–5000, 250–400 |
| 13 eta 675t70mix2i | 70 000 | 5.20 | 0.18 | C/O + Z | – | 0.2–0.5, 3–4 | 2000–5000, 250–300 |
| 14 eta 675t70mixnmi | 70 000 | 5.43 | 0.07 | C/O + Z | – | 0.4–0.8, 5–7 | 1250–2500 |
| 15 eta 675t90mixi | 90 000 | 5.86 | 0.19 | C/O | Z | 0.3–3.5, 15–20 | 300–3300, 50–65 |
| 15.1 18742t98g63 | 97 600 | 6.28 | 0.20 | C/O | – | 1.5–2 | 500–700 |
| 16 eta 675t90mixnmi | 90 000 | 6.58 | 0.07 | C/O | – | 2–4, 5.5–7 | 250–500, 150–180 |
If we draw our attention first to the first batch of models built for this study (models 1 to 9), all of them, except models 7 and 8, have a certain tendency to instability of the g-modes due to the gathering of driving energy at the location of the deep opacity bump at K. This opacity bump is mainly due to iron-peak elements in models which have not experienced mixing of the products of core helium burning into the envelope. Opacity from C and O plays a role for models in which mixing has occurred. Whether or not opacity from C and O is important for driving, we label this driving region C/O in Table 2. Modes more favoured for driving are high-radial order g-modes, i.e. long period modes, with typical frequencies of oscillation between 0.5 and 2 mHz, i.e. periods 500 to 2000 s. We emphasis the unique behaviour of model 7 in which the tendency to instability of the g-modes is caused by the Z-bump.
We would expect that an increase in the C/O mass fraction, at least in the driving region, would lead to the eventual driving of the modes, as it is known that high metallicities help to increase the potential instability of the models.
Models 1 and 8 have the Z-bump playing a role in the destabilization of the p-modes333Models marked with a lowercase z in Table 2 mean that the model barely reached the ’tendency to instability’, considered as such when the growth rate values of the modes reach at least -0.5.. Model 8 presented an oscillatory profile of the growth rate with frequency, which lead us to analyse it in more detail, revealing mode trapping of g- and p-modes (Rodríguez-López et al., 2009b).
While doing this study we were aware that standard sdB evolutionary models with solar and uniform metallicities were not able to drive modes, and crude increases in the metallicity first (Charpinet et al., 1996) and the so-called second generation models next (Charpinet et al., 1997b) were needed to excite pulsations and reproduce theoretically the observed instability strip. The latter take diffusion (radiative levitation and gravitational settling) into account to produce a non-uniform profile of iron with depth, which is confirmed to be a key ingredient in driving pulsations (Charpinet et al., 2009).
Due to our negative results in exciting modes in this first batch of models, we aimed at building models as rich in metals as possible to test if it was possible to excite modes at some point via a -mechanism associated with a C/O partial ionization zone. Therefore, a last batch of models (models 10 to 16) was built in which an ad hoc extra-mixing was added to increase the metallicity in the envelope.
All these mixed-models have a tendency to driving of the high-radial order g-modes (see Table 2), caused by the Z-bump (this was only found previously for model 7), the C/O partial ionization zone, or a combination of both, the C/O being responsible for the tendency to driving of modes with lowest frequencies.
We finally achieved the instability of several models in the evolutionary sequence of model 10, that define a narrow instability band in the range K, , metallicity and periods around 20 min, 45 min and 1 h. The instability is caused by a classical -mechanism due to the opacity bump of the iron-peak elements, that excite high-radial order g-modes in the star. Further time-evolved models in the same sequence were found stable.
Model 15, with K, and metallicity Z=0.19, was found to have unstable high-radial order g-modes due to driving from a combination of a classical -mechanism in the C/O partial ionization zone at K, a mechanism operating at K probably caused by argon ionization, and a -mechanism associated with an opacity bump that results from the transition from radiative to conductive opacities. This model has one of the largest total metallicity, helium, carbon and oxygen mass fractions within the whole set of models. We found it drives two overstable modes in the period range 7-8 min.
Models 10.5, 10.6 and 15, with temperatures between 84 500 and 91 000 K, show a tendency to instability of the low-radial order p-modes caused by the Z-bump. This behaviour is similar to that found in model 1, also a high temperature model ( K). This is a somewhat unexpected result, as for such high the location of the Z-bump is quite high in the envelope of the star, where the driving efficiency is lower due to the lower density. Fortunately, this result is confirmed by actual driving of p-modes through a mechanism associated to the Z-bump is achieved by Fontaine et al. (2008) for two hot sdO models with 71 000 and 81 000 K, which include radiative levitation of iron. Those models have high temperatures fitting the first determination of physical parameters of J1600+0748, K and , also derived by Fontaine et al. (2008).
8 Discussion and Conclusions
We carried out a non-adiabatic analysis of sdO equilibrium models to explore their feasibility as pulsators. We analysed 27 sdO models out of 16 different evolutionary sequences and we found the first two sdO evolutionary models ever to drive high-radial order g-modes. In one model, with 45 000 K, instability of g-modes is due to a classical -mechanism in the partial ionization zone of the iron-peak elements at K. This shows that radiative levitation is not an absolute pre-requisite for pulsations of a model sdO star as long as the metallicity is increased to what are probably unrealistic values. Inclusion of radiative levitation of iron remains necessary for complete asteroseismological analysis of hot subdwarfs. In the second model, with 90 000 K, g-modes are found to be unstable due to the combination of driving from three distinct regions in the star. The outermost driving region is located at K, where the iron-peak opacity bump is strongly augmented by contributions from ionization of carbon and oxygen, which we have have enhanced in abundance by ad-hoc extra-mixing during the evolution after the ZAHB. The second driving region is located at K where a subtle opacity bump develops due to the ionization of argon. The innermost driving region is located at the transition between radiative and conductive energy transport, and may be of interest as a tool to explore energy transport processes in dense hot regions.
All of our sdO models, except one, present a certain tendency to instability for high-radial order g-modes, with typical oscillation frequencies between 0.5 and 2 mHz (i.e. periods 500–2000 s). For most of the models this tendency to driving in usually due to the occurrence of a driving zone at the location of the C/O partial ionization zone. However, quasi-excitation due to the heavy elements partial ionization zone or a combination of both also occurred.
The fact that we found actual driving due to a -mechanism associated with C/O opacity in only one model may be due to the deep location of the C/O partial ionization zone within the star, where the high ratio of the thermal to dynamical time scales impedes efficient heat interchange. Hence, only hotter models with shallower partial ionization zones, such as model 15 for which we achieved actual driving, may be able to overcome this problem.
The tendency to instability of p-modes was not so common, and was achieved for only 5 out of 27 models. We did not achieve actual driving of p-modes, those observed in the only sdO pulsator known to date, in any of our models. In some of the hotter models, we found a tendency to driving of low-radial order p-modes, always triggered by the -mechanism associated with the Z-bump. We partially attribute the inability to get actual p-mode driving to the shallow location of the heavy elements partial ionization zone, where the density is low, making its contribution to the work integral not sufficient to drive the modes. However, this difficulty has been now overcome by the results of Fontaine et al. (2008) who have achieved the actual driving of p-modes for hot models which include radiative levitation and gravitational settling of iron.
Finally, we would like to remark that, as shown by Fontaine et al. (2008) and Charpinet et al. (2009), inclusion of radiative levitation of iron in the models has revealed essential in achieving the actual excitation of p-modes. The determination of physical parameters (Fontaine et al. 2008; Rodríguez-López et al. 2009a) for the unique pulsating sdO star to date provides us with an excellent clue to pursue observational searches for new sdO pulsators, with the aim of characterising their instability strip. Envisaged problems are the lack of catalogued sdOs with high effective temperatures, as historically, atmosphere grids reached only up to about 55 000 K. The role of recent sky surveys such as the Sloan Digitally Sky Survey444http://www.sdss.org/ and new tools as those offered by the Virtual Observatory555http://www.ivoa.net are crucial for spectroscopic and photometric searches of new sdO candidates. The road ahead is challenging, as candidates will be mostly faint (magnitudes at least over 16 or 17) which will pose difficulties in achieving high S/N light curves that allow to detect the lowest amplitude modes. Strategies as propose sdO candidates to be observed by asteroseismologic satellites such as CoRoT or KEPLER have to be considered.
Acknowledgments
CRL acknowledges an Ángeles Alvariño contract of the regional government Xunta de Galicia. This research was also supported by the Spanish Ministry of Science and Technology under project ESP2004–03855–C03–01 and by the Junta de Andalucía and the Dirección General de Investigación (DGI) under project AYA2000-1559. AM acknowledges financial support from a Juan de la Cierva contract of the Spanish Ministry of Education and Science. RO is supported by the Research Council of Leuven University through grant GOA/2003/04.
References
- Ahmad & Jeffery (2005) Ahmad A., Jeffery, C. S., 2005 A&A, 437, L51
- Charpinet et al. (1996) Charpinet S., Fontaine G., Brassard P., Dorman, B., 1996, ApJ, 471, L103
- Charpinet et al. (1997a) Charpinet S., Fontaine G., Brassard P., Dorman, B., 1997a, ApJ, 489, L149
- Charpinet et al. (1997b) Charpinet S., Fontaine G., Brassard P., Chayer P, Rogers F. J., Iglesias C. A., Dorman B., 1997b, ApJ, 483, L123
- Charpinet et al. (2000) Charpinet S., Fontaine G., Brassard P., Dorman, B., 2000, ApJS, 131, 223
- Charpinet et al. (2009) Charpinet S., Fontaine G., Brassard P., 2009, A&A, 493, 595
- Dreizler et al. (1990) Dreizler S., Heber U., Werner K., Moehler S., de Boer K. S., 1990, A&A, 235, 234
- Driebe et al. (1999) Driebe T., Blöcker T., Schönberner D., Herwig F., 1999, A&A, 350, 289
- Dziembowski et al. (1993) Dziembowski W. A., Moskalik P., Pamyatnykh A. A., 1993, MNRAS, 265, 588
- Fontaine et al. (2003) Fontaine G., Brassard P., Charpinet S., Green E. M., Chayer P., Billères M., Randall S. K., 2003, ApJ, 597, 518
- Fontaine et al. (2008) Fontaine G., Brassard P., Green E. M., Chayer P., Charpinet S., Andersen M., Portouw J., 2008, A&A, 486, L39
- Green et al. (2003) Green E. M. et al., 2003, ApJ, 583, L31
- Han et al. (2002) Han Z., Podsiadlowski Ph., Maxted P. F. L., Marsh T. R., Ivanova N., 2002, MNRAS, 336, 449
- Hirsch & Heber (2008) Hirsch H., Heber U., 2008, to appear in ASPC, vol. 392, Proceedings of the Hot Subdwarf Stars and Related Objects, p. 175
- Jeffery et al. (1997) Jeffery C. S., Drilling J. S., Harrison P. M., Heber U., Moehler S., 1997, A&AS, 125, 501
- Kilkenny et al. (1997) Kilkenny D., Koen C., O’Donoghue D., Stobie R. S., 1997, MNRAS, 285, 640
- Lawlor & MacDonald (2006) Lawlor T. M., MacDonald J. , 2006, MNRAS, 371, 263
- Moya et al. (2004) Moya A., Garrido R., Dupret M.-A., 2004, A&A, 414, 1081
- Moya & Garrido (2008) Moya A., Garrido R., 2008, Ap&SS, 316, 129
- Oreiro et al. (2005) Oreiro R., Pérez-Hernández F., Ulla A., Garrido R., Østensen R., MacDonald J., 2005, A&A, 438, 257
- Oreiro et al. (2009) Oreiro R., Østensen R. H, Green E. M., Geier S., 2009, A&A, 496, 827
- Østensen (2009) Østensen R. H, 2009, to appear in Communications in Asteroseismology vol.159, Proceedings of the JENAM 2008 Symposium No 4: Asteroseismology and Stellar Evolution
- Rodríguez-López et al. (2004) Rodríguez-López C., Ulla A., Garrido R., Manteiga M., Thejll P., 2004, Ap&SS, 291, 431
- Rodríguez-López et al. (2005) Rodríguez-López C., Ulla A., Garrido R., Manteiga M., Casanova V., Sota A., Østensen R., Oreiro R., 2005, in Koester D., Moehler, S., eds., ASP Conf. Ser. Vol. 334, 14th European Workshop on White Dwarfs. Astron. Soc. Pac., San Francisco, p. 627
- Rodríguez-López et al. (2007) Rodríguez-López C., Ulla A., Garrido R., 2007, MNRAS, 379, 1123
- Rodríguez-López et al. (2009a) Rodríguez-López C. et al., 2009a, MNRAS, accepted, (astro-ph/0909.0930)
- Rodríguez-López et al. (2009b) Rodríguez-López C., Moya A., Garrido R., MacDonald J., Oreiro R., Ulla A. 2009b, in preparation
- Rogers & Iglesias (1992) Rogers F. J., Iglesias C., 1992, ApJS, 79, 50
- Ströer et al. (2007) Ströer A., Heber U., Lisker T., Napiwotzki R., Dreizler S., Christlieb N., Reimers D., 2007, A&A, 462, 269
- Sweigart (1997) Sweigart A., 1997, ApJ, 474, L23
- Thejll et al. (1994) Thejll P., Bauer F., Saffer R., Liebert J., Kunze D., Shipman H. L., 1994, ApJ433, 819
- Unno et al. (1989) Unno W., Osaki Y., Ando H., Saio H., Shibahashi H., 1989, Nonradial Oscillations of stars, Tokyo: University of Tokyo Press, 2nd ed.
- Webbink (1984) Webbink R. F., 1984, ApJ, 277, 355
- Woudt et al. (2006) Woudt P. A. et al., 2006, MNRAS, 371, 1497