The AzTEC/SMA Interferometric Imaging Survey of Submillimeter-Selected High-Redshift Galaxies
Abstract
We present results from a continuing interferometric survey of high-redshift submillimeter galaxies with the Submillimeter Array, including high-resolution (beam size arcsec) imaging of eight additional AzTEC 1.1mm selected sources in the COSMOS Field, for which we obtain six reliable (peak S/N or peak S/N with multiwavelength counterparts within the beam) and two moderate significance (peak S/N ) detections. When combined with previous detections, this yields an unbiased sample of millimeter-selected SMGs with complete interferometric followup. With this sample in hand, we (1) empirically confirm the radio-submillimeter association, (2) examine the submillimeter morphology – including the nature of submillimeter galaxies with multiple radio counterparts and constraints on the physical scale of the far infrared – of the sample, and (3) find additional evidence for a population of extremely luminous, radio-dim submillimeter galaxies that peaks at higher redshift than previous, radio-selected samples. In particular, the presence of such a population of high-redshift sources has important consequences for models of galaxy formation – which struggle to account for such objects even under liberal assumptions – and dust production models given the limited time since the Big Bang.
Subject headings:
cosmology: observations – galaxies: evolution – galaxies: high-redshift – galaxies: starburst – galaxies: submillimeter – galaxies: formation1. Introduction
Though they make up a very small fraction of the local infrared (IR) luminosity density, at IR-luminous galaxies (LIRGs and ULIRGs: Sanders & Mirabel, 1996) become cosmologically important (e.g., Le Floc’h et al., 2005; Magnelli et al., 2009) and contribute significantly to the diffuse extragalactic IR background (Hauser et al., 1998; Kelsall et al., 1998; Arendt et al., 1998; Dwek et al., 1998; Fixsen et al., 1998; Pei et al., 1999; Devlin et al., 2009). They are also thought to dominate the cosmic star formation rate (SFR) density at (Blain et al., 1999, 2002; Pascale et al., 2009), drive the formation of luminous quasars (Sanders et al., 1988a, b; Hopkins et al., 2006, 2008b; Coppin et al., 2008b; Ivison et al., 2008; Narayanan et al., 2009b, a) and the most massive galaxies (Scott et al., 2002; Blain et al., 2004; Swinbank et al., 2006; Hopkins et al., 2008a; Viero et al., 2009). As such, these objects provide powerful constraints on theoretical models (Baugh et al., 2005; Swinbank et al., 2008), and further study is essential to achieve a more thorough understanding of the birth and evolution of galaxies.
A significant population of high-redshift ULIRGs was first revealed at 850 by the Submillimeter Common User Bolometer Array (SCUBA: Holland et al., 1999) at the James Clerk Maxwell Telescope (Smail et al., 1997; Hughes et al., 1998; Barger et al., 1998). At these wavelengths, the shape of the redshifted far-IR spectral energy distribution (SED) counteracts the effect of increasing luminosity distance to provide an unbiased view of dust-obscured star formation out to (Blain & Longair, 1993). Since their initial discovery, observers have amassed extensive catalogs of these submillimeter galaxies (SMGs: for a review, see Blain et al., 2002) in a number of fields across the sky at both submillimeter (850: Eales et al., 1999, 2000; Cowie et al., 2002; Scott et al., 2002; Webb et al., 2003; Serjeant et al., 2003; Wang et al., 2004; Coppin et al., 2006) and millimeter (1100-1200: Ivison et al., 2004; Greve et al., 2004; Dannerbauer et al., 2004; Laurent et al., 2005; Scott et al., 2006; Bertoldi et al., 2007; Scott et al., 2008; Perera et al., 2008; Wilson et al., 2008; Austermann et al., 2009) wavelengths.
However, a more complete understanding of these objects has been hampered, in part, by the relatively poor resolution of submillimeter cameras (FWHM arcsec), which makes identification of multiwavelength counterparts inherently ambiguous. The first break-through came with very deep wide-field radio continuum surveys, which leveraged the local radio/far-IR correlation (for a review, see Condon, 1992) in combination with statistical arguments to associate nearby radio sources with the submilliimeter emission (Ivison et al., 2002, 2007). This radio-submillimeter association permitted optical spectroscopic followup, which confirmed that SMGs lie at high-redshift (median : Chapman et al., 2003, 2005) and in turn enabled CO spectroscopic imaging (Neri et al., 2003; Sheth et al., 2004; Greve et al., 2005; Tacconi et al., 2006, 2008) which confirmed that most are young, gas-rich galaxies undergoing major mergers. While the radio/far-IR correlation is broadly thought to apply at high-redshift (Garrett, 2002; Gruppioni et al., 2003; Appleton et al., 2004; Boyle et al., 2007; Younger et al., 2009b), owing to the strong dimming of the radio continuum with increasing luminosity distance (see e.g., Carilli & Yun, 1999) existing radio-selected samples are biased towards somewhat lower redshift objects. While alternative counterpart identification techniques utilizing near and mid-IR imaging data exist (Ashby et al., 2006; Pope et al., 2006; Yun et al., 2008), these too may be subject to biases which are difficult to quantify.
Since all the above mentioned techniques are inherently ambiguous, reliable counterpart identification remains one of the most challenging obstacles to detailed study of SMGs. Though it currently requires a large investment of observing time, this motivates high-resolution interferometric imaging at the discovery wavelength utilizing facilities such as the Submillimeter Array (SMA: Ho et al., 2004), the Plateau de Bure Interferometer (PdBI), and the Caltech Millimeter Array (CARMA), which provide an order of magnitude improvement in the precision of absolute position measurements over single dish instruments and permit unambiguous identification of multiwavelength counterparts in higher resolution imaging data. Previous interferometric observations at millimeter (Downes et al., 1999; Frayer et al., 2000; Dannerbauer et al., 2002; Downes & Solomon, 2003; Genzel et al., 2003; Kneib et al., 2005; Greve et al., 2005; Tacconi et al., 2006, 2008) and submillimeter (Iono et al., 2006; Younger et al., 2007, 2008a, 2008b; Wang et al., 2007; Dannerbauer et al., 2008; Cowie et al., 2009) wavelengths have identified unambiguous counterparts for increasing numbers of radio-detected SMGs, and support the radio-submillimeter association. In particular, several groups (Younger et al., 2007; Wang et al., 2007, 2009; Dannerbauer et al., 2008, M. Yun et al. in preparation) found that the multiwavelength counterparts of radio-dim SMGs provided evidence for a significant population of SMGs at higher redshift than radio-selected samples; a result that has found recent support from spectroscopic observations of several individual objects (Capak et al., 2008; Schinnerer et al., 2008; Coppin et al., 2009; Daddi et al., 2009b, a).
The existence of large numbers of ULIRGs has profound implications for models of galaxy formation and evolution. Recent results from semi-analytic models (Baugh et al., 2005; Swinbank et al., 2008) have successfully reproduced the observed SMG population at – though at the expense of a dramatic departure from a universal initial mass function (IMF) in starbursts. However, even these tuned models struggle to produce a significant population of higher redshift SMGs (see, e.g., Figure 4 and § 4 in Coppin et al., 2009). Furthermore, given the limited time since the big bang, these high-redshift dusty starbursts provide constraints on models of dust production in the early universe.
In order to investigate the nature of these extreme objects, we have extended the original unbiased111In this context, we use the term ‘unbiased’ to refer to a signal-to-noise limited sample of millimeter sources, selected entirely on the basis of their millimeter emission. While this is not formally a flux-limited sample, given some sources with higher fitted fluxes but detections below the sigmal-to-noise limit, it is quite close to one – especially at the high flux end. survey (Younger et al., 2007) of 1.1mm selected SMGs with complete interferometric followup. In this work, we present results of high-resolution SMA imaging at 890 for 8 new sources first identified in the AzTEC/COSMOS survey (Scott et al., 2008).
2. Observations
The COSMOS field (Scoville et al., 2007) benefits from an extraordinary wealth of deep, multi-wavelength coverage from the X-ray to the radio. In this work, we utilize band imaging with the Advanced Camera for Surveys (ACS: Ford et al., 1998) on board the Hubble Space Telescope to a depth of 27.2 magnitudes (for point-sources at the level; Koekemoer et al., 2007), a variety of ground-based optical and near-infrared imaging data (see Taniguchi et al., 2007; Capak et al., 2007), imaging by the Infrared Array Camera (IRAC: Fazio et al., 2004) and the Multiband Imaging Photometer for Spitzer (MIPS: Rieke et al., 2004) on board the Spitzer Space Telescope at 3.6, 4.5, 5.8, 8.0, and 24 to depths of 0.9, 1.7, 11.3, 14.6, and 71 respectively (Sanders et al., 2007), and 1.4 GHz radio continuum imaging to a mean rms depth of /beam with the Very Large Array (VLA: Schinnerer et al., 2007). We also make use of photometric redshifts and stellar mass estimates from Mobasher et al. (2007).
The AzTEC/COSMOS survey covers 0.15 deg2 of the COSMOS field at 1.1 mm with an rms noise level of 1.3 mJy/beam (Scott et al., 2008). The AzTEC/COSMOS catalog includes 50 sources with S/N , of which 10 sources have S/N . For the SMA observations we chose the next eight highest significance sources () down from the original sample presented in Younger et al. (2007). This yields, in total, an unbiased sample of 15 millimeter selected SMGs with complete interferometric followup. Due to the high significance of the sources in our sample, the expected false detection is 0.3 sources (see Fig. 7 in Scott et al., 2008).
The SMA observations were performed in the compact array configuration (beam size ) at 345 GHz (full bandwidth 4 GHz from the combined sidebands) from December 2007 through March 2008. The weather was generally excellent (), with typical rms noise levels of 1.0-1.5 mJy per track with hours of on-source integration. The data were calibrated using the mir software package (Scoville et al., 1993), modified for the SMA. Complex gain calibration was performed using the calibrator sources J1058+015 ( Jy, away from targets) and J0854+201 ( Jy, away from targets). Passband calibration was done using available strong calibrator sources, primarily 3C273 and Callisto. The absolute flux scale was set using observations of Callisto and is estimated to be accurate to better than 20%. Positions and fluxes of the COSMOS sources were derived from the calibrated visibilities using the miriad software package (Sault et al., 1995). We also incorporated hourly integrations on a test quasar J1008+063 – which is included in both the JVAS (Patnaik et al., 1992; Browne et al., 1998) and VLBA Calibrator (Ma et al., 1998; Beasley et al., 2002) catalogs of compact, flat-spectrum radio sources, and has an absolute position known to better than 20 mas – to empirically verify the phase transfer.
3. Results
| Name | S/N | AzTEC Offset | ||||||
|---|---|---|---|---|---|---|---|---|
| [mJy] | [mJy] | [mJy] | [arcsec] | [arcsec] | [arcsec] | |||
| AzTEC8 | AzTEC J095959.34+023441.0 | 10.4 | 0.1 | 0.1 | 4.9 | |||
| AzTEC9 | AzTEC J095957.25+022730.6 | 4.1 | 0.4 | 0.4 | 1.2 | |||
| AzTEC10 | AzTEC J095930.76+024033.9 | 5.3 | 0.4 | 0.4 | 0.5 | |||
| AzTEC11c | AzTEC J100008.91+024010.2 | 8.2 | … | … | … | … | ||
| AzTEC11.Nc | AzTEC J100008.91+024009.6 | … | … | … | 0.2 | 0.2 | 2.2 | |
| AzTEC11.Sc | AzTEC J100008.94+024012.3 | … | … | … | 0.2 | 0.2 | 4.7 | |
| AzTEC12 | AzTEC J100035.29+024353.4 | 7.5 | 0.2 | 0.3 | 1.7 | |||
| AzTEC13 | AzTEC J095937.05+023320.0 | 4.6 | 0.3 | 0.2 | 4.5 | |||
| AzTEC14.E | AzTEC J100010.03+023014.7 | 5.0 | 0.3 | 0.3 | 5.4 | |||
| AzTEC14.W | AzTEC J100009.63+023018.0 | 3.9 | 0.4 | 0.3 | 6.0 | |||
| AzTEC15 | AzTEC J100012.89+023435.7 | 4.4 | 0.3 | 0.2 | 8.9 |
3.1. Overview
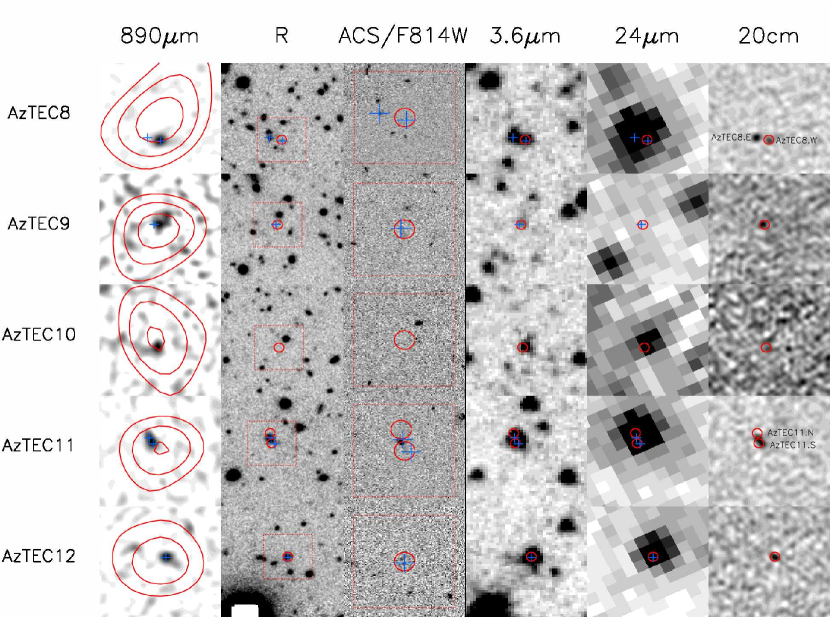
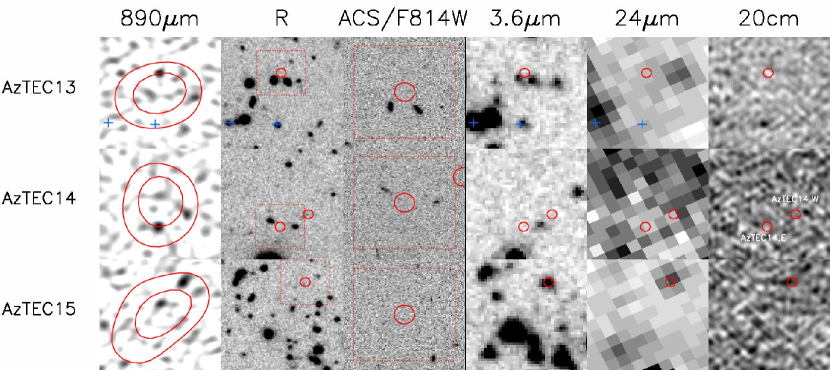
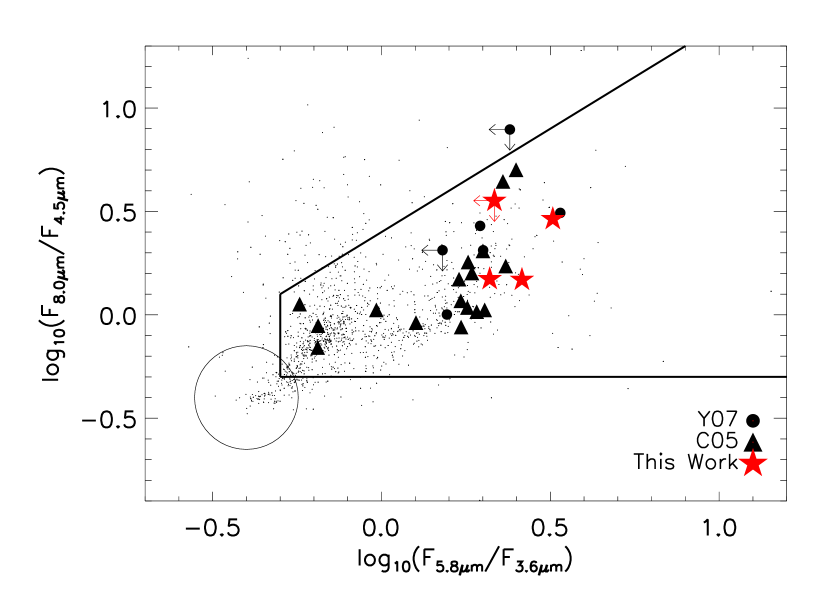
The multiwavelength data – including high-resolution 890 SMA imaging – for the 8 AzTEC 1100-selected targets is summarized in Tables 1 and 2, and Figures 1 and 2. There are significant () SMA detections for each of the target sources, from which we derive absolute positions accurate to arcsec. Of those, all but one SMA source are detected in the IRAC 3.6 and 4.5 imaging (and all but two in the IRAC 5.8 and 8.0 imaging), while only 5 have MIPS 24 or radio counterparts. We also find (see Figure 3) that those SMA detections with sufficient IRAC coverage meet the selection criteria proposed by Yun et al. (2008). Below, we summarize the data for each target source individually. In what follows, we will refer to the 5/9 SMA sources detected at a peak flux density with S/N as “high-significance” source, while the remainder (4/9) will be referred to as “moderate significance” and should be not considered secure detections unless they have corroborating multiwavelength counterparts; the number of beams in a typical SMA map, in addition to experience with coarsely sampled interferometer data, leads us to believe that these moderate significance detections may be spurious. Furthermore, we make occasional reference to “power-law” IRAC sources, which should be taken to refer to objects whose observed IRAC colors are consistent with a significant hot dust continuum thought to be powered by an active galactic nucleus (AGN: Lacy et al., 2004; Stern et al., 2005; Barmby et al., 2006; Donley et al., 2007; Hickox et al., 2007), ongoing intense star formation (Yun et al., 2008), or a complex mix of the two (Younger et al., 2009a).
3.2. Notes on Individual Targets
AzTEC J095959.34+023441.0 (AzTEC8) – AzTEC8 is detected at high-significance (peak S/N ) in the SMA image. Its visibility data is best fit by a point-source with mJy offset from the AzTEC centroid by 4.9 arcsec. Though the offset may seem large compared to, e.g., the signal-to-noise weighted error circle ( arcsec for AzTEC8, see Ivison et al., 2007), it is comparable to the expectation for an AzTEC source with (4.5 arcsec at 80% confidence, see Scott et al., 2008) and is still well within the 18 arcsec FWHM AzTEC beam (see also overlaid AzTEC contours in Figure 1). Of the two compact candidate radio counterparts (AzTEC8.E and AzTEC8.W) within the AzTEC beam, only one (AzTEC8.W; Jy, and coincident with a mJy peak in the SMA map) is a significant source of submillimeter emission. AzTEC8.E ( Jy) is just within the contour but not on a local maximum. Both are power-law IRAC SEDs, and AzTEC8.E is coincident with a bright MIPS 24 source ()222Due to the proximity of AzTEC8.W to this bright 24 source ( beam FWHM), it is difficult to obtain a reliable estimate of an upper limit on its 24 emission.. AzTEC8.W is also has faintest optical counterpart of the pair.
AzTEC J095957.25+022730.6 (AzTEC9) – AzTEC9 is detected at moderate significance (peak S/N ) in the SMA image. Its visibility data is best fit by a point-source with mJy offset by 1.2 arcsec from the AzTEC centroid. This fitted flux density, while lower than that inferred from the image plane, is consistent with its peak flux assuming a point-source structure. It is coincident with IRAC 3.6 and 4.5, and a radio source with Jy, but it is not detected in optical, IRAC 5.8/8.0, or MIPS 24 imaging data. Therefore, despite the moderate significance of the detection, because it is coincident with an IRAC/radio source we believe the detection is real.
| Name | Ba | ra | |||||||
|---|---|---|---|---|---|---|---|---|---|
| [mag] | [mag] | [Jy] | [Jy] | [Jy] | [Jy] | [Jy] | [Jy] | ||
| AzTEC8.Ee | |||||||||
| AzTEC8.We | … | ||||||||
| AzTEC9 | |||||||||
| AzTEC10 | |||||||||
| AzTEC11f | … | ||||||||
| AzTEC11.Nf | … | … | … | … | … | ||||
| AzTEC11.Sf | … | … | … | … | … | ||||
| AzTEC12 | |||||||||
| AzTEC13 | |||||||||
| AzTEC14.E | |||||||||
| AzTEC14.W | |||||||||
| AzTEC15 |
AzTEC J095930.76+024033.9 (AzTEC10) – AzTEC10 is detected at moderate significance (peak S/N ) in the SMA image. Its visibility data is best fit by a point-source with mJy offset by 0.5 arcsec from the AzTEC centroid. The SMA detection is coincident with an IRAC 3.6-8.0 source which peaks at 5.8– though it is statistically consistent with a power-law SED – and a faint MIPS source with Jy. AzTEC10 is not detected at optical or radio wavelengths.
AzTEC J100008.91+024010.2 (AzTEC11) – AzTEC11 is detected at high-significance (peak S/N ) in the SMA image. Its visibility data best fit by a double point-source, the two components of which (AzTEC11.N and AzTEC11.S) have and mJy and are offset by 2.2 and 4.7 arcsec from the AzTEC centroid respectively. There is an extended IRAC and MIPS source in between the two detections which is likely a blend of both sources. In addition, there is an elongated radio source that is extended in the same direction as the submillimeter detection; a double gaussian fit to the radio image data yields two sources with integrated flux densities of and Jy coincident with AzTEC11.N and AzTEC11.S respectively. Furthermore, AzTEC11.N has a photometric redshift of and a fitted stellar mass of (Mobasher et al., 2007).
AzTEC J100035.29+024353.4 (AzTEC12) – AzTEC12 is detected at high-significance (peak S/N ) in the SMA image. The visibility data is best fit by a point-source with mJy offset by 1.7 arcsec from the AzTEC centroid. As with AzTEC10, the SMA detection is coincident with an IRAC 3.6-8.0 source which peaks at 5.8 , indicative of for a starburst (Huang et al., 2004), in addition to a bright MIPS 24 source ( Jy) and a radio counterpart with Jy.
AzTEC J095937.05+023320.0 (AzTEC13) – AzTEC13 is detected at moderate significance (peak S/N ) in the SMA image. The visibility data is best fit by a point-source with mJy offset by 4.5 arcsec from the AzTEC centroid. It is not coincident with any optical, IRAC, MIPS, or radio sources. There is also a radio source within half an AzTEC beam (6.7 arcsec from the AzTEC centroid) with an IRAC 3.6 detection and a photometric redshift of (Mobasher et al., 2007) which is not associated with the submillimeter emission – the 890 emission at its location is consistent with the noise level of the SMA map.
AzTEC J100010.03+023014.7 (AzTEC14.E) – AzTEC14.E is a peak in the SMA image. Its visibility data is best fit by a point-source with mJy offset by 5.4 arcsec from the AzTEC centroid. It is not coincident with any optical, IRAC, MIPS, or radio sources.
AzTEC J100009.63+023018.0 (AzTEC14.W) – AzTEC14.E is a peak in the SMA image. Its visibility data is best fit by a point-source with mJy offset by 6.0 arcsec from the AzTEC centroid. It is not coincident with any optical, IRAC, MIPS, or radio sources.
AzTEC J100012.89+023435.7 (AzTEC15) – AzTEC15 is detected at moderate significance (peak S/N ) in the SMA image. Its visibility data is best fit by a point-source with mJy offset by 8.9 arcsec from the AzTEC centroid. As with AzTEC8, this is well beyond the formal error radius estimated by both Scott et al. (2008) and Ivison et al. (2007), and is in fact at the edge of the AzTEC beam FWHM. It is, however, coincident with a power-law IRAC sources and a faint MIPS 24 source ( Jy), but is not detected at optical or radio wavelengths. Though it only and offset by an AzTEC beam from the 1100 centroid, we believe that detections by IRAC and MIPS indicate that the source is real.
4. Discussion
The data presented in this work, combined with those presented by Younger et al. (2007), constitute an unbiased sample of 15 AzTEC 1100-selected sources with complete submillimeter interferometric followup. Positions derived from the interferometric imaging provide positions accurate to arcsec at a resolution (beam size arcsec FHWM) that is well-matched to multiwavelength imaging data. This, combined with the rich multiwavelength dataset available for the COSMOS field (see § 2 and Scoville et al., 2007, for an overview) immediately enables three investigations: in § 4.1 we present a systematic test of the radio-submillimeter association, in § 4.2 we examine the rest frame far-IR morphology of the sample, and in § 4.3 we identify candidate high-redshift sources. In the following analyses, we utilize the combined results of this work and Younger et al. (2007) for a total sample of 15 1.1mm selected SMGs with complete interferometric followup. As noted in § 3.1, sources at the S/N level with no confirming detection at other wavelengths may be spurious. This does not, however, effect our conclusions.
4.1. Testing the Radio-Submillimeter Association

The radio-submillimeter association uses 20cm radio sources imaged at comparatively higher resolution (20cm beam size arcsec, absolute astrometric uncertainty arcsec: e.g., Ivison et al., 2002) to refine absolute position measurements for SMGs. This technique leverages the local far-IR radio relation, combined with statistical arguments, to associate SMGs with radio sources within the submillimeter beam (see also Pope et al., 2006; Ivison et al., 2007) . While this method is efficient and physically plausible given the apparent lack of significant evolution in the far-IR/radio correlation with redshift (e.g., Ibar et al., 2008; Younger et al., 2009b), an independent verification of this technique is important. Our unbiased sample of 15 SMGs with direct submillimeter positions from interferometric imaging is the first robust sample for such a study.
From a statistical standpoint, we expect the contamination from spurious radio detections to be minimal. Though some observations reveal excess clustering of sub-mJy radio sources on arcminute scales (e.g., Richards, 2000; Georgakakis et al., 2000), those same observations show no evidence of significant anisotropy in 50-100 Jy radio sources on arcsecond scales of the kind considered here. Therefore, we can estimate the expected number of spurious associations with AzTEC positions assuming a roughly uniform distribution of foreground radio sources and the polynomial fitting form for radio number counts in the VLA-COSMOS survey as measured by Bondi et al. (2008). The results of this exercise are summarized in Figure 4. We consider three definitions of the search radius around AzTEC positions: (1) the full 18 arcsec AzTEC beam FWHM at 1.1mm, (2) the 4.5 arcsec 80% confidence interval for high-significance () AzTEC detections as estimated via Monte-Carlo simulation (Scott et al., 2008), and (3) the signal-to-noise weighted error circle of (Condon, 1997; Ivison et al., 2007). Owing to their relatively low surface density, even under the most conservative assumption of a full 18 arcsec search radius, we would expect spurious association between AzTEC and radio detections in the entire sample of 15 objects, and under more realistic assumptions none at all.
A complementary method of estimating contamination by foreground radio sources is the -statistic (Downes et al., 1986; Dunlop et al., 1989; Scott & Tout, 1989). For a given cumulative distribution of number counts as a function of flux density , one can estimate the probability of a random association for a source with flux density and separation as . This method has been used by a number of authors to argue for the likely association between SMGs and radio or mid-IR sources proximate to the submillimeter position (e.g., Hughes et al., 1998; Lilly et al., 1999; Ivison et al., 2002; Pope et al., 2006; Ivison et al., 2007). For all the sources in the sample, and again assuming the number counts of Bondi et al. (2008), owing to their low surface density on the sky the random association of any significant radio source (S/N ) within an individual AzTEC beam FWHM of 18 arcsec is highly improbable . Therefore, we would expect total spurious association for the entire sample, and far less under more realistic assumptions for AzTEC positional uncertainty (see above). Furthermore, considering the specific radio detections and their separation from the AzTEC centroid, the likelihood of a random superposition is even lower, with .
We find that of the 9 sources in the sample with radio sources within the AzTEC beam, there is only one instance – AzTEC13 – in which none of the radio detections within the AzTEC beam is also detected in the high-resolution SMA submillimeter maps; a result consistent with the statistics estimated above. This target has a mJy peak 4.5 arcsec to the north of the AzTEC centroid, but no significant detection at the location of the radio source 6.7 arcsec to the south. This radio source has a 20cm flux density of Jy, a photometric redshift of , and is detected at 3.6 by IRAC. It furthermore has a very high probability of being associated with the AzTEC emission; considering its peak flux density and separation from the AzTEC centroid we estimate . By contrast, the submillimeter source is not detected at any other wavelength. This is quite surprising, given the frequency of bright SMGs with unambiguous position measurements and 3.6 counterparts (Iono et al., 2006; Younger et al., 2007, 2008a; Wang et al., 2007, 2009). Without additional information, including deeper radio and IRAC imaging, we can only speculate that this source either lies at extremely high-redshift and/or has an uncharacteristically low stellar mass (Borys et al., 2005). At the same time, though we believe this detection is reliable, we must also admit the possibility – for the reasons discussed in § 4 – that an SMA detection at S/N without confirming detections at other wavelengths is spurious.
4.2. The Rest-Frame Far-IR Morphology of SMGs
In addition to providing accurate absolute position measurements, the interferometric imaging constrains the submillimeter morphology of bright SMGs. This allows us to both identify multi-component sources and estimate the physical scale of the far-IR. The former constrains the contribution of blends to the bright SMG population, and the latter is related to the engine driving the tremendous luminosity of these sources (see also the discussion in Younger et al., 2008b).
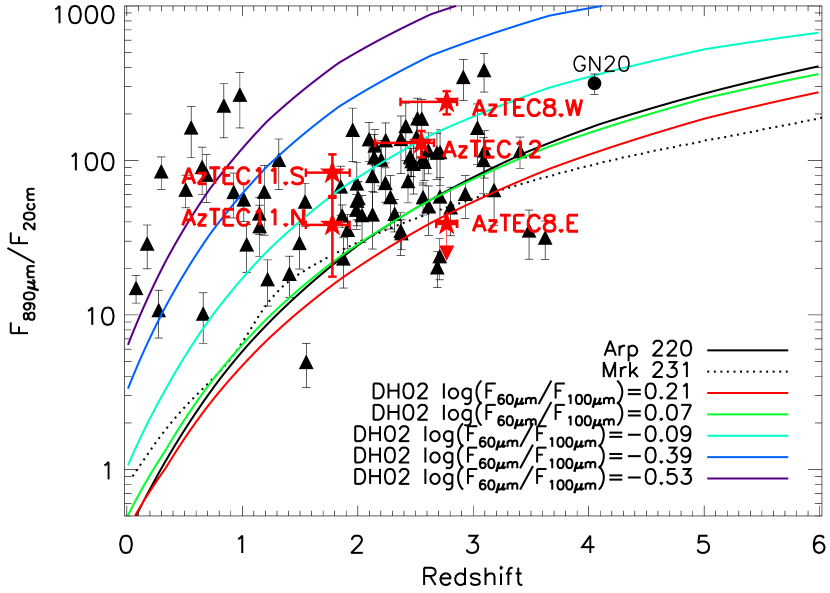
Our sample of 15 targets contains two reliable targets333As noted in § 4, sources S/N without confirming detections at other wavelengths are possibly spurious. For this reason, we exclude AzTEC14.W. and E from this discussion, though if the source positions are confirmed with more sensitive measurements this source may represent an example of a truly blended source. with multiple radio detections within the AzTEC beam: AzTEC5 (AzTEC5.N and AzTEC5.S) and AzTEC8 (AzTEC8.E and AzTEC8.W). In both cases, SMA imaging identifies only one of the two radio components as the source of the submillimeter emission. In both instances, the radio pairs have photometric redshifts that are marginally consistent with the sources residing at the same redshift, and therefore may be physically associated; AzTEC5.W (the submillimeter source; see Figure 1 in Younger et al., 2007) has and AzTEC5.E ( arcsec away) has (more appropriate, these photometric redshifts are not inconsistent to within the stated statistical errors); AzTEC8.W (the submillimeter source; see Figure 1) has a submillimeter-to-radio flux density ratio consistent with (see Figure 5) and AzTEC8.E ( arcsec away) has . This is consistent with the statistics of radio sources in the VLA-COSMOS survey; under the same assumptions as § 4.1, the probability of the secondary radio counterparts in AzTEC5 and AzTEC8 constituting a random superposition of foreground sources are both . Therefore, both objects are similar to LH850.02, a bright SMG in the Lockman Hole with two candidate radio counterparts of which only one was associated with the submillimeter emission (Younger et al., 2008a) and support the predicted rarity of SMGs arising from confusion of two lower luminosity sources (Ivison et al., 2007). If these two objects are indeed at the same redshift, then they necessarily have significantly different far-IR SEDs – or equivalently, effective dust temperatures – with the submillimeter-detected source representing a relatively cold starburst ( K; Kovács et al., 2006; Coppin et al., 2008a; Younger et al., 2009b), and the other a warm starburst or IR-luminous AGN (Sanders & Mirabel, 1996; Lutz et al., 1998; Risaliti et al., 2000; Younger et al., 2009a; Casey et al., 2009).
Of the remaining sources, all but one are best modeled as unresolved point-sources, which constrains their apparent angular size to arcsec. Furthermore, the one source that is resolved by the SMA – AzTEC11 – is best modeled as a double point-source, which is consistent with the two components of the extended radio emission within the AzTEC beam (see § 3.2, Table 2 and Figure 1), and its visibility function is inconsistent with extended emission such as a Gaussian or disk morphology at the level. Therefore, all the SMA detections in the unbiased sample of 15 targets are compact in the SMA imaging data, which at corresponds to a physical scale of kpc. While only an upper limit, these sizes are consistent with those measured via higher resolution submillimeter (Younger et al., 2008b) and radio (Chapman et al., 2004; Biggs & Ivison, 2008) data, and rule out cool cirrus dust (Efstathiou & Rowan-Robinson, 2003; Kaviani et al., 2003) on kpc scales as the source of the far-IR luminosity in the majority of bright SMGs. However, higher resolution imaging will be required to measure the size of the starburst region, and the data cannot rule out a significant contribution from an IR-luminous AGN on sub-kpc scales.
4.3. Candidate High-Redshift Sources
Though a number of techniques have been proposed (Ivison et al., 2002; Pope et al., 2006; Ashby et al., 2006; Yun et al., 2008), the unambiguous identification of multiwavelength counterparts to SMGs represents one of the most important challenges to their detailed study. Owing to the strong -correction at radio wavelengths, this problem is particularly acute for high-redshift SMGs. Recently, Younger et al. (2007) found evidence for a population – five of seven AzTEC targets – of SMGs with very faint or no radio or 24 counterparts. The existence of a large number of these high-z SMGs has profound consequences for models of galaxy formation (Baugh et al., 2005; Swinbank et al., 2008; Coppin et al., 2009) – which struggle to reproduce these sources, even with the arguably extreme assumption of a flat initial mass function (IMF) in starbursts – and dust production models (e.g., Gehrz, 1989; Marchenko, 2006; Dunne et al., 2003) given the limited coordinate time since the Big Bang at these redshifts (see also the discussion in § 5 of Younger et al., 2007). Though the high-redshift of four individual sources has been confirmed spectroscopically (Capak et al., 2008; Daddi et al., 2009b, a; Schinnerer et al., 2008; Coppin et al., 2009), the role of these objects among bright SMGs, and their contribution to the comoving star formation rate density (SFRD) in the early universe, has yet to be determined. Our expanded, unbiased sample of SMGs with interferometric followup can provide more powerful constraints, and identifies five additional candidate high-resdshift SMGs.
In Figure 5, we present the submillimeter-to-radio flux density ratio for the new objects the sample, along with SMGs with spectroscopic redshifts and radio detections from Chapman et al. (2005). The combined effects of a negative -correction in the submillimeter (Blain & Longair, 1993) and a strong positive -correction in the radio make this quantity a strong function of redshift (Carilli & Yun, 1999; Yun & Carilli, 2002). Those objects in the sample with photometric redshifts – AzTEC8, 11, and 12 – are all consistent with results from radio-selected samples. However, those with no radio detection – AzTEC10, 13, 14.E, 14.W, and 15 – have submillimeter-to-radio ratios that suggest either a higher average/median redshift than radio selected samples () or a colder dust temperature. However, dust temperatures cold enough to yield high flux density ratios () could be expected to have extended submillimeter morphologies on scales of several arcsec (Efstathiou & Rowan-Robinson, 2003; Kaviani et al., 2003), which is inconsistent with the observed sizes of the objects in the sample (see previous section). Therefore, as with the radio-dim objects in Younger et al. (2007), we believe these objects are compelling candidate members of a population of high-redshift sources at .
The mid- and near- IR properties of these objects are also consistent with a high-redshift. In Figure 6 we present the submillimeter-to-24 flux density ratio, which is also a strong function of redshift (see also Wang et al., 2007, 2009) – though it is important to note that the detectability of SMGs at 24 depends on the relative strength of PAH emission- and silicate absorption-features that are redshifted into the MIPS 24 band in sources at , which are quite model-dependent. Three of the four high-redshift candidates are not detected in deep 24 imaging, which is consistent with . AzTEC10, however, has a Jy 24 counterpart which, if we assume an Arp 220 template, suggests a redshift of ; more in line with the radio-selected population. However, this object has a 3.6-8.0 SED consistent with a power-law, which suggests either a significant hot dust contribution from either an AGN (i.e., Mrk 231) or starburst (i.e., M82; see also Yun et al., 2008), which is consistent with higher redshift . The observed submillimeter-to-3.6 flux density ratio (see Figure 7), which is also a strong function of redshift given a fairly narrow range in stellar mass and extinction (e.g., Borys et al., 2005), for these five high-redshift candidates is consistent with . A full analysis of the near- through far-IR SED, and its implications for the starburst properties and redshift of these sources will appear in forthcoming work (M. Yun et al., in preparation).
Finally, we can use the observed frequency of high-redshift SMGs in the sample – ten total candidate sources – to estimate a lower limit on their contribution to cosmic star formation at . As a crude approximation, we assume that the ten high-redshift candidates in the sample are uniformly distributed from and have a far-IR SED similar to Arp 220, which yields a bolometric correction of (Neri et al., 2003; Younger et al., 2008b). Given the assumed cosmology and a Salpeter (1955) IMF, this yields an SMG contribution of . This is of estimates of the universal SFRD at similar redshifts (Madau et al., 1996; Barger et al., 2000; Hopkins, 2004). That this is somewhat higher than previous estimates (Barger et al., 2000; Ivison et al., 2002) is not surprising; the sample presented in this work contains much brighter objects than typical SCUBA 850 surveys (median 850 flux density mJy versus mJy for the Chapman et al. [2005] sample), and some have speculated (e.g., Dunlop, 2001; Ivison et al., 2002; Younger et al., 2007) that the brightest SMGs lie preferentially at higher redshift. Therefore, we find that while bright high-z SMGs are important in constraining models of galaxy formation, the highest luminosity millimeter sources ( mJy; ) do not dominate star formation at .
5. Conclusion
We present results from an extensive campaign to follow up millimeter-selected SMGs with high-resolution (beam size arcsec) interferometric imaging. In this work, we have targeted 8 high-significance AzTEC 1.1mm sources with the SMA at 890, resulting in six reliable – S/N (“high-significance”) or S/N (“moderate significance”) with multiwavelength counterparts – and two tentative – moderate significance with no multiwavelength counterparts – detections. From the high-resolution maps, we derived positions accurate to arcsec, in addition to 890 fluxes and size constraints. When combined with results from Younger et al. (2007) this constitutes an unbiased sample of millimeter-selected SMGs with complete interferometric followup. From this combined sample, we firstly empirically verify the radio-submillimeter association invoked by previous authors. Second, we find that when there are two candidate radio counterparts, high-resolution imaging tends to single out one of the radio sources as the origin of the submillimeter emission, though there is some evidence that the two objects are physically associated (see also Younger et al., 2008a). Third, with the exception of one source (AzTEC11), all of the SMGs in the sample are unresolved by the SMA in compact configuration, yielding a maximum angular size of arcsec which, at redshifts typical of SMGs, is equivalent to a physical scale of kpc. Fourth, of the 15 sources in the sample, ten SMGs have radio, mid-IR, and near-IR properties consistent with a higher average/median redshift than radio-selected samples ( vs. for radio-detected samples: see Chapman et al., 2005). The existence of such a population of high-redshift, hyperluminous starbursts has important consequences for models of galaxy formation, which struggle to account for such extreme objects a .
References
- Appleton et al. (2004) Appleton, P. N. et al. 2004, ApJS, 154, 147
- Arendt et al. (1998) Arendt, R. G. et al. 1998, ApJ, 508, 74
- Ashby et al. (2006) Ashby, M. L. N. et al. 2006, ApJ, 644, 778
- Austermann et al. (2009) Austermann, J. E. et al. 2009, ArXiv e-prints
- Barger et al. (2000) Barger, A. J., Cowie, L. L., & Richards, E. A. 2000, AJ, 119, 2092
- Barger et al. (1998) Barger, A. J. et al. 1998, Nature, 394, 248
- Barmby et al. (2006) Barmby, P. et al. 2006, ApJ, 642, 126
- Baugh et al. (2005) Baugh, C. M., Lacey, C. G., Frenk, C. S., Granato, G. L., Silva, L., Bressan, A., Benson, A. J., & Cole, S. 2005, MNRAS, 356, 1191
- Beasley et al. (2002) Beasley, A. J., Gordon, D., Peck, A. B., Petrov, L., MacMillan, D. S., Fomalont, E. B., & Ma, C. 2002, ApJS, 141, 13
- Bertoldi et al. (2007) Bertoldi, F. et al. 2007, ApJS, 172, 132
- Biggs & Ivison (2008) Biggs, A. D. & Ivison, R. J. 2008, MNRAS, 385, 893
- Blain et al. (2004) Blain, A. W., Chapman, S. C., Smail, I., & Ivison, R. 2004, ApJ, 611, 725
- Blain & Longair (1993) Blain, A. W. & Longair, M. S. 1993, MNRAS, 264, 509
- Blain et al. (1999) Blain, A. W., Smail, I., Ivison, R. J., & Kneib, J.-P. 1999, MNRAS, 302, 632
- Blain et al. (2002) Blain, A. W., Smail, I., Ivison, R. J., Kneib, J.-P., & Frayer, D. T. 2002, Phys. Rep., 369, 111
- Bondi et al. (2008) Bondi, M., Ciliegi, P., Schinnerer, E., Smolčić, V., Jahnke, K., Carilli, C., & Zamorani, G. 2008, ApJ, 681, 1129
- Borys et al. (2005) Borys, C., Smail, I., Chapman, S. C., Blain, A. W., Alexander, D. M., & Ivison, R. J. 2005, ApJ, 635, 853
- Boyle et al. (2007) Boyle, B. J. et al. 2007, MNRAS, 376, 1182
- Browne et al. (1998) Browne, I. W. A., Wilkinson, P. N., Patnaik, A. R., & Wrobel, J. M. 1998, MNRAS, 293, 257
- Capak et al. (2007) Capak, P. et al. 2007, ApJS, 172, 99
- Capak et al. (2008) —. 2008, ApJ, 681, L53
- Carilli & Yun (1999) Carilli, C. L. & Yun, M. S. 1999, ApJ, 513, L13
- Casey et al. (2009) Casey, C. M. et al. 2009, MNRAS, in press [astro-ph/0906.5346]
- Chapman et al. (2003) Chapman, S. C., Blain, A. W., Ivison, R. J., & Smail, I. R. 2003, Nature, 422, 695
- Chapman et al. (2005) Chapman, S. C., Blain, A. W., Smail, I., & Ivison, R. J. 2005, ApJ, 622, 772
- Chapman et al. (2004) Chapman, S. C., Smail, I., Windhorst, R., Muxlow, T., & Ivison, R. J. 2004, ApJ, 611, 732
- Condon (1992) Condon, J. J. 1992, ARA&A, 30, 575
- Condon (1997) —. 1997, PASP, 109, 166
- Coppin et al. (2006) Coppin, K. et al. 2006, MNRAS, 372, 1621
- Coppin et al. (2008a) —. 2008a, MNRAS, 384, 1597
- Coppin et al. (2009) —. 2009, MNRAS, in press [astro-ph/0902.4464]
- Coppin et al. (2008b) Coppin, K. E. K. et al. 2008b, MNRAS, 389, 45
- Cowie et al. (2002) Cowie, L. L., Barger, A. J., & Kneib, J.-P. 2002, AJ, 123, 2197
- Cowie et al. (2009) Cowie, L. L., Barger, A. J., Wang, W.-H., & Williams, J. P. 2009, ApJ, 697, L122
- Daddi et al. (2009a) Daddi, E., Dannerbauer, H., Krips, M., Walter, F., Dickinson, M., Elbaz, D., & Morrison, G. E. 2009a, ApJL, in press [astro-ph/0903.3046]
- Daddi et al. (2009b) Daddi, E. et al. 2009b, ApJ, in press [astro-ph/0810.3108]
- Dale & Helou (2002) Dale, D. A. & Helou, G. 2002, ApJ, 576, 159
- Dannerbauer et al. (2008) Dannerbauer, H., Walter, F., & Morrison, G. 2008, ApJ, 673, L127
- Dannerbauer et al. (2002) Dannerbauer, H. et al. 2002, ApJ, 573, 473
- Dannerbauer et al. (2004) —. 2004, ApJ, 606, 664
- Devlin et al. (2009) Devlin, M. J. et al. 2009, Nature, 458, 737
- Donley et al. (2007) Donley, J. L., Rieke, G. H., Pérez-González, P. G., Rigby, J. R., & Alonso-Herrero, A. 2007, ApJ, 660, 167
- Downes et al. (1986) Downes, A. J. B., Peacock, J. A., Savage, A., & Carrie, D. R. 1986, MNRAS, 218, 31
- Downes & Solomon (2003) Downes, D. & Solomon, P. M. 2003, ApJ, 582, 37
- Downes et al. (1999) Downes, D. et al. 1999, A&A, 347, 809
- Dunlop (2001) Dunlop, J. S. 2001, New Astronomy Reviews, 45, 609
- Dunlop et al. (1989) Dunlop, J. S., Peacock, J. A., Savage, A., Lilly, S. J., Heasley, J. N., & Simon, A. J. B. 1989, MNRAS, 238, 1171
- Dunne et al. (2003) Dunne, L., Eales, S., Ivison, R., Morgan, H., & Edmunds, M. 2003, Nature, 424, 285
- Dwek et al. (1998) Dwek, E. et al. 1998, ApJ, 508, 106
- Eales et al. (1999) Eales, S. et al. 1999, ApJ, 515, 518
- Eales et al. (2000) —. 2000, AJ, 120, 2244
- Efstathiou & Rowan-Robinson (2003) Efstathiou, A. & Rowan-Robinson, M. 2003, MNRAS, 343, 322
- Fazio et al. (2004) Fazio, G. G. et al. 2004, ApJS, 154, 10
- Fixsen et al. (1998) Fixsen, D. J. et al. 1998, ApJ, 508, 123
- Ford et al. (1998) Ford, H. C. et al. 1998, in Proc. SPIE Vol. 3356, p. 234-248, Space Telescopes and Instruments V, Pierre Y. Bely; James B. Breckinridge; Eds., ed. P. Y. Bely & J. B. Breckinridge, 234–248
- Frayer et al. (2000) Frayer, D. T., Smail, I., Ivison, R. J., & Scoville, N. Z. 2000, AJ, 120, 1668
- Garrett (2002) Garrett, M. A. 2002, A&A, 384, L19
- Gehrz (1989) Gehrz, R. 1989, in IAU Symposium, Vol. 135, Interstellar Dust, ed. L. J. Allamandola & A. G. G. M. Tielens, 445
- Genzel et al. (2003) Genzel, R. et al. 2003, ApJ, 584, 633
- Georgakakis et al. (2000) Georgakakis, A., Mobasher, B., Cram, L., Hopkins, A., & Rowan-Robinson, M. 2000, A&AS, 141, 89
- Greve et al. (2004) Greve, T. R. et al. 2004, MNRAS, 354, 779
- Greve et al. (2005) —. 2005, MNRAS, 359, 1165
- Gruppioni et al. (2003) Gruppioni, C. et al. 2003, MNRAS, 341, L1
- Hauser et al. (1998) Hauser, M. G. et al. 1998, ApJ, 508, 25
- Hickox et al. (2007) Hickox, R. C. et al. 2007, ApJ, 671, 1365
- Ho et al. (2004) Ho, P. T. P., Moran, J. M., & Lo, K. Y. 2004, ApJ, 616, L1
- Holland et al. (1999) Holland, W. S. et al. 1999, MNRAS, 303, 659
- Hopkins (2004) Hopkins, A. M. 2004, ApJ, 615, 209
- Hopkins et al. (2003) Hopkins, A. M., Afonso, J., Chan, B., Cram, L. E., Georgakakis, A., & Mobasher, B. 2003, AJ, 125, 465
- Hopkins et al. (2008a) Hopkins, P. F., Cox, T. J., Kereš, D., & Hernquist, L. 2008a, ApJS, 175, 390
- Hopkins et al. (2008b) Hopkins, P. F., Hernquist, L., Cox, T. J., & Kereš, D. 2008b, ApJS, 175, 356
- Hopkins et al. (2006) Hopkins, P. F. et al. 2006, ApJS, 163, 1
- Huang et al. (2004) Huang, J.-S. et al. 2004, ApJS, 154, 44
- Hughes et al. (1998) Hughes, D. H. et al. 1998, Nature, 394, 241
- Ibar et al. (2008) Ibar, E. et al. 2008, MNRAS, 386, 953
- Iono et al. (2006) Iono, D. et al. 2006, ApJ, 640, L1
- Ivison et al. (2008) Ivison, R. J., Morrison, G. E., Biggs, A. D., Smail, I., Willner, S. P., Gurwell, M. A., Greve, T. R., Stevens, J. A., & Ashby, M. L. N. 2008, MNRAS, 390, 1117
- Ivison et al. (2002) Ivison, R. J. et al. 2002, MNRAS, 337, 1
- Ivison et al. (2004) —. 2004, ApJS, 154, 124
- Ivison et al. (2007) —. 2007, MNRAS, 380, 199
- Kaviani et al. (2003) Kaviani, A., Haehnelt, M. G., & Kauffmann, G. 2003, MNRAS, 340, 739
- Kelsall et al. (1998) Kelsall, T. et al. 1998, ApJ, 508, 44
- Kneib et al. (2005) Kneib, J.-P. et al. 2005, A&A, 434, 819
- Koekemoer et al. (2007) Koekemoer, A. M. et al. 2007, ApJS, 172, 196
- Kovács et al. (2006) Kovács, A. et al. 2006, ApJ, 650, 592
- Lacy et al. (2004) Lacy, M. et al. 2004, ApJS, 154, 166
- Laurent et al. (2005) Laurent, G. T. et al. 2005, ApJ, 623, 742
- Le Floc’h et al. (2005) Le Floc’h, E. et al. 2005, ApJ, 632, 169
- Lilly et al. (1999) Lilly, S. J., Eales, S. A., Gear, W. K. P., Hammer, F., Le Fèvre, O., Crampton, D., Bond, J. R., & Dunne, L. 1999, ApJ, 518, 641
- Lutz et al. (1998) Lutz, D. et al. 1998, ApJ, 505, L103
- Ma et al. (1998) Ma, C. et al. 1998, AJ, 116, 516
- Madau et al. (1996) Madau, P. et al. 1996, MNRAS, 283, 1388
- Magnelli et al. (2009) Magnelli, B., Elbaz, D., Chary, R. R., Dickinson, M., Le Borgne, D., Frayer, D. T., & Willmer, C. N. A. 2009, A&A, 496, 57
- Maloney & Reynolds (2000) Maloney, P. R. & Reynolds, C. S. 2000, ApJ, 545, L23
- Marchenko (2006) Marchenko, S. V. 2006, in Astronomical Society of the Pacific Conference Series, Vol. 353, Stellar Evolution at Low Metallicity: Mass Loss, Explosions, Cosmology, ed. H. J. G. L. M. Lamers, N. Langer, T. Nugis, & K. Annuk, 299
- Mobasher et al. (2007) Mobasher, B. et al. 2007, ApJS, 172, 117
- Narayanan et al. (2009a) Narayanan, D., Cox, T. J., Hayward, C., Younger, J. D., & Hernquist, L. 2009a, MNRAS, submitted [astro-ph/0905.2184]
- Narayanan et al. (2009b) Narayanan, D., Hayward, C. C., Cox, T. J., Hernquist, L., Jonsson, P., Younger, J. D., & Groves, B. 2009b, ApJL, submitted [astro-ph/0904.0004]
- Neri et al. (2003) Neri, R. et al. 2003, ApJ, 597, L113
- Pascale et al. (2009) Pascale, E. et al. 2009, ApJ, submitted [astro-ph/0904.1206]
- Patnaik et al. (1992) Patnaik, A. R., Browne, I. W. A., Wilkinson, P. N., & Wrobel, J. M. 1992, MNRAS, 254, 655
- Pei et al. (1999) Pei, Y. C., Fall, S. M., & Hauser, M. G. 1999, ApJ, 522, 604
- Perera et al. (2008) Perera, T. A. et al. 2008, MNRAS, 1261
- Pope et al. (2006) Pope, A. et al. 2006, MNRAS, 370, 1185
- Richards (2000) Richards, E. A. 2000, ApJ, 533, 611
- Rieke et al. (2004) Rieke, G. H., , et al. 2004, ApJS, 154, 25
- Risaliti et al. (2000) Risaliti, G., Gilli, R., Maiolino, R., & Salvati, M. 2000, A&A, 357, 13
- Salpeter (1955) Salpeter, E. E. 1955, ApJ, 121, 161
- Sanders & Mirabel (1996) Sanders, D. B. & Mirabel, I. F. 1996, ARA&A, 34, 749
- Sanders et al. (1988a) Sanders, D. B., Soifer, B. T., Elias, J. H., Madore, B. F., Matthews, K., Neugebauer, G., & Scoville, N. Z. 1988a, ApJ, 325, 74
- Sanders et al. (1988b) Sanders, D. B., Soifer, B. T., Elias, J. H., Neugebauer, G., & Matthews, K. 1988b, ApJ, 328, L35
- Sanders et al. (2007) Sanders, D. B. et al. 2007, ApJS, 172, 86
- Sault et al. (1995) Sault, R. J., Teuben, P. J., & Wright, M. C. H. 1995, in ASP Conf. Ser. 77: Astronomical Data Analysis Software and Systems IV, ed. R. A. Shaw, H. E. Payne, & J. J. E. Hayes, 433
- Schinnerer et al. (2007) Schinnerer, E. et al. 2007, ApJS, 172, 46
- Schinnerer et al. (2008) —. 2008, ArXiv e-prints
- Scott & Tout (1989) Scott, D. & Tout, C. A. 1989, MNRAS, 241, 109
- Scott et al. (2006) Scott, D. et al. 2006, in Bulletin of the American Astronomical Society, Vol. 38, Bulletin of the American Astronomical Society, 1072
- Scott et al. (2008) Scott, K. S. et al. 2008, MNRAS, 385, 2225
- Scott et al. (2002) Scott, S. E. et al. 2002, MNRAS, 331, 817
- Scoville et al. (2007) Scoville, N. et al. 2007, ApJS, 172, 1
- Scoville et al. (1993) Scoville, N. Z., Carlstrom, J. E., Chandler, C. J., Phillips, J. A., Scott, S. L., Tilanus, R. P. J., & Wang, Z. 1993, PASP, 105, 1482
- Serjeant et al. (2003) Serjeant, S. et al. 2003, MNRAS, 344, 887
- Sheth et al. (2004) Sheth, K. et al. 2004, ApJ, 614, L5
- Smail et al. (1997) Smail, I., Ivison, R. J., & Blain, A. W. 1997, ApJ, 490, L5
- Stern et al. (2005) Stern, D. et al. 2005, ApJ, 631, 163
- Swinbank et al. (2006) Swinbank, A. M. et al. 2006, MNRAS, 371, 465
- Swinbank et al. (2008) —. 2008, MNRAS, 391, 420
- Tacconi et al. (2006) Tacconi, L. J. et al. 2006, ApJ, 640, 228
- Tacconi et al. (2008) —. 2008, ApJ, 680, 246
- Taniguchi et al. (2007) Taniguchi, Y. et al. 2007, ApJS, 172, 9
- Viero et al. (2009) Viero, M. P. et al. 2009, ApJ, submitted [astro-ph/0904.1200]
- Wang et al. (2009) Wang, W.-H., Barger, A. J., & Cowie, L. L. 2009, ApJ, 690, 319
- Wang et al. (2004) Wang, W.-H., Cowie, L. L., & Barger, A. J. 2004, ApJ, 613, 655
- Wang et al. (2007) Wang, W.-H. et al. 2007, ApJ, 670, L89
- Webb et al. (2003) Webb, T. M. et al. 2003, ApJ, 587, 41
- Wilson et al. (2008) Wilson, G. W. et al. 2008, MNRAS, 390, 1061
- Younger et al. (2009a) Younger, J. D., Hayward, C. C., Narayanan, D., Cox, T. J., Hernquist, L., & Jonsson, P. 2009a, MNRAS, 396, L66
- Younger et al. (2009b) Younger, J. D., Omont, A., Fiolet, N., Huang, J.-S., Fazio, G. G., Lai, K., Polletta, M., Rigopoulou, D., & Zylka, R. 2009b, MNRAS, 394, 1685
- Younger et al. (2007) Younger, J. D. et al. 2007, ApJ, 671, 1531
- Younger et al. (2008a) —. 2008a, MNRAS, 387, 707
- Younger et al. (2008b) —. 2008b, ApJ, 688, 59
- Yun & Carilli (2002) Yun, M. S. & Carilli, C. L. 2002, ApJ, 568, 88
- Yun et al. (2008) Yun, M. S. et al. 2008, MNRAS, 389, 333