11email: jos@iac.es 22institutetext: Departamento de Astrofísica, Universidad de La Laguna, Tenerife, Spain 33institutetext: Kwasan and Hida Observatories, Kyoto University, Yamashina, Kyoto 607-8471, Japan
33email: ichimoto@kwasan.kyoto-u.ac.jp
On the origin of reverse polarity patches found by Hinode in sunspot penumbrae
Abstract
Context. The topology of penumbral magnetic fields is poorly known. The satellite Hinode has recently revealed penumbral structures with a magnetic polarity opposite to the main sunspot polarity. They may be a direct confirmation of magnetic field lines and mass flows returning to the solar interior throughout the penumbra, a configuration previously inferred from interpretation of observed Stokes profile asymmetries.
Aims. To point out the relationship between the reverse polarity features found by Hinode, and the model Micro-Structured Magnetic Atmospheres (MISMAs) proposed for sunspots.
Methods. Synthesis and modeling the sunspot Stokes profiles.
Results. Existing model MISMAs produce strongly redshifted reverse polarity structures as found by Hinode. Ad hoc model MISMAs also explain the asymmetric Stokes profiles observed by Hinode. The same modeling may be consistent with magnetograms of dark cored penumbral filaments if the dark cores are associated with the reverse polarity. Such hypothetical relationship will show up only in the far red wings of the spectral lines.
Conclusions. The reverse polarity patches may result from aligned magnetic field lines and mass flows that bend over and return to the solar interior throughout the penumbra.
Key Words.:
Sun: magnetic fields – Sun: photosphere – sunspots1 Rationale
Sunspots have always been benchmarks to test our understanding of magneto convection. It is known for long that magnetic forces impede the free plasma motions, thus reducing the efficiency of convection (Biermann 1941; Cowling 1953). However, convection occurs in sunspots despite the strength of the magnetic field, and the high conductivity of the photospheric plasma. The problem arises as to what is the mode of convection, i.e., how magnetic fields and plasma flows adjust one another to allow transporting the energy that balances the radiation losses. This long-lasting problem is far from been settled, and it is particularly severe in the penumbrae of sunspots with predominantly horizontal magnetic fields and mass flows (for recent reviews see, e.g., Solanki 2003; Thomas & Weiss 2004; Schlichenmaier 2009; Sánchez Almeida 2009; Thomas 2009). From an observational point of view, the problem lies in the small physical scales at which the convective transport is organized. Even with the best spatial resolutions achieved at present, we cannot follow the rise, cooling, and subsequent submergence of plasma blobs. The topology of the magnetic field lines and flows must be inferred indirectly. The present paper is devoted to analyze and interpret a recent observation that may be central to constrain the topology of the magnetic fields in penumbrae.
Ichimoto et al. (2007) report the presence of a strongly redshifted magnetic component in the penumbrae of sunspots with a polarity opposite to the main sunspot polarity. This component shows up throughout the penumbra, a property used to argue that the redshift must be due to vertical velocities. The observations were carried out with the stallelite Hinode (Kosugi et al. 2007), which yields a spatial resolution of 032 at the working wavelength ( 6302 Å; Tsuneta et al. 2008). Ichimoto et al. finding seems to be at variance with the magnetograms taken by Langhans et al. (2005, 2007) with the Swedish Solar Tower (SST, Scharmer et al. 2002), which do not show magnetic fields of reverse polarity in penumbrae. This poses a serious problem since SST has twice Hinode spatial resolution and, therefore, it should be simpler for SST to resolve and detect mixed polarities. SST magnetograms only reveal a decrease of the magnetograph signals coinciding with the dark cores, i.e., the dark lanes outlined by bright filaments discovered by Scharmer et al. (2002). This work shows how Hinode and SST observations can be naturally understood within the two component semi-empirical model penumbra derived by Sánchez Almeida (2005, hearafter SA05), provided that the dark cores are associated with the reverse polarity.
SA05 works out the model MIcro-Structured Magnetic Atmospheres (MISMAs111 The acronym was coined by Sánchez Almeida et al. (1996) to describe magnetic atmospheres having optically-thin substructure, which naturally produce asymmetric spectral lines.) required to quantitatively reproduce the asymmetries of the Stokes profiles222As usual, the Stokes parameters are used to characterize the polarization; for the intensity, and for the two independent types of linear polarization, and for the circular polarization. The Stokes profiles are graphs of , , and versus wavelength for a particular spectral line. They follow well defined symmetries when the atmosphere has constant magnetic field and velocity (see, e.g., Landi Degl’Innocenti 1992). observed in a large sunspot. Other inversion techniques have succeed in reproducing the observed line shapes (e.g., Sánchez Almeida & Lites 1992; Westendorp Plaza et al. 2001; Mathew et al. 2003), but there is something unique to the MISMA inversion, namely, the model demands two opposite polarities. This unexpected result has been often criticized as unreal (e.g., Langhans 2006; Bellot Rubio 2009), however, it is the ingredient that naturally explains Hinode reversals. The MISMA model sunspot includes two magnetic components. The major component contains most of the mass of each resolution element, and it has the polarity of the sunspot. It is generally combined with a minor component of opposite polarity and having large velocities. In typical 1″-resolution observations, the outcoming light is systematically dominated by the major component, and the resulting Stokes profiles have rather regular shapes. An exception occurs in the so-called apparent neutral line, where the Stokes profiles show a characteristic shape with three or more lobes termed cross-over effect (see Sánchez Almeida & Lites 1992, and references therein). At the neutral line the mean magnetic field vector is perpendicular to the line-of-sight, and the contribution of the major component almost disappears in Stokes due to projection effects. The cancellation of the two components is expected to be less effective when improving the spatial resolution, leading to the appearance of cross-over profiles. Actually, Hinode often finds cross-over Stokes profiles, and they show up precisely at the location of the reverse polarities (Fig. 5 in Ichimoto et al. 2007, and also § 3). The observed cross-over profiles have two polarities: the main sunspot polarity close to the line center, and the reverse polarity at the far red wing. Since the reverse polarity patches detected in penumbrae by Hinode produce cross-over profiles, they seem to correspond to structures where the polarity is not well defined, with positive and negative polarities coexisting in each pixel.
The paper is structured as follows: § 2 shows how the model MISMAs from SA05 qualitatively reproduce both Hinode and SST observations. We work out a simple model penumbral filament to show that it grasps the essential features of the observed ones. The same agreement is found when the model MISMAs are inferred by fitting actual Hinode Stokes profiles (§ 3). The implications in the context of the penumbral magnetic field topology and the Evershed effect are discussed in § 4, where we also put forward a specific test that could confirm or falsify our explanation. Empirical and theoretical difficulties for the dark cores to be associated with the reverse polarities are also discussed in § 4.
2 Model MISMA for penumbral filaments with dark core
As we describe in the introductory section, the model MISMAs often require two magnetic components with opposite polarities to reproduce the observed Stokes profiles. The major component has the polarity of the sunspot, and it is combined with a minor component of opposite polarity and having large velocities. The outcoming light is dominated by the major component, so that the reverse polarity seldom produces an obvious signal in the spatially integrated Stokes profiles. Within this scenario, improving the spatial resolution would reduce the spatial smearing, allowing extreme cases to show up. In order to mimic the effect of improving spatial resolution, several randomly chosen model MISMAs in SA05 were modified by increasing the fraction of atmosphere occupied by the minor component. Now the minor 333 Here and throughout, minor and major refer to the two components in the model sunspot by SA05. When applied to the components in the model atmospheres worked out in the paper, it only implies that their magnetic and velocity properties are similar to the minor and major components in SA05. component shows up in Stokes . The behavior described next is common to all the models, but we only examine in detail the example given in Fig. 1. The resulting Stokes , and profiles of Fe i 6302.5 Å are represented as solid lines in Figs. 1a, 1b and 1c, respectively. They correspond to a point in the limb-side penumbra of a sunspot at (18∘ heliocentric angle). Note how Stokes is redshifted and deformed, and how Stokes shows the cross-over effect. Consequently, the improvement of spatial resolution with respect to traditional earth-based spectro-polarimetric observations naturally explains the abundance of cross-over Stokes profiles found by Hinode. Figures 1a, 1b, and 1c also show the case where the major component dominates (the dashed line). The strong asymmetries have disappeared, rendering Stokes with reasonably antisymmetric shape and the sign of the dominant polarity. Recall that the two sets of Stokes profiles in Figs. 1a, 1b, and 1c (the solid lines and the dashed lines) have been produced with exactly the same magnetic field vectors and mass flows (shown in Figs. 1e and 1f). The atmospheres differ because of the relative importance of major and minor components, and because of a global scaling factor in the temperature stratification. One of them is some 80% cooler than the other one. The coolest renders asymmetric profiles with low continuum intensity, suitable to mimic dark features (see the Stokes continua in Fig. 1a).

Understanding Hinode observations in terms of MISMAs also explains the lack of reverse polarity in SST magnetograms. Stokes in reverse polarity regions shows cross-over effect (Fig. 5 in Ichimoto et al. 2007, and the solid line in Fig. 1c), i.e., it presents two polarities depending on the sampled wavelength. It has the main sunspot polarity near line center, whereas the polarity is reversed in the far red wing. SST magnetograms are taken at line center ( mÅ), which explains why the reverse polarity does not show up. A significant reduction of the Stokes signal occurs, though. Such reduction naturally explains the observed weakening of magnetic signals in dark cores (Langhans et al. 2005, 2007, and § 1), provided that the dark cores are associated with an enhancement of the opposite polarity, i.e., if the dark cores produce cross-over profiles. In order to illustrate the argument, we have constructed images, magnetograms, and dopplergrams of a (naïve) model dark-cored filament. It is formed by a uniform 100 km wide dark strip, representing the dark core, bounded by two bright strips of the same width, representing the bright sides. The Stokes profiles of the dark core have been taken as the solid lines in Figs. 1a and 1c, whereas the bright sides are modelled as the dashed lines in the same figures. The color filters employed by Langhans et al. (2005, 2007) are approximated by Gaussian functions of 80 mÅ FWHM, and shifted mÅ from the line center (see the dotted lines in Fig. 1a). The magnetogram signals are computed from the profiles as
| (1) |
with the wavelength referred to the central wavelength of the line, the transmission curve of the filter centered at , and mÅ. Similarly, the Doppler signals are given by
| (2) |
but here we employ the Stokes profile of the non-magnetic line used by Langhans et al. (2007; i.e., Fe i 5576 Å). When , the signs of and ensure for the main polarity of the sunspot, and for redshifted profiles. The continuum intensity has been taken as at -0.4 Å from the line center. The continuum image of this model filament is shown in Fig. 2, with the dark core and the bright sides marked as DC and BS, respectively. The dopplergram and the magnetogram are also included in the same figure. The dark background in all images indicates the level corresponding to no signal. In agreement with Langhans et al. observations, the filament shows redshifts (), which are enhanced in the dark core. In agreement with Langhans et al., the filament shows the main polarity of the sunspot (), with the signal strongly reduced in the dark core. Figure 2, bottom, includes the magnetogram to be observed at the far red wing ( mÅ). The dark core now shows the reverse polarity (), whereas the bright sides still maintain the main polarity with an extremely weak signal. This specific prediction of the modeling is amenable for direct observational test (see § 4).

Two additional remarks on our modeling are in order. First, the magnetogram signal in the dark core is much weaker than in the bright sides, despite the fact that the (average) magnetic field strength is larger in the core (see Fig. 1e, keeping in mind that the minor component dominates). Second, the model dark core is depressed in height with respect to the bright sides. Figure 1d shows the continuum optical depth as a function of the height in the atmosphere. When the two atmospheres are in lateral pressure balance, the layer of the dark core is shifted by some 100 km downward with respect to the same layer in the bright sides. The depression of the observed layers in the dark core is produced by two conspiring effects; the decrease of density associated with the increase of magnetic pressure (e.g., Spruit 1976), and the decrease of opacity associated with the reduction of temperature (e.g., Stix 1991). We mention the association of our dark cores with enhanced field strength and with geometrical depression because these properties contrast with some popular models of penumbral magneto-convection (e.g. Scharmer & Spruit 2006; Rempel et al. 2009). Note, however, that the association between field strength, brightness and geometric height is far from being established. Not all models predict dark features coinciding with weaker field. The siphon flow model of the Evershed effect has enhanced field strengths in the downflowing leg (e.g., Schlichenmaier 2002). The plasma has already cool down when reaching this footpoint and, so, one expects downflows associated with stronger fields and colder plasmas. As for the elevation of the dark cores, there is a solid observational result disfavoring it. Schmidt & Fritz (2004) found that the limb-side penumbra and the center-side penumbra are darker than the rest. They interpret this observation as an effect of the depression of the dark penumbral filaments, which are obscured by the bright ones when observed sideways. Obviously, this is an average result, but it strongly suggests that if dark cores are common, then they must be depressed with respect to the bright sides. We are showing here how the reduced magnetograph signals observed in dark cores can be produced even if their field strength is enhanced.
3 Reproducing Hinode Stokes profiles
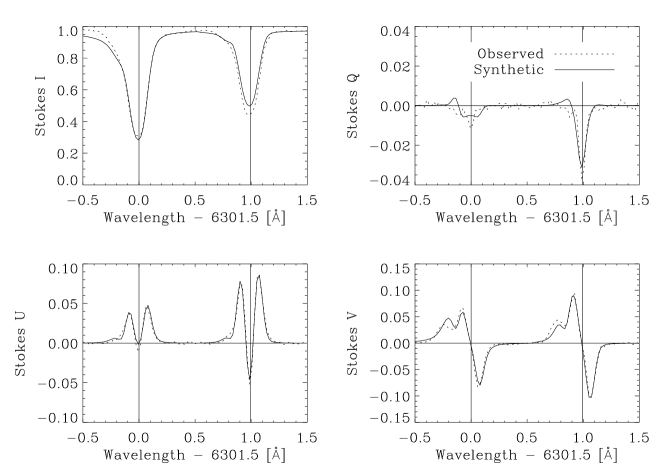
We have gone a step further, and the exercise in the previous section has been repeated using model MISMAs derived directly from Hinode/SP data. We use a small set of seven Stokes profiles selected so that they represent extreme cases among the whole range of redshifted and blueshifted profiles. They were observed in a simple, positive-polarity sunspot (NOAA10944) when the target was almost at the solar disk center (heliocentric angle 11), so that the line-of-sight direction and the vertical direction coincide to most purposes. The observation is described in Ichimoto et al. (2008), and we refer to this work for images, a logbook, and further details. Our data correspond to those taken at 18:25 UT on February 28th, 2007. Normal scan maps were obtained with the Spectro-Polarimeter (SP) of the Solar Optical Telescope (SOT; Tsuneta et al. 2008; Suematsu et al. 2008) aboard Hinode (Kosugi et al. 2007). The SP took full Stokes profiles of Fe i 6301.5Å and Fe i 6302.5 Å with 0.1% photometric accuracy, and a spatial sampling of 016.
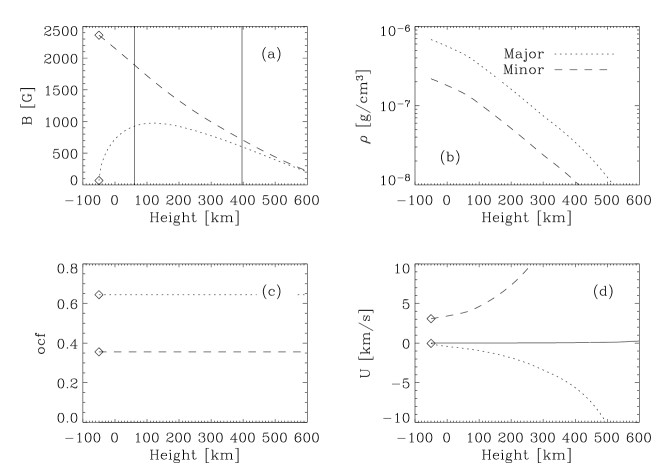
The MISMA inversion procedure described in Sánchez Almeida (1997) provides fair fits in all cases. Two examples are shown in Figs. 3 and 5. The dotted lines in Fig. 3 correspond to one representative reverse polarity site. The fit, shown as solid lines, yields the model atmosphere represented in Fig. 4. The inversions were carried out as described in SA05, and we refer to that paper for details. The only significant difference was the setting up of the absolute wavelength scale, which we zeroed from the average intensity profile in a quiet Sun region far from the sunspot. The wavelength of the core of Fe i 6302.5 Å is assumed to correspond to a global velocity equals to the convective blueshift of the line measured by Dravins et al. (1981). Figures 5 and 6 are similar to Figs. 3 and 4, except that they represent a point with clear blueshift. The model atmospheres are similar, except for the important detail that the minor component does not have reverse polarity in the case of these strongly blueshifted profiles. The four panels in Figs. 4 and 6 represent the stratification with height in the atmosphere of (a) magnetic field strength, (b) density, (c) fraction of atmosphere occupied by each component, and (d) velocity along magnetic field lines. The minor component occupies a significant fraction of the atmosphere (some 40% in the examples in the figures), and it has low density and high field strength. Field strengths and densities are similar to those found in SA05, however, the fraction of atmosphere occupied by the minor component is significantly higher (almost twice the typical 20% in SA05). This is to be expected since we have selected for inversion pixels with particularly large asymmetries, where the contribution of the minor component must exceed the average to cause a significant impact on the Stokes profiles.


We have repeated the exercise leading to the synthetic magnetograms and dopplergrams in Fig. 2, but using the model MISMAs in Figs. 4 and 6. Specifically, we use the profiles in the blueshifted region to represent the bright sides, and the redshifted profiles for the dark core. The result is shown in Fig. 7. The main features of Fig. 2 remain: (1) the bright filament has a dark core, (2) the line-center magnetogram has a weakening coinciding with the dark core, (3) Bright sides are blueshifted with respect to the dark cores, and (4) the far red wing magnetogram shows opposite polarity coinciding with the dark core. Note that features 1–3 are in agreement with SST observations.
A clarification may be appropriate. The association between the Stokes profiles in Fig. 3 and dark cores, and the profiles in Fig. 5 and bright sides is a mere working hypothesis. Hinode spectra barely resolve bright sides and dark cores and, therefore, the used profiles do not correspond to identifiable bright sides and dark cores. We have selected them because they illustrate the properties to be expected for bright sides and dark cores according to the modeling in § 2. Even with limitted resolution, just by chance, some pixels may have enhanced contribution of bright sides and dark cores.

4 Discusion
The model MISMAs by SA05 predict and produce strongly redshifted reverse polarity structures similar to those found by Hinode in penumbrae (§ 1). In addition to pointing out this agreement (§ 2), we have applied the kind of modelling employed by SA05 to quantitatively reproduce some representative very asymmetric Stokes profiles observed by Hinode (§ 3). In order to fit the Stokes profiles with three lobes observed in reverse polarity regions (cross-over profiles), the model MISMAs have two components of opposite polarity in each resolution element. The minor component holds the reverse polarity, and it always carries strong magnetic-field-aligned flows. High spatial resolution SST magnetograph observations of penumbra do not show reverse polarities. They just indicate a weakening of the Stokes signal coinciding with the dark cores (Langhans et al. 2005, 2007). The presence of reverse polarities and the absence of their signals in SST magnetograms can be explained if the dark cores are associated with reverse polarity Stokes profiles. Such association has not been revealed so far because the existing magnetograms were taken at line core, whereas the reverse polarity only shows up at the far red wing of the spectral lines. By tuning the bandpass of SST magnetograms to the appropriate wavelength, this specific prediction of our modeling can be tested observationally444Even if our prediction turns out to be incorrect, the disagreement between Hinode and SST magnetograms is a serious problem that urges solution.. The association between cross-over Stokes profiles and dark cores is still a mere conjecture. However, we would like to mention an independent Hinode/SP observation which also suggests such association. Bellot Rubio et al. (2007) find and discuss the case of a limb-side penumbra dark core which clearly shows cross-over Stokes profiles (see their Fig. 2). As we argue in the introduction, Hinode/SP spatial resolution does not suffice to properly resolve dark cores, but Bellot Rubio et al. observation is encouraging. It indicates that the dark cores are associated with several magnetic field inclinations in the resolution element.
The magnetic fields that we use in § 3 to reproduce the observed asymmetries are rather horizontal. However, the flows along field lines are so intense (in excess of 10 km s-1 in the minor component; see the botton right panels in Figs. 4 and 6) that the vertical component of the velocities are of the order of a few km s-1. Order of magnitude estimates show that 1 km s-1 suffices to explain the transport of energy by convection in penumbra (e.g., Spruit 1987; Stein & Nordlund 1998; Sánchez Almeida 2009). For the transport to be effective, vertical velocities of such magnitude should be present everywhere. It is still unclear whether such large velocities are common enough to be responsible for the required convective transport, and such possibility has to be studied in detail.
Hinode observations show the reversals to prefer the outer penumbra, whereas asymmetric blueshifted profiles (like those in Fig. 5) cluster toward the inner penumbra (Ichimoto et al. 2007). One might think that this fact compromises our interpretation, because dark cores tend to appear in the inner penumbra. However, beware of oversimple interpretations of Hinode spectra. Hinode/SP does not resolve individual dark cores and bright sides, but spatially integrate them. If the bright sides dominate, then the resulting Stokes profiles would show properties of the bright sides, even if the pixel contains a dark core. Actually, blueshifted profiles seem to be associated with bright continuum features, supporting that the bright sides dominate in these points. As one moves toward the outer penumbra, the magnetic field of the bright sides becomes more horizontal, reducing the Stokes signals, and allowing the dark core polarization to show up. In agreement with this conjecture, the reverse polarity patches seem to coincide with dark lanes (Ichimoto et al. 2007).
Insufficient resolution can also be invoked to explain the different morphological appearance of the Hinode polarity reversals and the SST dark cores. Dark cores are elongated features, but the locations of downflows described by Ichimoto et al. (2007) are much more point-like features. Cross-over Stokes signals critically depend on the orientation of the magnetic fields with respect to the line-of-sight. Small modifications of the magnetic field geometry would make the reverse polarity unobservable, overwhelmed by the Stokes signals of the main sunspot polarity. The reverse polarity shows up only when a number of conditions are met, but this need to satisfy several delicate tradeoffs makes the presence of identifiable reverse polarities rare, therefore, they tend to be spatially scattered, discontinuous, and so point-like. On the contrary, these delicate balances do not affect the intensity and, therefore, unpolarized light SST images tend to show more continuous structures with the filamentary appearance characteristic of penumbrae.
A final important comment is in order. Stokes profiles like those in Figs. 3 and 5 have net circular polarization (NCP), i.e., the wavelength integral of the Stokes profile differs from zero. NCP can only be produced by variation of the magnetic field and velocity along the line-of-sight, a well known fact from the early works by Illing et al. (1975) and Auer & Heasley (1978) trying to explain the broad-band circular polarization in sunspots (see, e.g., Sánchez Almeida & Lites 1992, and references therein). This implies that strongly asymmetric Stokes profiles showing NCP will be always present in sunspots, no matter the spatial resolution of the observation across the line-of-sight. Even if we improve the resolution of our telescope to infinity, we will never be able to separate the penumbrae into pixels where the magnetic field is uniform. In other words, resolving the fine scale structure of the penumbral magnetic field is not (only) a question of improving the spatial resolution, but it requires understanding line asymmetries. Whether this understanding requires MISMAs or can be accomplished with a smoother magnetic field distribution is still a matter of debate (e.g., SA05, Sect. 5; Langhans 2006).
Acknowledgements.
Hinode is a Japanese mission developed and launched by ISAS/JAXA, with NAOJ as domestic partner and NASA and STFC (UK) as international partners. It is operated by these agencies in co-operation with ESA and NSC (Norway). The work has partly been funded by the Spanish Ministry of Science and Technology, project AYA2007-66502, as well as by the EC SOLAIRE Network (MTRN-CT-2006-035484). This work was partly carried out at the NAOJ Hinode Science Center, which is supported by the Grant-in-Aid for Creative Scientific Research, The Basic Study of SpaceWeather Prediction from MEXT, Japan (Head Investigator: K. Shibata), generous donations from Sun Microsystems, and NAOJ internal funding.References
- Auer & Heasley (1978) Auer, L. H. & Heasley, J. N. 1978, A&A, 64, 67
- Bellot Rubio (2009) Bellot Rubio, L. R. 2009, in Magnetic Coupling between the Interior and the Atmosphere of the Sun, ed. S. S. Hassan & R. J. Rutten, Astrophysics and Space Science Proceedings (Berlin: Springer-Verlag), in press, arXiv:0903.3619 [astro-ph]
- Bellot Rubio et al. (2007) Bellot Rubio, L. R., Tsuneta, S., Ichimoto, K., et al. 2007, ApJ, 668, L91
- Biermann (1941) Biermann, L. 1941, Vierteljahrsschr. Astr. Gesellsch., 76, 194
- Cowling (1953) Cowling, T. G. 1953, Solar Electrodynamics, ed. G. P. Kuiper (Chicago: The University of Chicago Press), 532
- Dravins et al. (1981) Dravins, D., Lindegren, L., & Nordlund, A. . 1981, A&A, 96, 345
- Ichimoto et al. (2007) Ichimoto, K., Shine, R. A., Lites, B., et al. 2007, PASJ, 59, 593
- Ichimoto et al. (2008) Ichimoto, K., Tsuneta, S., Suematsu, Y., et al. 2008, A&A, 481, L9
- Illing et al. (1975) Illing, R. M. E., Landman, D. A., & Mickey, D. L. 1975, A&A, 41, 183
- Kosugi et al. (2007) Kosugi, T., Matsuzaki, K., Sakao, T., et al. 2007, Sol. Phys., 243, 3
- Landi Degl’Innocenti (1992) Landi Degl’Innocenti, E. 1992, in Solar Observations: Techniques and Interpretation, ed. F. Sánchez, M. Collados, & M. Vázquez (Cambridge: Cambridge University Press), 71
- Langhans (2006) Langhans, K. 2006, in ASP Conf. Ser., Vol. 358, Solar Polarization 4, ed. R. Casini & B. W. Lites (San Francisco: ASP), 3
- Langhans et al. (2005) Langhans, K., Scharmer, G., Kiselman, D., Löfdahl, M., & Berger, T. E. 2005, A&A, 436, 1087
- Langhans et al. (2007) Langhans, K., Scharmer, G. B., Kiselman, D., & Löfdahl, M. G. 2007, A&A, 464, 763
- Mathew et al. (2003) Mathew, S. K., Lagg, A., Solanki, S. K., et al. 2003, A&A, 410, 695
- Rempel et al. (2009) Rempel, M., Schüssler, M., & Knölker, M. 2009, ApJ, 691, 640
- Sánchez Almeida (1997) Sánchez Almeida, J. 1997, ApJ, 491, 993
- Sánchez Almeida (2005) Sánchez Almeida, J. 2005, ApJ, 622, 1292
- Sánchez Almeida (2009) Sánchez Almeida, J. 2009, in Magnetic Coupling between the Interior and the Atmosphere of the Sun, ed. S. S. Hassan & R. J. Rutten, Astrophysics and Space Science Proceedings (Berlin: Springer-Verlag), in press, arXiv:0902.4532 [astro-ph]
- Sánchez Almeida et al. (1996) Sánchez Almeida, J., Landi Degl’Innocenti, E., Martínez Pillet, V., & Lites, B. W. 1996, ApJ, 466, 537
- Sánchez Almeida & Lites (1992) Sánchez Almeida, J. & Lites, B. W. 1992, ApJ, 398, 359
- Scharmer et al. (2002) Scharmer, G. B., Gudiksen, B. V., Kiselman, D., Löfdahl, M. G., & Rouppe van der Voort, L. H. M. 2002, Nature, 420, 151
- Scharmer & Spruit (2006) Scharmer, G. B. & Spruit, H. C. 2006, A&A, 460, 605
- Schlichenmaier (2002) Schlichenmaier, R. 2002, Astron. Nachr., 323, 303
- Schlichenmaier (2009) Schlichenmaier, R. 2009, Space Sci. Rev., 213
- Schmidt & Fritz (2004) Schmidt, W. & Fritz, G. 2004, A&A, 421, 735
- Solanki (2003) Solanki, S. K. 2003, A&A Rev., 11, 153
- Spruit (1976) Spruit, H. C. 1976, Sol. Phys., 50, 269
- Spruit (1987) Spruit, H. C. 1987, in The Role of Fine-Scale Magnetic Fields on the Structure of the Solar Atmosphere, ed. E.-H. Schrö ter, M. Váquez, & A. A. Wyller (Cambridge: Cambridge University Press), 199
- Stein & Nordlund (1998) Stein, R. F. I. & Nordlund, Å. 1998, ApJ, 499, 914
- Stix (1991) Stix, M. 1991, The Sun (Berlin: Springer-Verlag)
- Suematsu et al. (2008) Suematsu, Y., Tsuneta, S., Ichimoto, K., et al. 2008, Sol. Phys., 249, 197
- Thomas (2009) Thomas, J. H. 2009, in Magnetic Coupling between the Interior and the Atmosphere of the Sun, ed. S. S. Hassan & R. J. Rutten, Astrophysics and Space Science Proceedings (Berlin: Springer-Verlag), in press, arXiv:0903.4106 [astro-ph]
- Thomas & Weiss (2004) Thomas, J. H. & Weiss, N. O. 2004, ARA&A, 42, 517
- Tsuneta et al. (2008) Tsuneta, S., Ichimoto, K., Katsukawa, Y., et al. 2008, Sol. Phys., 249, 167
- Westendorp Plaza et al. (2001) Westendorp Plaza, C., del Toro Iniesta, J. C., Ruiz Cobo, B., et al. 2001, ApJ, 547, 1130