The inner environment of protoplanetary disks with near infrared spectro-interferometry
Abstract
In this paper, I review how optical spectro-interferometry has become a particularly well suited technique to study the close environment of young stars, by spatially resolving both their IR continuum and line emission regions. I summarize in which ways optical interferometers have brought major insights about our understanding of the inner part of circumstellar disks, a region in which the first stages of planet formation are thought to occur. In particular, I emphasize how new methods are now enabling to probe the hot gas emission, in addition to the circumstellar dust.
Keywords:
interferometry – star and planet formation – protoplanetary disks – near infrared excess – emission lines:
95.75.Kk, 95.85Jq, 97.10.Bt, 97.10.Gz, 97.10.Me, 97.21.+a, 97.82.Jw1 Introduction
Observing the protoplanetary disks around young stars is a key issue
to understand the first steps of planet formation mechanisms. Such
processes are occurring in the very inner environment of the central
star, at distances of a few Astronomical Units. The representation
that we have today of this environment is sketched in
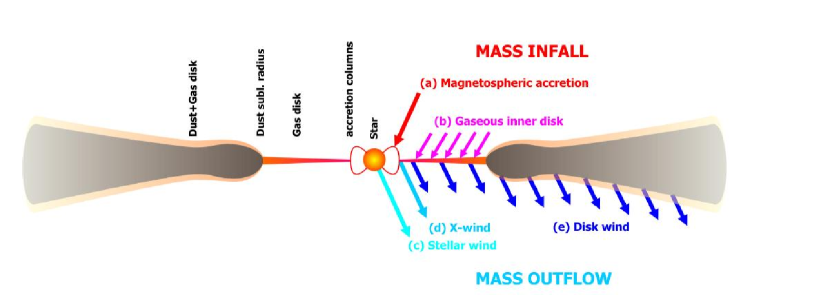
Fig. 1, and is basically composed of i) magnetically-driven
columns of gas accreting on the central star, ii) a gaseous dust-free
rotating disk, iii) a dusty disk which inner rim is located at the
dust sublimation radius; and iv) potentially outflowing winds. Observational clues that we can obtain of the inner part of the
protoplanetary disks are twofold:
From their continuum infrared excess, that arises
from the emission of the hot circumstellar dust and gas. It will give information about the
structure/geometry of the disk as well as about its composition (e.g. grain growth, radial/vertical distribution, mineralogy);
From their infrared emission lines, in particular the
hydrogen lines, that can originate from mainly two different
mechanisms: whether magnetospheric accretion along the accreting columns of
gas (Hartmann et al., 1994) or through magnetically-driven outflows (Shu et al., 1994; Casse and Ferreira, 2000; Sauty et al., 2004).
In order to characterize these mechanisms unambiguously, one needs
both spatial and spectral resolution to localize and separate the
continuum and line emission regions. At distances of the first
stellar formation regions (pc), 1AU corresponds to a
angular distance of mas, a resolution that only
interferometric techniques can achieve. Furthermore, at such
distances from the star, the temperature at the inner region of young
stars is roughly between a few 100K and a few 1000K, that is radiating
at near infrared wavelengths. As a result, near infrared
spectro-interferometry which provides both the spatial and spectral
resolution required at the desired wavelengths
appears to be a technique perfectly suited to
observe the inner environment of protoplanetary disks.
2 Origin of the near infrared excess: the K-band size-luminosity relationship
By observing young stars at near infrared wavelengths, interferometry has enabled to locate the emission region responsible for the continuum infrared excess, and potentially constraint its structure. And such dimensional constraints appeared to be critical to unveil the physical origin of this emission, both for low (T Tauri) and intermediate (Herbig Ae/Be) mass young stars.
2.1 Herbig Ae/Be stars: thermal emission of the dusty inner rim
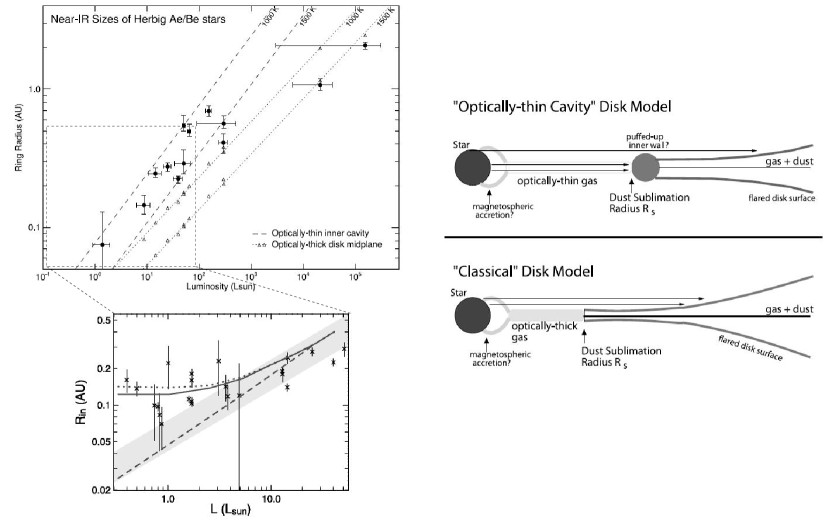
Monnier et al. (2005); Vinković and Jurkić (2007) have shown on a sample of Herbig Ae/Be stars that the interferometric size of the K-band emission was correlated with the star luminosity, as illustrated on Fig. 2 (left). From this correlation they have demonstrated that the near infrared excess of such stars was – at the exception of the most luminous ones – arising from the thermal emission of the inner part of the dusty circumstellar disk, located at the dust sublimation radius, assuming that the dust is in equilibrium with the radiation field (ie ,where is the dust sublimation temperature, roughly K for silicates). If this scenario works well for Herbig Ae stars and late Be, it however fails to interpret the size of the infrared excess emission region for the early Be, the inner rim being too close to the star regarding their high luminosity. In this case, one likely interpretation is that the gas inside the dust sublimation radius is optically thick to the stellar radiation, hence shielding a fraction of the stellar light and allowing the dusty inner rim to move closer to the star, as sketched on Fig. 2 (right).
2.2 T Tauri stars: a strong contribution of the scattered light
Together with the last improvements of interferometers in terms of sensitivity, it is only recently that the same kind of study could have been performed on the less luminous T Tauri stars. And the results that have been obtained were somewhat surprising, the size of the NIR emission being larger than predicted (Akeson et al., 2005; Eisner et al., 2007a, 2005). Many hypothesis were invoked such as lower sublimation temperature K, fast dissipation of the inner disk, magnetospheric radii bigger than dust sublimation ones hence defining the location of the inner rim… until Pinte et al. (2008) have shown that as long as the luminosity of the star decreases, the contribution of the scattered light, in addition to that of the thermal emission, could not neglected anymore. As a consequence, as shown inf Fig. 2, these authors have convincingly demonstrated that the model of the inner disk located at the dust sublimation radius was holding for the T Tauri regime as well, and that no alternative scenario was required as long as the radiative transfer in the disk was thoroughly studied (thermal + scattered light).
3 Resolving the hot gas continuum emission
Though dust is mostly dominating the near infrared continuum emission
of young stars, there are some cases, especially for stars where the accretion
rate is high enough – roughly /yr – where the
contribution of the dust-free hot gaseous component to the NIR excess is not
negligible. Since the dust-free gas is located between the star and
the dust sublimation radius, we expect the region of emission to be
hotter and more compact than that of the dusty inner
rim. As a consequence, going towards shorter wavelengths or longer
baselines appear to be well suited strategies to probe this region.

In this framework, Isella et al. (2008) have observed the Herbig Ae star
MWC 758 with the AMBER
instrument on the VLTI, both in the H and K bands. They have shown that, if the K band observations alone are well interpreted by the classical
dusty puffed-up inner rim (K, AU), it
fails to reproduce the H band observations for which the emission is
less resolved than expected by this model. Furthermore, with this single
model, the SED can be not fitted successfully, showing a lack of
energy in the H band. Conversely, by adding to the model the presence
of an unresolved hotter component (of K), they managed
to reproduce both the H and K bands measurements jointly. Note that
this changes slightly the parameters of the dusty rim (K, AU). What was then the physical interpretation
for this unresolved component? Given the temperature and the size
(AU) of the emission region, it is likely that AMBER has
directly probed the hot gas accreting close to to the
star. And indeed, models of accreting gas developed by
Muzerolle et al. (2004) (assuming an accretion rate of from the star’s
luminosity), allow as well to satisfactory fit the shape of the SED by
filling the lack of energy in the H band (see Fig. 3), hence
reinforcing this interpretation.
Somewhat similar strategy was used by Eisner et al. (2007b) who observed
different Herbig Ae/Be stars with the KecK interferometer, using moderate
spectral dispersion (R=25) within the K-band. They hence have found that for
several stars of their sample, single-temperature ring could
not reproduce the data well, and that models incorporating radial
temperature gradients or two rings should be preferred, supporting the
view that the near-IR emission of Herbig Ae/Be sources can arise from
both hot circumstellar dust and gas. For example, the interferometric
data of AB Aur require the presence of one dust inner rim together
with a more compact and hotter component (K) interpreted
as coming from the hot dust-free inner gas. And as a matter of fact,
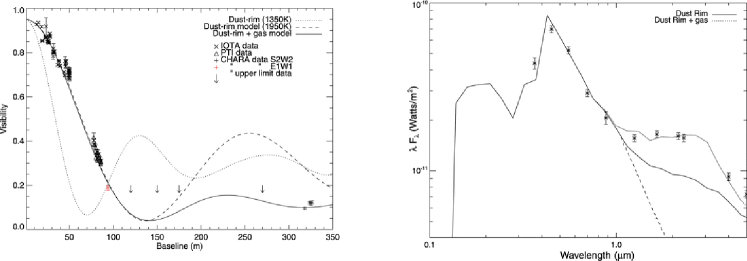
this scenario was confirm by Tannirkulam et al. (2008) who observed the
same star with the very long baselines (m) of the CHARA
interferometer, hence probing smaller emission region and showing the
need of adding smooth hot (K) emission inside the dust inner
rim, contributing to of the K-band excess, as summarized in
Fig. 4.
4 The origin of NIR emission lines
One major achievement in interferometry in the past years is the capacity of spectrally dispersed the interferogram with resolution high enough (AMBER/VLTI: R=1500, and very recently KecKI: R=1700, that is some km/s) to spatially resolve the lines emission regions together with that of the continuum, that is to directly probe the gas which constitutes of the mass of the circumstellar matter.
4.1 The origin of emission in Herbig Ae/Be stars: probing the accretion/ejection phenomena:
Among all the NIR emission lines that are seen in young stars, the
atomic transition of the hydrogen is the most
observed in spectro-interferometry for it is the brightest and can
therefore be studied with rather good signal to noise ratio. However,
since (i) the number of measurements remains poor in classical
interferometric observations (two or 3 baselines simultaneously) and
(ii) the spectral resolution is not high enough to spectrally
resolve the line, the interferometric measurements must be, so far,
interpreted in terms of simple geometrical models. The analysis is
done as follows: measure the size of the emitting region for both the
emission line and the surrounding continuum, then compare their
relative size to put some strong constraints on the physical
mechanisms at the origin of the emission line. Typically, as described
in introduction, two main scenarios are in balance:
- magnetospheric accretion: If the line is emitted in
accreting columns of gas, then the region of emission lies roughly between
the star and the corotation radius, that is the line emission region
is much more compact than that of the continuum which comes from
the dust sublimation radius, as described in previous Section.
- outflowing winds/jets: At the contrary, for such scenario,
we expect the line emitting region to be of the same size or bigger
than that of the continumm.
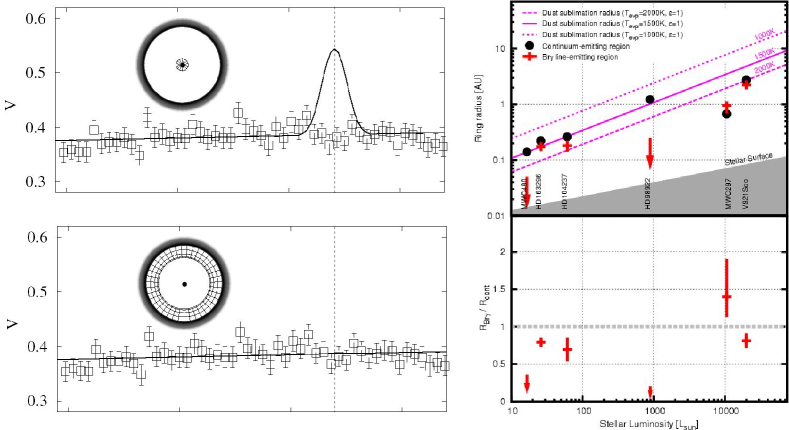
Using the AMBER instrument, Malbet et al. (2007); Tatulli et al. (2007); Kraus et al. (2008) have observed a
sample of Herbig Ae/Be stars that displayed strong
lines and have performed for each star the geometrical analysis
described above, that is by comparing the size of the line emitting
region with respect to that of the continuum, as illustrated in Fig. 5.
As a result, if for two stars
(HD98922, MWC480) the interferometric measurements were compatible with
the magnetospheric-accretion for the origin of their
emission, the wind scenario was favored for four
of them (MWC275, MWC297, V921Sco, HD104237). Taken statistically,
these results are quite interesting to analyze:
at the contrary of T Tauri stars for which the direct
correlation between accretion and emission seems well
established, in Herbig Ae/Be stars we are mostly probing outflows
phenomena from emission, this latter being
probably in this case an indirect tracer of accretion through
accretion-driven mass loss.
4.2 The origin of CO overtone emission: probing the hot molecular gas
Whereas is a good tracer of whether magnetospheric accretion or outflowing winds, some other lines such as the CO overtone emission at m are also of great interest to directly probe the hot rotating gas. One problem however is that only a few young stars display strong enough CO lines to be observed with spectro-interferometry. 51 Oph is one these stars (Thi et al., 2005; Berthoud et al., 2007), and Tatulli et al. (2008) have recently presented the first interferometric observations of this young star around the CO overtone emission, using the AMBER instrument with the resolution of 1500. They have shown that: (i) the hot CO emission was resolved, located at a distance of AU from the star, thus in agreement with the scenario in which the CO is emitted from the first AU of a rotating gaseous disk (Thi et al., 2005), (ii) the two first bandheads are arising from the same emitting region, and (iii) the adjacent continuum is located at a distance of AU, that is too close to the star compared to the location of the sublimation radius, suggesting that the stellar light is shielded by the optically thick gas hence moving the sublimation radius closer to the star, and/or that the hot gas inside the dust sublimation radius significantly contributes to the observed 2 m emission (free-free emission).
5 Prospects and expected developments
Although optical interferometry has undergone significant improvements
in the past few years that have enabled to increase our understanding
of the inner part of protoplanetary disks on a growing sample of young
stars, some instrumental limitations yet prevent to unambiguously draw
a comprehensive picture of their environment. Strong efforts are
now undertaken to improve the capabilities of current and future
interferometers, which can
be summarized around three main axes:
- increasing the flux sensitivity: thanks to dedicated fringe
tracking/phase referencing devices, a better sensitivity will enable to
observe (i) lower mass sources and (ii) fainter NIR emission lines
which will be fully complementary of the line to
characterize the rotating gas and the accretion/ejection phenomena
(CO, Fe, Pa ,…).
- going to higher spectral resolution: a better sensitivity
will also allow to use spectrographs performing higher resolution,
with conserving enough flux in each spectral channel. Typically, a
spectral resolution of (i.e. a few tens of km/s) will
enable to spatially and spectrally resolve the emission lines,
and will as well provide the velocity maps of their emitting regions,
putting to a test e.g. the rotation at the base of the jets
(Bacciotti et al., 2003), or the keplerian nature of the rotating gas.
- developing the imaging capabilities: an increased number
of telescopes simultaneously recombined (typically 6 or more
(Filho et al., 2008)) is indeed mandatory to obtain enough measurements
to obtain snapshot (i.e. in a few nights of observations at most)
images of the inner environment of young stars, allowing to (i) set
free from simple geometrical model-dependant analysis of the
physical mechanisms at play and (ii) perform a temporal follow up of
sources in
adequacy with the dynamics at stake within the first AU of the protoplanetary disks.
References
- Hartmann et al. (1994) L. Hartmann, R. Hewett, and N. Calvet, Astrophysical Journal 426, 669–687 (1994).
- Shu et al. (1994) F. Shu, J. Najita, E. Ostriker, F. Wilkin, S. Ruden, and S. Lizano, Astrophysical Journal 429, 781–796 (1994).
- Casse and Ferreira (2000) F. Casse, and J. Ferreira, Astron. & Astrophys. 353, 1115–1128 (2000).
- Sauty et al. (2004) C. Sauty, E. Trussoni, and K. Tsinganos, Astron. & Astrophys. 421, 797–809 (2004).
- Kraus et al. (2008) S. Kraus, K.-H. Hofmann, M. Benisty, J.-P. Berger, O. Chesneau, A. Isella, F. Malbet, A. Meilland, N. Nardetto, A. Natta, T. Preibisch, D. Schertl, M. Smith, P. Stee, E. Tatulli, L. Testi, and G. Weigelt, Astron. & Astrophys. 489, 1157–1173 (2008).
- Monnier et al. (2005) J. D. Monnier, R. Millan-Gabet, R. Billmeier, R. L. Akeson, D. Wallace, J.-P. Berger, N. Calvet, P. D’Alessio, W. C. Danchi, and L. e. a. Hartmann, Astrophysical Journal 624, 832–840 (2005).
- Vinković and Jurkić (2007) D. Vinković, and T. Jurkić, Astrophysical Journal 658, 462–479 (2007).
- Pinte et al. (2008) C. Pinte, F. Ménard, J. P. Berger, M. Benisty, and F. Malbet, Astrophysical Journal, Letters 673, L63–L66 (2008).
- Akeson et al. (2005) R. L. Akeson, A. F. Boden, J. D. Monnier, R. Millan-Gabet, C. Beichman, J. Beletic, N. Calvet, L. Hartmann, L. Hillenbrand, C. Koresko, A. Sargent, and A. Tannirkulam, Astrophysical Journal 635, 1173–1181 (2005).
- Eisner et al. (2007a) J. A. Eisner, L. A. Hillenbrand, R. J. White, J. S. Bloom, R. L. Akeson, and C. H. Blake, Astrophysical Journal 669, 1072–1084 (2007a).
- Eisner et al. (2005) J. A. Eisner, L. A. Hillenbrand, R. J. White, R. L. Akeson, and A. I. Sargent, Astrophysical Journal 623, 952–966 (2005).
- Isella et al. (2008) A. Isella, E. Tatulli, A. Natta, and L. Testi, Astron. & Astrophys. 483, L13–L16 (2008).
- Muzerolle et al. (2004) J. Muzerolle, P. D’Alessio, N. Calvet, and L. Hartmann, Astrophysical Journal 617, 406–417 (2004), arXiv:astro-ph/0409008.
- Eisner et al. (2007b) J. A. Eisner, E. I. Chiang, B. F. Lane, and R. L. Akeson, Astrophysical Journal 657, 347–358 (2007b).
- Tannirkulam et al. (2008) A. Tannirkulam, J. D. Monnier, T. J. Harries, R. Millan-Gabet, Z. Zhu, E. Pedretti, M. Ireland, P. Tuthill, T. ten Brummelaar, H. McAlister, C. Farrington, P. J. Goldfinger, J. Sturmann, L. Sturmann, and N. Turner, Astrophysical Journal 689, 513–531 (2008), 0808.1728.
- Malbet et al. (2007) F. Malbet, M. Benisty, W.-J. de Wit, S. Kraus, A. Meilland, F. Millour, E. Tatulli, J.-P. Berger, O. Chesneau, and K.-H. e. a. Hofmann, Astron. & Astrophys. 464, 43–53 (2007).
- Tatulli et al. (2007) E. Tatulli, A. Isella, A. Natta, L. Testi, A. Marconi, F. Malbet, P. Stee, R. G. Petrov, F. Millour, and A. e. a. Chelli, Astron. & Astrophys. 464, 55–58 (2007).
- Thi et al. (2005) W.-F. Thi, B. van Dalen, A. Bik, and L. B. F. M. Waters, Astron. & Astrophys. 430, L61–L64 (2005).
- Berthoud et al. (2007) M. G. Berthoud, L. D. Keller, T. L. Herter, M. J. Richter, and D. G. Whelan, Astrophysical Journal 660, 461–468 (2007).
- Tatulli et al. (2008) E. Tatulli, F. Malbet, F. Ménard, C. Gil, L. Testi, A. Natta, S. Kraus, P. Stee, and S. Robbe-Dubois, Astron. & Astrophys. 489, 1151–1155 (2008).
- Bacciotti et al. (2003) F. Bacciotti, L. Testi, A. Marconi, P. J. V. Garcia, T. P. Ray, J. Eislöffel, and C. Dougados, Astrophysics and Space Science 286, 157–162 (2003).
- Filho et al. (2008) M. E. Filho, S. Renard, P. Garcia, G. Duvert, G. Duchene, E. Thiebaut, J. Young, O. Absil, J.-P. Berger, and T. e. a. Beckert, “Phase closure image reconstruction for future VLTI instrumentation,” in SPIE Conference Series, 2008, vol. 7013.