AGN FEEDBACK IN THE COMPACT GROUP OF GALAXIES HCG 62 – as revealed by Chandra, XMM and GMRT data
Abstract
As a part of an ongoing study of a sample of galaxy groups showing evidence for AGN/hot gas interaction, we report on the preliminary results of an analysis of new XMM and GMRT data of the X-ray bright compact group HCG 62. This is one of the few groups known to possess very clear, small X-ray cavities in the inner region as shown by the existing Chandra image. At higher frequencies (1.4 GHz) the cavities show minimal if any radio emission, but the radio appears clearly at lower frequencies (610 MHz). We compare and discuss the morphology and spectral properties of the gas and of the radio source. We find that the cavities are close to pressure balance, and that the jets have a ”light” hadronic content. By extracting X-ray surface brightness and temperature profiles, we also identify a shock front located around 35 kpc to the south-west of the group center.
Keywords:
galaxies:clusters:general – cooling flows – intergalactic medium – galaxies:active – X-rays:galaxies:clusters:
98.65.Bv;98.65.Hb1 Introduction
The work presented here is part of an ongoing project aimed at combining X-ray and low-frequency radio observations of galaxy groups. In particular, we have selected a compilation of 18 galaxy groups based on the presence of signs of interaction between the hot gas and the central AGN. For these groups, which all have already good quality X-ray data in the archives of Chandra and/or XMM, we have obtained new radio data at the Giant Metrewave Radio Telescope (GMRT) at 610 MHz and below (Giacintucci et al. 2008, and these proceedings; Raychaudhury et al. 2009) in order to investigate the AGN feedback process.
HCG 62 (z=0.0137), the X-ray brightest of the Hickson compact groups, was the first galaxy group with a clear detection of inner cavities (Vrtilek et al. 2002). The existing 1.4 GHz VLA observations mainly show the emission from the compact radio source and indicate only some hints of extended radio emission toward the southern cavity. Due to the poor radio images available, the HCG 62 cavity system was classified as “radio ghost” in the sample of Bîrzan et al. (2004).
We present here new low frequency radio observations of HCG 62 that allow us to study the X-ray/radio interaction in detail. With , and , its luminosity distance is 59 Mpc and 1 arcsec corresponds to 0.28 kpc.
2 X-ray / Radio Interaction
2.1 X-ray and radio observations
For our analysis, we use the X-ray data available in the archives of Chandra and XMM. In the 50 ks Chandra image the two cavities are clearly visible, but we also notice a discontinuity in the surface brightness distribution toward the south-west (SW) direction that we interpret as a shock front (see below). The combination of this exposure with a more recent observation of 100 ks obtained with XMM allows us to determine with unprecedented accuracy the X-ray properties of the hot gas.
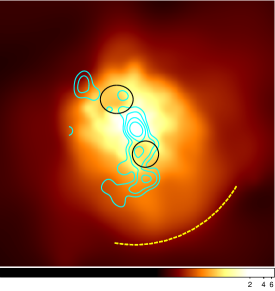
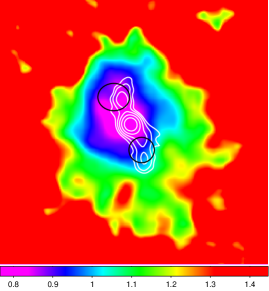
We observed HCG 62 with the GMRT in February 2008 for an effective time of 2h at 610 MHz and 235 MHz (project 13SGa01). At both frequencies, we detect clearly extended emission emanating from the core in the form of two radio lobes pointing toward the northern (N) and southern (S) cavities. The overlay of the 235 MHz radio contours on the smoothed Chandra image is shown in Fig. 1 (left), whereas the overlay of the 610 MHz radio contours on the XMM temperature map (see below) is shown in Fig. 1 (right). It is evident that far more extensive structures become visible at lower frequencies: the radio emission at 235 MHz is more extended, with two faint regions located just outside the cavities and apparently bent toward the east direction.
This radio source is classified as a weak FR-I ( W Hz-1), and its spectral index111 is steep compared to that of typical radio galaxies.
2.2 Energy budget and pressure
Cavities (and the associated shock fronts, see below) act as calorimeters for the total energy output of the AGN. The total cavity power of HCG 62 is estimated from the X-ray data to be erg s-1 (Rafferty et al. 2006). This is about twice the luminosity of the ICM inside the cooling region, so the AGN outburst should be currently supplying enough energy to balance the cooling in this system. In fact, since the 235 MHz radio emission extends beyond the cavities we may argue that there is more power in the jet and lobes than one can infer from the X-rays. The cavity volumes may be larger as the radio emission is less sensitive to projection effects than depressions in the X-ray image (as also pointed out by Bîrzan et al. 2008).
Thanks to the new good-quality radio data, we can compare the AGN mechanical power with the radio luminosity of the source in order to directly estimate its radiative efficiency. By assuming a spectral index , we measure the total radio luminosity over the frequency range of 10 MHz - 10 GHz to be erg s-1 , which is about four orders of magnitude less than the total power of the cavities. Therefore the radio source in HCG 62 has a very low synchrotron radiative efficiency ().
Since the radio source is filling the cavities, we can also compare directly the radio pressure internal to the lobes with the X-ray pressure of the surrounding thermal gas. The pressure of the thermal gas is measured from the density and temperature derived from the X-ray data. The radio pressure can be estimated under the assumption that the relativistic plasma is in equipartition with the magnetic field. In particular, we assume the so-called “revised” equipartition conditions (Brunetti et al. 1997) that include also the contribution of the low-energy electrons (the Lorentz factor is as low as 100). We estimate that the ratio of X-ray pressure to radio pressure is a factor of a few, and in particular the S cavity is very close to pressure balance. On the other hand, we can also determine the ratio of the energy in protons to that in electrons that is required to achieve pressure balance (e.g,. Dunn et al. 2005, Bîrzan et al. 2008), finding that we have to allow for hadronic jets with a relatively low value of (10-30).


2.3 Shock front and temperature distribution
The surface brightness profile extracted along the SW sector (Fig. 2, left) shows a clear jump at kpc from the center. We derive the temperature profile along the same sector (Fig. 2, right) and find that the region immediately interior of the front is significantly hotter than the undisturbed region just outside of it, with a temperature jump across the front of 14%. Our data are consistent with the presence of a shock having a Mach number = 1.45, an energy erg, and a power which is about twice the cavity power. The position of the front, just outside the S radio lobe, makes plausible the interpretation of the shock as being directly driven by the lobe expansion triggered by the AGN outburst. If so, the cavity power alone provides a lower limit to the true total mechanical power of the AGN, as the shock will add to this.
The shock might explain the lack of very cool (0.9 keV) material on the SW side of the core. In Fig. 1 (right) is shown the temperature map obtained with XMM by using four X-ray colors and estimating the expected count rate with XSPEC for a thermal mekal model. Besides the cool core, we notice the presence of a low-temperature region along the N cavity limbs. The lack of a comparable feature at the position of the S cavity edge might imply that the cool blob extending N of the core once had a symmetric counterpart on the S side, but this was then heated by the passage of the shock.
3 Summary
-
1.
Our analysis demonstrates the power of a combined X-ray/radio approach to the feedback problem, and particularly the benefits of extending radio studies of AGNs to low frequencies where less energetic, older electron populations are visible.
-
2.
As opposed to the early classification of the HCG 62 cavity system as “radio ghost”, low-frequency radio emission is detected in the cavities by the new GMRT data.
-
3.
We identify a Mach 1.5 shock front located 35 kpc to the SW, not reported previously in literature. The total energy in cavities and shock is erg.
References
- (1) Bîrzan, L. et al. 2004, ApJ, 607, 800
- (2) Bîrzan, L. et al. 2008, ApJ, 686, 859
- (3) Brunetti, G. et al. 1997, A&A, 325, 898
- (4) Dunn, R. J. H. et al. 2005, MNRAS, 364, 1353
- (5) Giacintucci, S. et al. 2008, ApJ, 682, 186
- (6) Rafferty, D. A. et al. 2006, ApJ, 652, 216
- (7) Raychaudhury, S. et al. 2009, in The Low-Frequency Radio Universe, arXiv:0907.0895
- (8) Vrtilek, J. M. et al. 2002, American Phys. Soc. Meeting, B17.107