Phase diagram and isotope effect in (Pr1-yEuy)0.7Ca0.3CoO3 cobaltites exhibiting spin-state transitions
Abstract
We present the study of magnetization, thermal expansion, specific heat, resistivity, and a.c. susceptibility of (Pr1-yEuy)0.7Ca0.3CoO3 cobaltites. The measurements were performed on ceramic samples with and . Based on these results, we construct the phase diagram, including magnetic and spin-state transitions. The transition from the low- to intermediate-spin state is observed for the samples with , whereas for a lower Eu-doping level, there are no spin-state transitions, but a crossover between the ferromagnetic and paramagnetic states occurs. The effect of oxygen isotope substitution along with Eu doping on the magnetic/spin state is discussed. The oxygen-isotope substitution (16O by 18O) is found to shift both the magnetic and spin-state phase boundaries to lower Eu concentrations. The isotope effect on the spin-state transition temperature () is rather strong, but it is much weaker for the transition to a ferromagnetic state (). The ferromagnetic ordering in the low-Eu doped samples is shown to be promoted by the Co4+ ions, which favor the formation of the intermediate-spin state of neighboring Co3+ ions.
pacs:
71.30.+h, 75.30.-m, 75.25.+z, 72.80.GaI Introduction
Perovskite-based mixed-valence oxides with the general formula O3, where , , and are rare-earth, alkali-earth, and transition-metal elements, respectively, have attracted a lot of interest due to a rich variety of their electronic and magnetic states. These transition-metal oxides exhibit different ordering phenomena and phase transitions, e.g., antiferromagnetic (AFM) and/or ferromagnetic (FM) order, charge and/or orbital orderings, metal-insulator transitions.Imada et al. (1998) The interplay of different degrees of freedom and different types of ordering is a very important ingredient in determining the properties of such strongly correlated electron systems. These effects become especially interesting in doped materials, which may exhibit a tendency to phase separation and to the formation of inhomogeneous states.Khomskii (2000); Kagan and Kugel (2001); Dagotto (2003)
In addition to these phenomena common to most doped oxides, cobaltites have an extra “degree of freedom”, namely, the Co3+ ions in them may occur in different spin states (belonging to different multiplets): low-spin (LS; spin ; ), intermediate-spin (IS; ; ), or high-spin (HS; ; ) states with the possibility of spin-state transitions (SST) between them caused, e.g., by temperature, pressure, or doping.Jonker and Van Santen (1953); Goodenough and Raccah (1965); Señarís-Rodríguez and Goodenough (1995); Asai et al. (1998); Saitoh et al. (1997); Tokura et al. (1998) The existence of a spin-state change indicates that the difference of the electronic energies, , between these states is rather small. The most prominent example is LaCoO3, which was actively studied and controversially debated for more than 50 years.Jonker and Van Santen (1953); Goodenough and Raccah (1965); Señarís-Rodríguez and Goodenough (1995); Korotin et al. (1996); Asai et al. (1998); Saitoh et al. (1997); Tokura et al. (1998); Yamaguchi et al. (1997); Kobayashi et al. (2000); Sato et al. (2008); Zobel et al. (2002); Berggold et al. (2008) It is generally agreed that Co3+ ions in LaCoO3 are in the LS state at low temperatures. Above approximately 25 K, a higher-spin state, either IS or HS, becomes thermally populated affecting various physical properties, e.g., magnetic susceptibility or thermal expansion , which both exhibit pronounced peaks in their temperature dependence.Zobel et al. (2002); Baier et al. (2005); Berggold et al. (2008) The susceptibility is naturally affected because the excited spin state (IS or HS) induces a significant increase in the magnetization. The thermal expansion is affected due to the different ionic radii: the LS Co3+ ions with empty orbitals are significantly smaller than the IS or HS Co3+ ions with partially filled orbitals. It should be noticed that there are some structural (neutron diffraction) data,Tong et al. (2009); Tsubouchi et al. (2002); Fujita et al. (2004) which show almost no change in the average Co–O bond lengths from 4 to 300 K for A-cite substituted cobaltites with the SST. Instead, a distortion of CoO6 octahedra takes place upon the SST giving rise to an almost unchanged unit cell volume.Tong et al. (2009) In Ref. Tsubouchi et al., 2002 the nearly constant average Co–O bond-length on the SST is attributed to the stronger covalency in the high-temperature phase.
In undoped LaCoO3, there is not yet a general consensus whether the excited state is IS or HS. For example, our earlier thermal-expansion and magnetic measurements Zobel et al. (2002) were interpreted in terms of a temperature-induced excitation of a triplet state, which may suggest that this excited state is an IS Co3+ (). However, in the presence of a strong spin-orbit coupling, typical for Co with partially filled levels, it is the HS Co3+ which has a triplet ground state with a total effective moment .Podlesnyak et al. (2006); Haverkort et al. (2006); Ropka and Radwanski (2003); Haverkort (2005) This led to the conclusion that the thermally excited state in undoped LaCoO3 is most probably the HS state Podlesnyak et al. (2006); Noguchi et al. (2002); Haverkort et al. (2006) in contrast to many earlier claims.Korotin et al. (1996); Tokura et al. (1998); Zobel et al. (2002); Baier et al. (2005) This conclusion is still disputed.Phelan et al. (2008, 2009)
In hole-doped cobaltites, the situation is even more complex. One can argue that due to the presence of low-spin Co4+, it would be indeed the IS state of Co3+, which is created close to a hole;Podlesnyak et al. (2006, 2008); Phelan et al. (2008) this would allow for a free motion of a hole within a cluster of LS Co4+ and neighboring IS Co3+ ions.Berggold et al. (2008); Maignan et al. (2004); Kriener et al. (2004) In the itinerant case, the stabilization of a state due to spin-orbit interaction would also become questionable. Thus, based on these arguments, as well as on the results of Ref. Podlesnyak et al., 2008, we conclude that the most plausible scenario is that the doped holes promote a certain amount of Co3+ to an IS state, with holes moving in a respective Co4+/Co3+ cluster. Due to the usual double exchange Zener (1951); de Gennes (1960) such clusters would then be ferromagnetic.
The SST in CoO3 is strongly affected by both heterovalent and isovalent doping at the site. The heterovalent doping (CoO3; = Ba, Sr, and Ca) causes hole doping and chemical pressure (arising from the change of the ionic radii in the complex) and stabilizes a magnetic (IS or HS) state of Co3+.Kriener et al. (2004, 2009) For the relatively large atomic species = La and = Ba or Sr, the nonmagnetic (LS) insulating ground state of CoO3 changes to a ferromagnetic metal at high enough hole concentration, which is due to the enhancement of the double exchange interaction caused by the decrease of and an increase in the number of electrons at the orbitals. The isovalent doping with a smaller rare-earth, i.e., chemical pressure without changing the Co valence, is usually realized by introducing other trivalent rare-earth ions . In that case, the LS state of Co3+ ions is stabilized and the spin-state transition is shifted to a higher temperature. For example, the energy gap between the LS and the excited spin state increases from about K for = La to K for = Eu.Baier et al. (2005) In addition, with decreasing ionic radius in the lanthanide series, the structure changes from rhombohedral in LaCoO3 to orthorhombic for = Pr, Nd, and Eu.Berggold et al. (2008) The changes in the ionic radius can be also fine-tuned by mixing elements with different ionic radii. In this situation, the partial substitution of by a smaller in ()CoO3 systematically increases the chemical pressure, which should enhance the crystal field splitting and therefore stabilize the low-spin state.Baier et al. (2005); Fujita et al. (2005) Thus, small changes in the lattice characteristics may critically determine the physical properties of cobaltites.
Phenomena, for which the crystal lattice plays a significant role, usually show a strong isotope effect, and vice versa studies of the isotope effect can yield important information about the underlying mechanisms. One famous example is the isotope effect in conventional superconductors, which led to the conclusion that in these systems the electron pairing is caused by the electron-phonon interaction. In some cases, especially if the system is close to a crossover between different states, an isotope substitution can drastically change the properties of the system. For example, in manganites, one can even induce a metal-insulator transition by substituting 16O by 18O.Babushkina et al. (1998a) Moreover, the isotope substitution can be also used for fine-tuning the behavior of a system, without stronger disturbances such as those caused, e.g., by doping (which introduce extra disorder). In this sense, the isotope substitution is an even “softer” way to control the behavior of a material. For cobaltites with the SST, we can expect a particularly pronounced isotope effect because of the strong involvement of the lattice in it due to the fact that the ionic radii of different spin states are very different: the ionic radius of HS Co3+ () is by about 15% larger than that for the LS state ().
Indeed, the first measurements Wang et al. (2006a, b) have already demonstrated the existence of an oxygen isotope effect in cobaltites with spin-state transitions. With increasing in (Pr1-xSmx)0.7Ca0.3CoO3, a crossover from a ferromagnetic metal to an insulator exhibiting a spin-state transition was found. The authors observed Wang et al. (2006a, b) that the oxygen isotope substitution strongly shifts the spin-state transition temperature in the insulating phase, but only slightly affects the ferromagnetic transition point . This contrasting behavior in the two phases was explained by the occurrence of static Jahn-Teller (JT) distortions in the insulating phase and the absence of them in the metallic phase. Here, a remark should be made. The Co3+ ions in the IS state have formally the configuration, i.e., they indeed could exhibit a pronounced JT effect. However, if the corresponding electrons are itinerant, which seems to be the case in our system, one should not expect a strong JT effect. Therefore, we do not think that the coupling to the lattice in this case has predominantly a JT character, as assumed in Ref. Wang et al., 2006b; rather, simply the difference of the ionic sizes of the LS and the IS or HS states of Co3+ should play the most important role here.
In the present study, we tried to clarify the nature of the strong difference in the character of the magnetic/spin-state transition for the “metallic” and “insulating” ground states. For this, in particular, we used the oxygen isotope exchange to influence the crystal-field splitting without additional effects of static distortions. For these purposes, the (Pr1-yEuy)0.7Ca0.3CoO3 () series with 16O and 18O were studied. This series was chosen to span the range of ground states from metal-like to insulating ones. We measured d.c. magnetization, low-frequency a.c. magnetic susceptibility, thermal expansion, specific heat, and resistivity. Based on these results, we have constructed a detailed phase diagram representing different magnetic and spin states. We find that with increasing Eu doping, that is, with decreasing average size of (Pr1-yEuy) or increasing chemical pressure, the ground state of the compound changes from a “ferromagnetic metal” to a “weakly-magnetic insulator” at . A pronounced SST is present in the insulating ground state (in the samples with ). The metallic ground state (in the samples with has completely different magnetic properties, without any indications of a temperature-induced spin-state transition. There is even no well-defined magnetic transition as a function of temperature for this phase. Instead, a smooth crossover to a paramagnetic state takes place. The isotope exchange affects strongly the SST temperature in the insulating regime, but has only a marginal effect on the crossover temperature in the samples with the metallic ground state. Possible implications of the spin ordering of Co4+ ions for the spin-state transition are also discussed.
II Experimental details
II.1 Samples
In our measurements, we used ceramic (Pr1-yEuy)0.7Ca0.3CoO3 samples with both 16O and 18O. A series of samples with was synthesized. The substitution of Pr by Eu results in the decrease of the average ionic radius of the rare-earth combination. This enhances the static crystallographic distortion and is followed by an increase of the crystal-field splitting that should result in a stabilization of the low-spin state against the temperature-activated spin-state transition to the intermediate- or high-spin state. The Pr and Eu content in (Pr1-yEuy)0.7Ca0.3CoO3 was chosen from the data on ionic radii from Shannon’s tables Shannon (1976) for nine-fold coordination of rare-earth and alkaline-earth cations, which is usually accepted for cobaltites with orthorhombic symmetry of the perovskite structure. The chosen stoichiometries span the mean rare-earth radius in the range from 1.172 Å to 1.164 Å, for . The end-member of this series, Eu0.7Ca0.3CoO3, was also studied and some results obtained earlier Berggold et al. (2008); Baier et al. (2005) on CoO3 with = La, Pr, Nd, Eu are referred below for comparison. The (Pr1-yEuy)0.7Ca0.3CoO3 samples were prepared by the “paper synthesis” technique:Balagurov et al. (1999) ash-free paper filters were impregnated with an aqueous solution of a mixture of nitrates of the corresponding metals, dried at 120∘C, and then burnt. The resultant powder was annealed at ∘C for 2 h for decarbonization. After pressing, the ceramics were sintered at ∘C for 100 h. The X-ray analysis with Rigaku SmartLab diffractometer (using Cu irradiation, Å) demonstrated that the samples are single-phase without observable admixture of impurity phases (Fig. 1). All the data were indexed in the orthorhombic lattice . No structure modification was observed with Eu-doping. The unit cell volume was found to decrease from 216.5 Å3 for to 215.7 Å3 for that agrees well with the data of Fujita et al. Fujita et al. (2004, 2005) obtained by both X-ray and neutron diffraction techniques. The unit cell volume for our series is about 0.15% smaller as compared to the (Pr1-ySmy)Ca0.3CoO3 series which is naturally attributed to the smaller ionic radius of europium as compared to samarium.

The nominal content of Eu along the series is shown in Table 1. Hereafter, these samples are referred to as Euy-, where and or 18 denote the Eu content and the oxygen isotope, respectively. We performed measurements for all the samples of the series, but in most cases only the results for the samples with , 0.18, 0.22, and 0.26 are shown because for samples, which differ in by only 0.02, the data in almost all cases overlap when the oxygen isotope is exchanged, i.e., the data of Eu0.12-18 overlap with those Eu0.14-16 and so on.
| Nominal | Oxygen | ||
|---|---|---|---|
| Acronym | isotope | (Å) | |
| Eu0.12-16/18 | 0.119 | 16O/18O | 1.1720 |
| Eu0.14-16/18 | 0.137 | 16O/18O | 1.1709 |
| Eu0.16-16/18 | 0.159 | 16O/18O | 1.1696 |
| Eu0.18-16/18 | 0.179 | 16O/18O | 1.1684 |
| Eu0.20-16/18 | 0.199 | 16O/18O | 1.1678 |
| Eu0.22-16/18 | 0.219 | 16O/18O | 1.1661 |
| Eu0.24-16/18 | 0.239 | 16O/18O | 1.1649 |
| Eu0.26-16/18 | 0.259 | 16O/18O | 1.1637 |
| Eu0.7Ca0.3CoO3 | 1.0 | 16O | 1.12 |
The 16O to 18O isotope substitution was carried out by annealing the samples in oxygen at 950∘C for 200 h. The gas pressure was equal to 1 bar. Two samples of rectangular shape prepared from the same pellet were simultaneously annealed, one in 16O2 and the other in 18O2 (93% of 18O2). The final enrichment of the samples with 18O was 92%, as determined from the weight change. The enrichment process is described in detail elsewhere.Babushkina et al. (1998b) The similarity of the oxygen isotope composition in the sample to that in the gas medium indicated that a thermodynamic equilibrium was achieved during annealing and, hence, the difference in the diffusion rates of the oxygen isotopes did not significantly affect the results of the investigation. It should also be noted that the mass of a sample annealed in 16O2 remained unchanged (within the experimental error) during the prolonged heat treatment. Thus, we can conclude that the annealing procedure does not change the oxygen stoichiometry in the compounds under study. The measurement of the real oxygen stoichiometry via iodometric titration in oxygen-exchanged samples does not provide a relevant accuracy because of the small amount of sample mass. However, the data obtained for samples of Pr0.7Sr0.3CoO3 [Brinks et al., 1999] and La0.7Sr0.3CoO3 [Jonker and Van Santen, 1953; Mineshige et al., 1996] prepared under normal oxygen pressure show that the expected oxygen deficiency should be about . The comparison of the transition temperatures for closely related (PrSm)0.7Ca0.3CoO3 samples annealed under oxygen pressure of 1 bar [Wang et al., 2006a] and of 60 bar [Fujita et al., 2004, 2005] suggests that the presumed oxygen deficiency hardly affects the physical properties.
II.2 Techniques
The magnetization of the samples was measured in a vibrating sample magnetometer insert to the Quantum Design PPMS in the magnetic field range up to 14 T at temperatures 2 – 300 K. For some measurements at low magnetic fields, a Quantum Design SQUID (MPMS) was used. The magnetic susceptibility was measured in an a.c. magnetic field with the frequency of 667 Hz and an amplitude of 5 Oe. The electrical resistance of the samples was measured using the four-probe technique [a two-probe method was used for ] in the temperature range from 5 to 330 K in magnetic fields up to 4 T; the magnetic field was directed parallel to the transport current. The specific heat was measured using the Quantum Design PPMS by the two-tau relaxation technique from 2 – 300 K in magnetic fields up to 14 T. High-resolution measurements of the linear thermal expansion coefficient were performed on heating from 4 to 180 K using a home-built capacitance dilatometer.
III Experimental Results
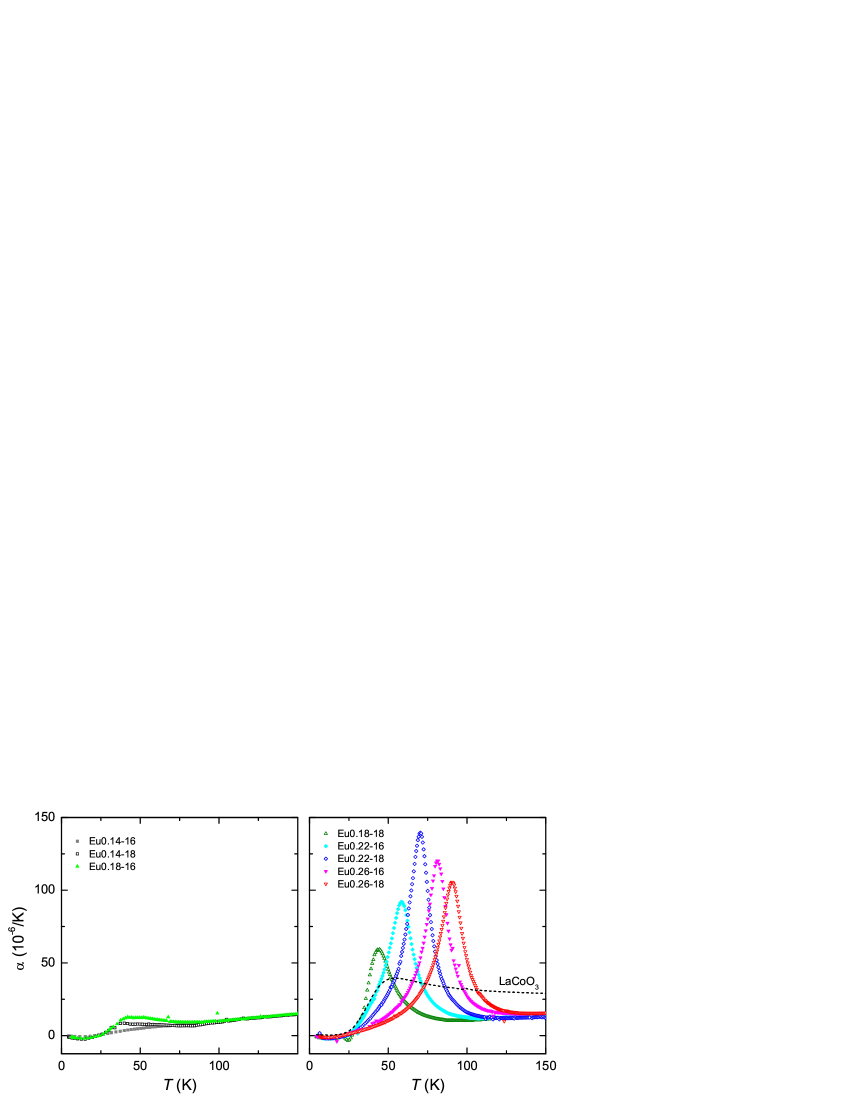
The measurements of thermal expansion are illustrated in Fig. 2. Here and further on, we denote the samples according to table 1. Obviously, the data can be split in two groups: the “highly distorted” (HD) samples (larger ) show pronounced anomalies, which are almost completely absent in the “less distorted” (LD) samples. The borderline between both groups is located at and depends on the oxygen isotope or, in other words, the (almost) absence or presence of this strong anomaly can be switched by exchanging the oxygen isotope from 16O to 18O. As will become clearer in the following, we can attribute these large anomalies to a spin-state transition of the Co3+ ions, which in this series manifests itself as a first-order phase transition. The fact that the anomalies are comparatively broad (FWHM is about 25 K) indicates that there is a large temperature range of phase coexistence and there are also indications that the different phases even coexist up to the highest and lowest measured temperatures (see below). This is most probably also the cause, why the residues of these anomalies are still visible in some of the LD samples (left panel of Fig. 2). As mentioned above, a strong lattice expansion is expected to occur at a SST due to the significantly different ionic radii of the LS and the higher-spin states of Co3+. We would like to stress, however, that the behavior here is very different from that of LaCoO3 Zobel et al. (2002); Baier et al. (2005); Radaelli and Cheong (2002) or other RCoO3 compounds.Berggold et al. (2008) The anomalous expansion due to the SST of LaCoO3, which for comparison is also shown in Fig. 2, has the typical form of a Schottky anomaly meaning that the SST is related to the thermal population of an energetically higher-lying higher-spin state, while here we are dealing with a real (but broadened) first-order phase transition in the thermodynamic sense. This explains the very symmetric shape of the anomalies (an idealized first-order phase transition would yield a jump in and a peak in ). Despite the different shapes of the anomalies of LaCoO3 and of (Pr1-yEuy)0.7Ca0.3CoO3, the total length changes up to 150 K are in the range of to for all the samples shown in the right panel of Fig. 2.
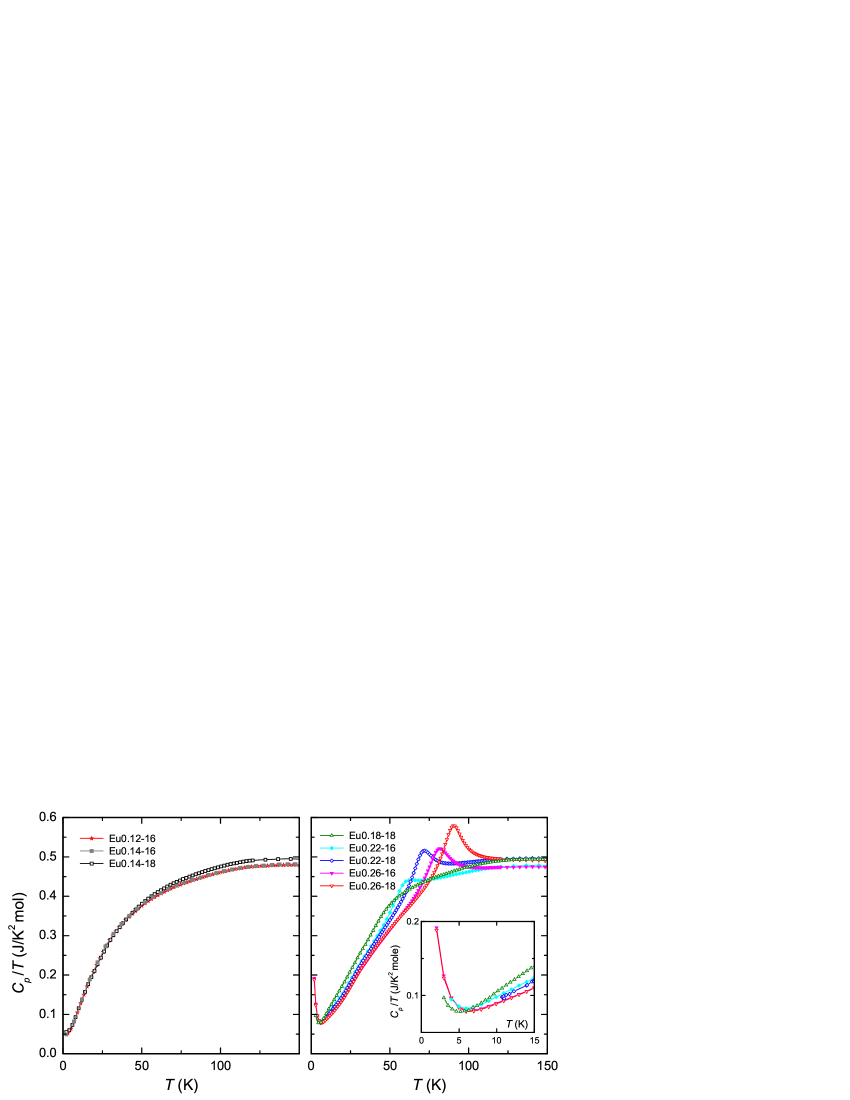
In Fig. 3, the specific heat measurements are illustrated. Again, we observe the clear difference between the LD and HD samples. The HD samples show pronounced anomalies at temperatures, which well agree with those of the corresponding anomalies in . The shape of these anomalies is also rather symmetric as expected for a broadened first-order phase transition. In addition, there are low-temperature upturns in for all HD samples measured to low enough (see inset), which indicate the occurrence of another phase transition at K. Both features are absent in the LD samples as shown in the left panel of Fig. 3. Another aspect is seen in the high-temperature limit: independent of the presence or absence of the anomalies, all curves of the 16O samples practically meet in a single line, which is slightly lower than the corresponding line where all the curves of the 18O samples meet. This difference arises from the lowering of the frequencies of those phonons, which contain vibrations of heavy oxygen. Thus, at fixed , the number of excited oxygen modes in an 16O sample is less than in the corresponding 18O sample and therefore the lattice specific heat is less in the former. This systematic behavior of our samples clearly confirms the high reliability of the oxygen exchange in this series. Similar isotope effects in of binary solids ZnO and PbS were theoretically and experimentally studied in Refs. Serrano et al., 2006; Cardona et al., 2007.
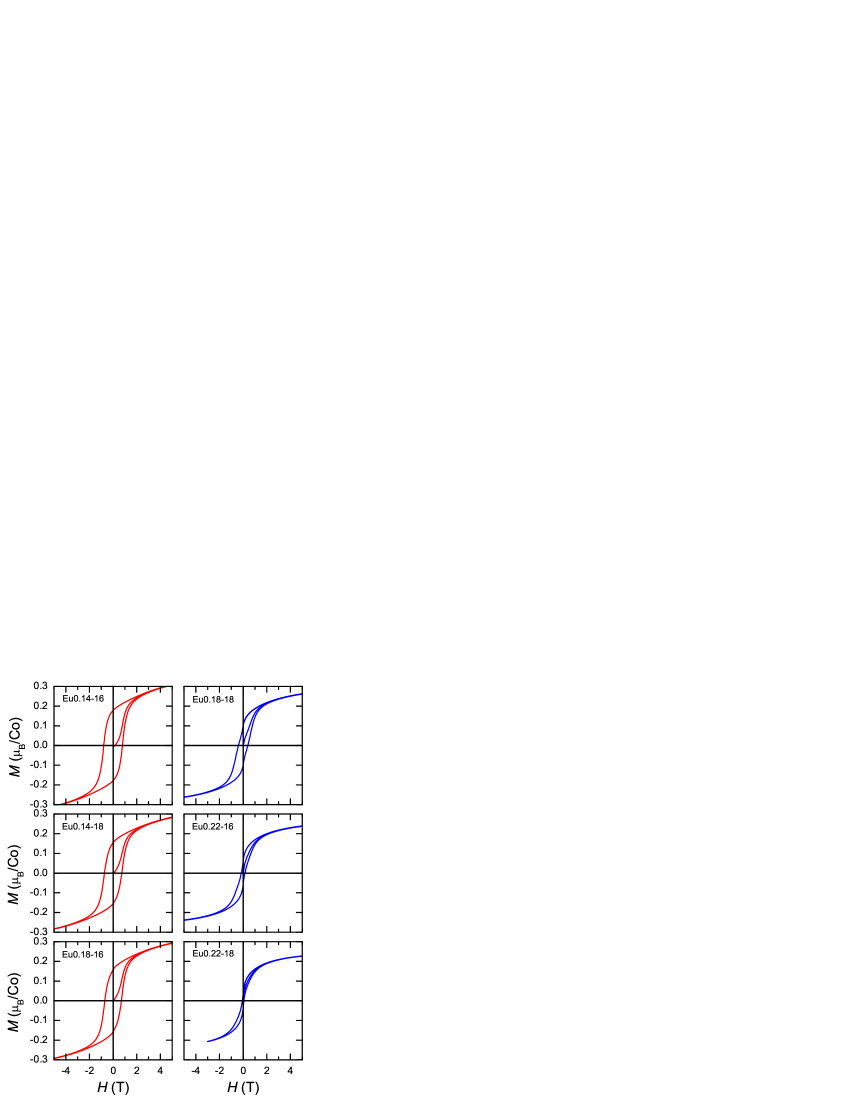
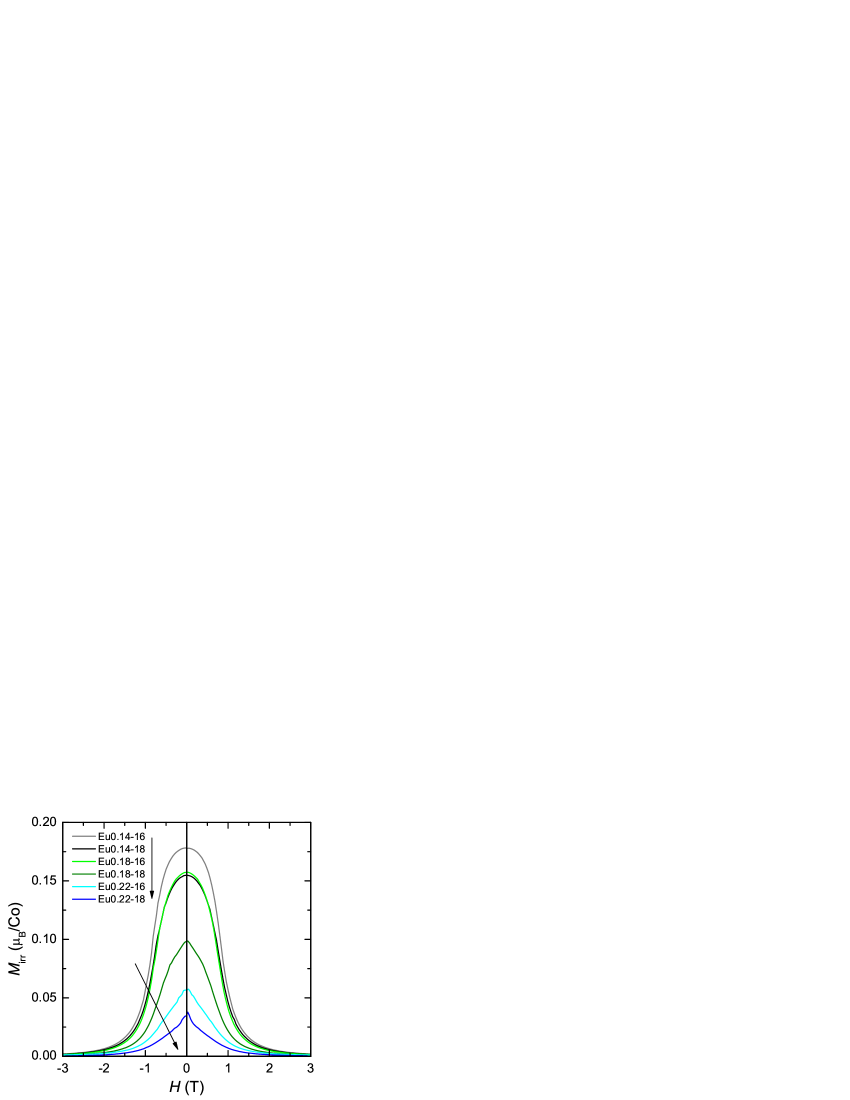
Now, we turn to the magnetization measurements. Figure 4 displays representative curves measured at 2 K on LD (left panels) and HD samples (right panels). Again, there is a clear difference; the LD samples exhibit a pronounced hysteresis, as it is typical for ferromagnets, with a large remanence and a coercitivity of the order of 1 T. A hysteretic behavior is also present for the HD samples, but it is much weaker and also qualitatively different. This is best seen by considering the irreversible parts of the curves. The irreversible part of the magnetization is defined as the half-difference of the curves measured with increasing and decreasing magnetic field. In this consideration, the virgin curve was withdrawn. The result is shown in Fig. 5. The LD samples have broad curves with a weak negative curvature around zero field, while the curves of the HD samples have essentially an almost cusp-like shape centered at zero field.
Such a crossover from the high-remanence state to the soft magnetic state was observed both for -site isovalent substitution Paraskevopoulos et al. (2001) and on heterovalent doping with Sr.Aarbogh et al. (2006) In contrast to our case, the results of Ref. Paraskevopoulos et al., 2001 for Sr0.33CoO3 demonstrated that the coercitivity increases significantly with decreasing the mean radius of the ion. In our observations, the coercitivity decreases with decreasing ionic radius (increasing Eu content). In the case of La1-xSrxCoO3, Aarbogh et al. (2006) the coercitivity peaks at and drops almost to zero at , just before the transition to the ferromagnetic metallic state. This effect was suggested to originate from the formation of thermally stable nanoscale ferromagnetic droplets in a nonmagnetic matrix that results in the peak in coercitivity. With further increase of the Sr content, these droplets form the multi-domain clusters, which percolate at the crossover to the FM state at . In our case, the coercitivity grows from about zero for to 8 kOe for , with the steep increase being visible at , and retains the same value up to the end-member Pr0.7Ca0.3CoO3.Tsubouchi et al. (2004) This suggests that the nanosize ferromagnetic particles nucleate at and then grow up to without a crossover to the multidomain-droplet state.
The occurrence of ferromagnetic-like hysteresis loops in the LD samples is rather surprising because on increasing temperature the and data do not exhibit any clear indications of a well-defined ordering transition (see Fig. 2 and Fig. 3). The same is true for temperature dependent measurements of the d.c. magnetization in finite magnetic fields (not shown). Thus, we think that the origin of the hysteresis loops is most probably related to the coexistence of different “phases” with competing magnetic interactions and, simply speaking, the hysteresis measures the “ferromagnetic” phase fraction. In such a case, there is no real long-range order and one may expect a rather continuous crossover behavior on decreasing temperature. In order to estimate a characteristic crossover temperature, we considered the vanishing of the remanent magnetization in zero field [after having performed a full hysteresis loop ] as a function of increasing temperature. Typically, vanishes around 40 to 50 K with a weak dependence on and on the oxygen isotope, which will be discussed below.
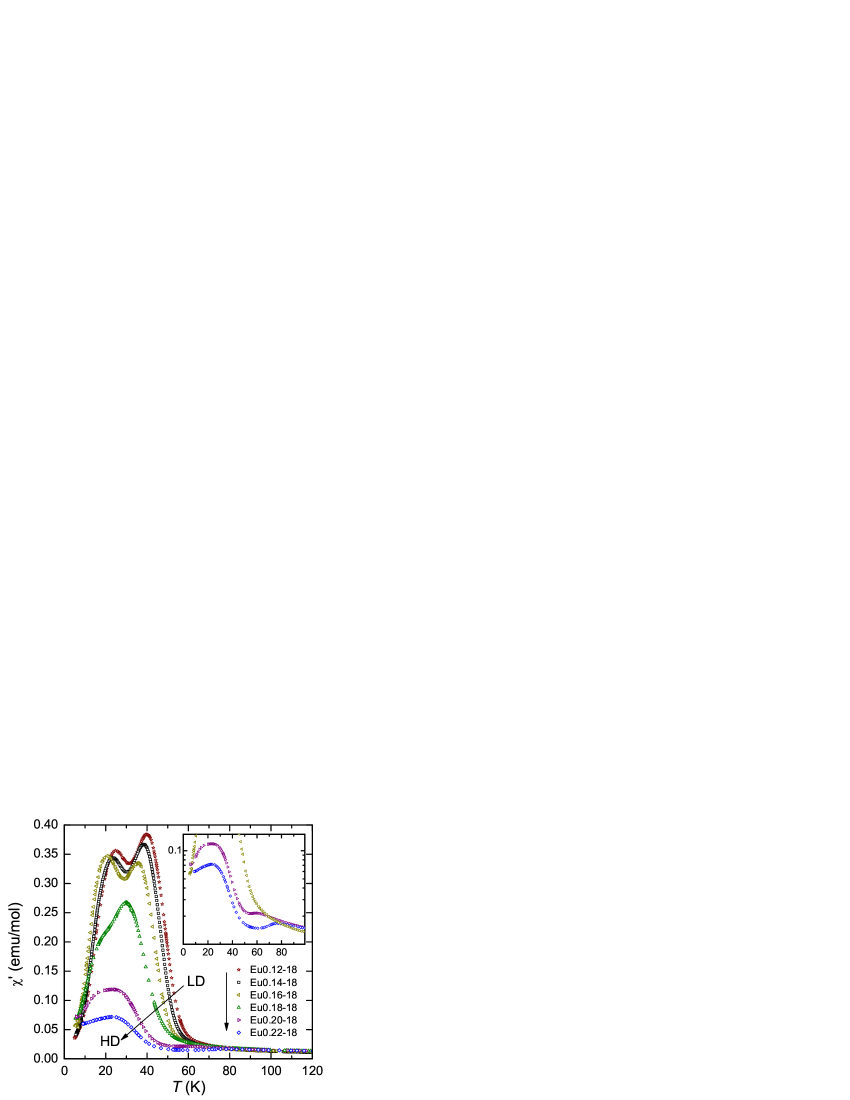
In addition, we measured the real part of the a.c. magnetic susceptibility . As shown in Fig. 6, the LD samples have a strong increase of at about 50 K, which is followed by a complicated two-hump feature on further cooling. With increasing Eu content this increase systematically shifts toward lower temperature and we used the maximum slope of as the criterion for the definition of the crossover temperature for the phase diagram. For the HD samples, shows a much weaker increase and only one broad hump on further cooling. Another difference is shown in the inset of Fig. 6; the HD samples show a stepwise increase in , which does not occur in the LD samples.
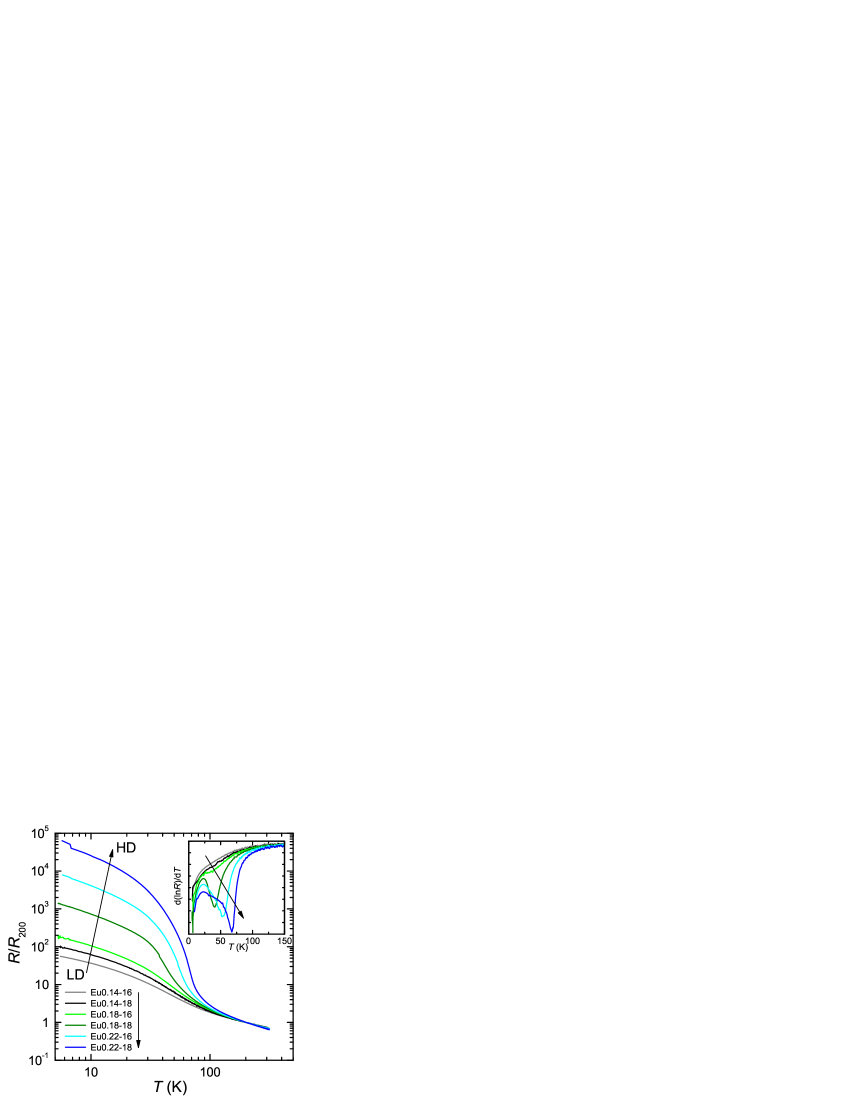
This transition is not only seen in the thermodynamic properties (, , and ) but is also visible in the electrical resistivity. The room temperature resistivity is approximately the same for all the samples (of about cm) and the data presented in Fig. 7 demonstrate that it has a weak semiconducting behavior. Below 100 K, all the HD samples show a transition to a high-resistive state, which does not occur in the LD samples. This is most clearly visible in the temperature dependence of the logarithmic derivative of the resistivity (see inset of Fig. 7). The corresponding transition temperatures coincide well with the temperatures obtained in the thermal expansion and specific heat (Fig. 2 and Fig. 3).
IV Discussion
Summarizing the data presented above, we observe in all HD samples clear signatures of a first-order phase transition, which on increasing temperature causes (i) a pronounced lattice expansion, (ii) a gain in entropy, (iii) a step-like increase of the magnetization, and (iv) a drop in the electrical resistivity. All these features can be naturally explained by a spin-state transition from a LS to a higher-spin state of the Co3+ ions, because the latter have (i) a larger volume, (ii) more spin entropy, and (iii) a finite magnetic moment. To be more precise, the larger unit cell volume, which is discussed here, does not inevitably mean an increase of a Co3+ ionic radius. It is also possible that as shown in Ref. [Tong et al., 2009], the increase of the Co–O–Co bond angle (and concomitant CoO6 octahedra distortions) could solely be responsible for the anomalous volume expansion upon the SST.
The drop in the resistivity (iv) suggests that the higher spin state is the IS state, because LS-Co4+/IS-Co3+ neighbors allow for an easy electron transfer via the orbitals, whereas for LS-Co4+/LS-Co3+ only a hopping via the orbitals, which have much less overlap, is possible and for the LS Co4+/HS Co3+ combination the electron transfer is suppressed by the so-called spin-blockade effect.Maignan et al. (2004) The other possible scenario, which could have explained the observed features, would be a charge ordering in the low-temperature phase. However, no superlattice reflections (which would be a fingerprint of charge ordering) in NPD and XRD data Tong et al. (2009); Tsubouchi et al. (2002) were observed in the closely related Pr0.5Ca0.5CoO3 compound. So, based on the neutron and X-ray diffraction data we can refute this alternative scenario.
The observed transition to a LS state with decreasing temperature exists only for the HD samples and is absent in the LD samples. That means that in the LD samples the Co3+ ions remain in the higher-spin state down to the lowest temperature, and the presence of LS-Co4+/IS-Co3+ neighbors appears to be most probable, because the electron transfer favors a ferromagnetic alignment of the moments via the double-exchange mechanism. This would be a natural source of the almost ferromagnetic low-temperature hysteresis loops in the LD samples. The fact that we are not dealing with a real long-range ferromagnetic order manifests itself in a more insulating behavior of the (Pr1-yEuy)0.7Ca0.3CoO3 series as compared, e.g., to La0.75Ba0.25CoO3 or La0.75Sr0.25CoO3. The latter are metallic in the entire temperature range and show ferromagnetic ordering transitions at about 220 K, which is most probably triggered by the double-exchange mechanism.Kriener et al. (2004)
To get more information about the actual low-temperature spin states, let us consider the low-temperature high-field magnetization. For the above-mentioned ferromagnetic metals La0.75(Ba,Sr)0.25CoO3, a saturation magnetization of about 1.7 Co is observed, which is close to the expected value of 1.75 Co corresponding to a 1:3 ratio of LS-Co4+/IS-Co3+. For the actual series, one has to consider also the (Pr1-yEuy) magnetism of the shell. According to Hund’s rules, Eu3+ ions have a nonmagnetic 7F0 ground state, but in finite magnetic fields this state is mixed with the higher-lying multiplets that results in a finite van Vleck susceptibility. The ground state of free Pr3+ ions is a 3H4 multiplet with a total moment , which splits into 9 singlets in the orthorhombic crystal field, and again these different singlets are mixed in a finite magnetic field. As a consequence, one may expect a considerable low-temperature magnetization from (Pr1-yEuy), which is essentially linear in field. The detailed form and the exact absolute value of this depend on details of the crystal field, which are not known for our samples, but one can expect that the crystal fields here will not differ too much from those in EuCoO3 and PrCoO3. Since in these undoped compounds the Co3+ ions are in the LS state, the contributions of Eu3+ and Pr3+ are directly measured by the low-temperature curve (apart from additional small contributions due to impurities or oxygen off-stoichiometry). In previous studies on EuCoO3 and PrCoO3,Berggold et al. (2008); Baier et al. (2005) we found values of about 0.17 and 0.55 per formula unit, respectively.
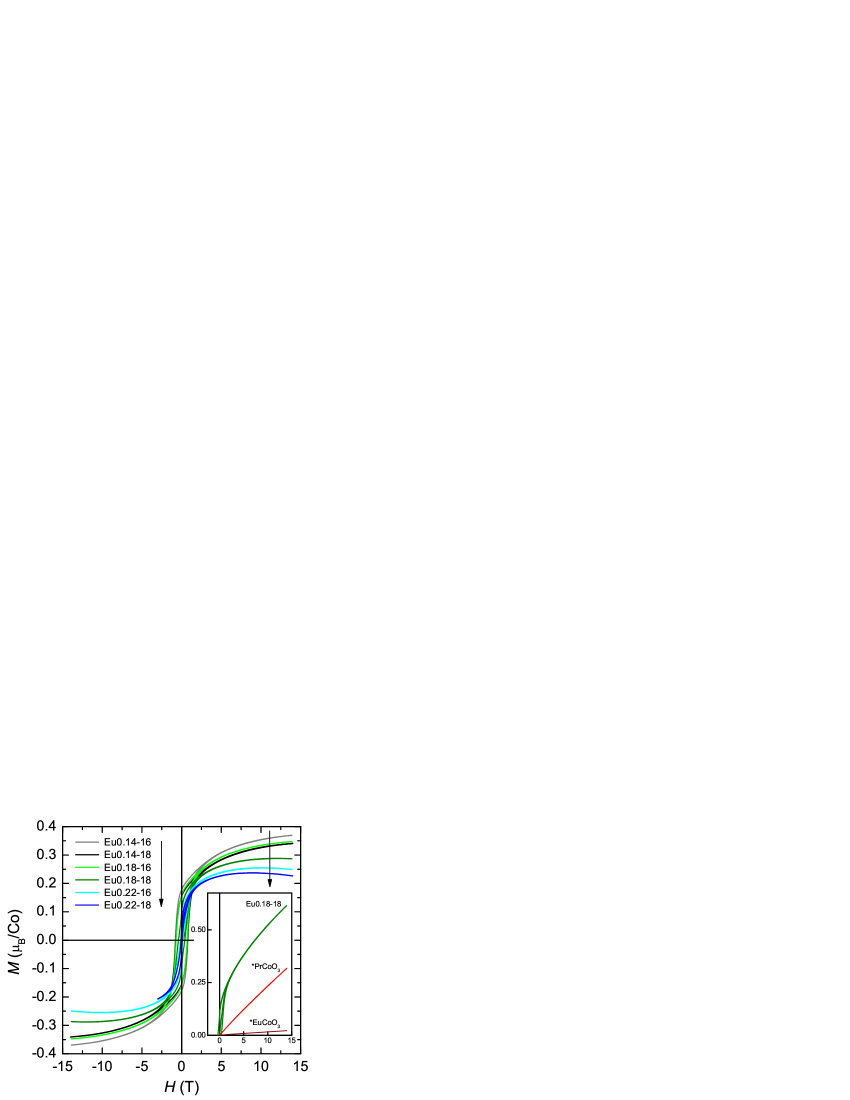
To estimate the Co contributions in the (Pr1-yEuy)0.7Ca0.3CoO3 samples, we therefore subtracted the curve of PrCoO3 weighed by the respective Pr content from the measured curves. The resultant curves are summarized in Fig. 8 and, at least for the samples with higher Eu contents, there seems to be some “overcorrection”. Since the Pr contribution is already somewhat overestimated, we did not perform an additional subtraction of an Eu contribution . Note that due to the different Eu and Pr contents, is only of about 15% of in all samples (see inset of Fig. 8) and thus, it is within the uncertainty of the estimates of the entire contribution of (Pr1-yEuy). Independent of this uncertainty, it is clearly seen that the curves tend to the saturation value of about 0.3 Co. This value agrees well with that of all Co4+ ions in the LS state, i.e., 1 /Co4+, with all the Co3+ ions being in the nonmagnetic LS state. For the HD samples such a state appears plausible, because our data yield clear evidence for a SST from the IS to the LS state of Co3+ ions on decreasing temperature. For the LD samples, however, the LS state of the Co3+ ions is very unlikely because in such a case, both the LD and HD samples would have the same spin state combination (LS Co3+/LS Co4+) at low and thus one could not explain the qualitatively different loops (see Fig. 4 and Fig. 5). As discussed above, the LD samples are closer to a ferromagnetic behavior than the HD samples, which agrees with the expectations that due the lower chemical pressure in the LD samples at least more (maybe all) Co3+ ions remain in the IS state. The fact that, nevertheless, the magnetization hardly exceeds that of the HD samples gives further evidence that there are competing magnetic interactions, e.g., AFM Co3+ – Co3+ and FM Co3+ – Co4+, which prevent a real long-range magnetic order in the LD samples. The presence of AFM clusters could also explain the finite high-field slope of the curves of the LD samples, although this argument has to be treated with some caution because of the uncertainty in subtracting the background .
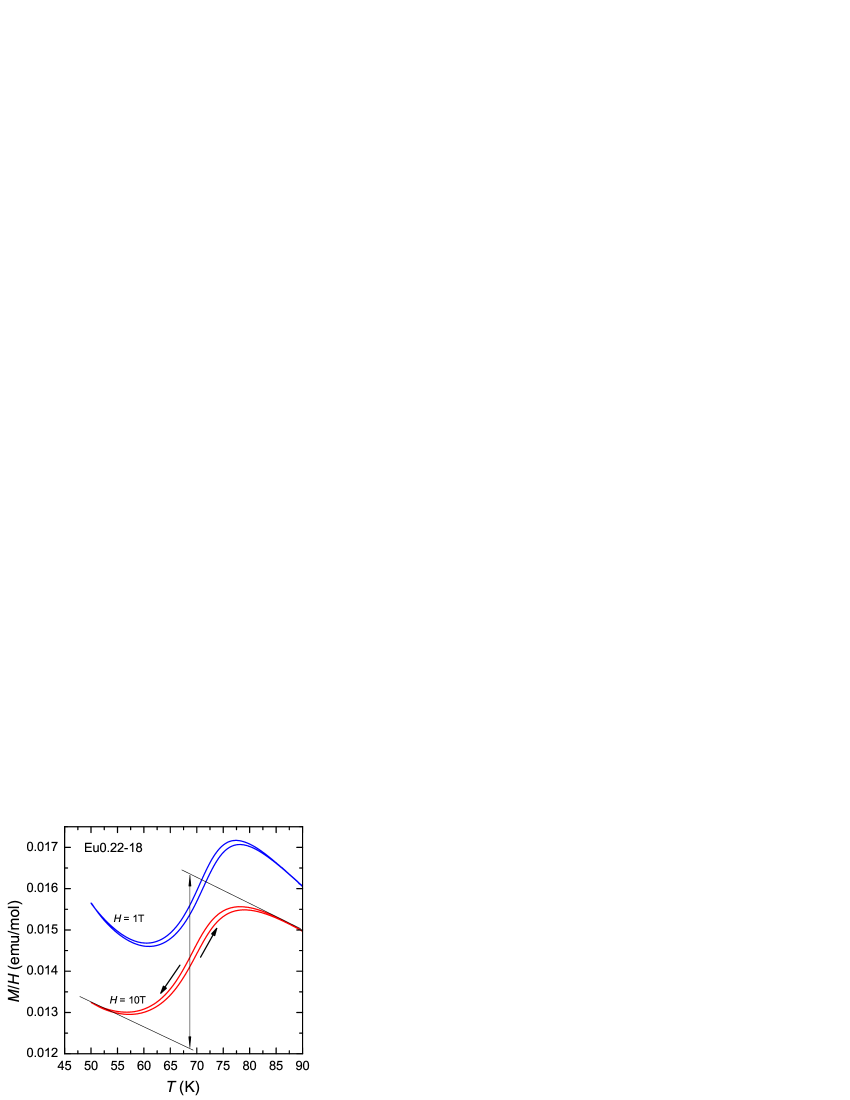
Next, we will discuss whether the SST of the HD samples is complete, meaning which amount of the Co3+ ions is involved in the SST. It is straightforward to analyze this via the entropy change at the SST, which can be obtained either directly from the specific heat data or by using the Clausius-Clapeyron equation , which, for a first-order phase transition, relates the field dependence of the transition temperature to the ratio of the discontinuous changes and of the magnetization and the magnetic entropy, respectively. In Fig. 9 we compare curves for fields of 1 and 10 T, each of them measured both on heating and cooling. A small but finite hysteresis is visible in both curves and it is also seen that the transition shifts to lower with increasing field. For the quantitative analysis we linearly extrapolated the measured curves well above and below and found as a step change between these lines, as indicated by the straight lines and the thin arrow in Fig. 9. With K/T and emu/mol obtained in this way, we estimate the magnetic entropy change J/(K mol).
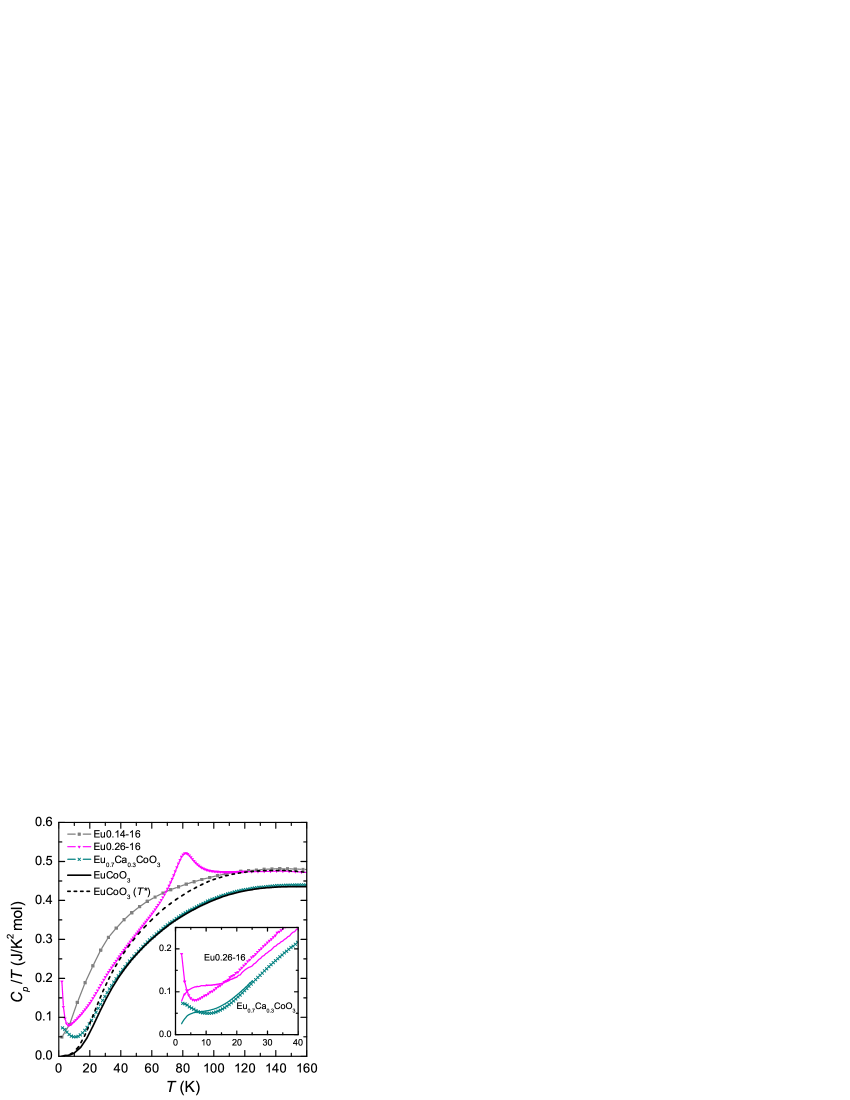
In order to analyze the magnetic specific heat, we present in Fig. 10 the plots of two members of the (Pr1-yEuy)0.7Ca0.3CoO3 series, which are characteristic either for the LD or the HD samples; see Fig. 3. Obviously, the curves of the LD and HD samples coincide above about 120 K, while for lower systematic differences are present: there are two anomalies for the HD samples, in contrast to one very broad shoulder for the LD samples. Interestingly, the total entropy change from 2 to 120 K of the HD and LD samples differs only by about 2 J/(K mol) and, because of the low-temperature anomaly, this difference would further decrease if the measurements were performed to lower . One may even speculate that finally this difference should more or less completely vanish for K. This could be interpreted in the following simple picture: for both, the LD and the HD samples (i) the phonon specific heat is essentially the same, and (ii) at high the total magnetic entropy is given by . Here, J/(K mol) is the gas constant and and stem from with for LS Co4+ and for IS Co3+, respectively. On decreasing , this magnetic entropy continuously becomes frozen for the LD samples without showing a well-defined magnetic phase transition because of the presence of competing magnetic interactions. For the HD samples, in contrast, a part of the magnetic entropy freezes at about 80 K due to a SST of Co3+ ions and the rest via an additional low- transition.
To get more information about the origin of the low- transition, we also measured of EuCoO3 and Eu0.7Ca0.3CoO3. For EuCoO3, the Co3+ ions are known to be in the LS state up to above room temperature.Baier et al. (2005) The data of both Eu compounds superimpose on each other everywhere except in the low-temperature region. It appears natural that (because of the very small Eu ions) all the Co3+ ions remain in the LS state even in the Ca-doped compound. So, the difference below 20 K and the upturn at low temperatures should be merely related to the Co4+ ions. In addition, we also found that a magnetic field of 10 T strongly suppresses the low-temperature upturn (see inset of Fig. 10) confirming that the extra entropy is of a magnetic nature. Moreover, the entropy difference of 1.2 J/(K mol) between EuCoO3 and Eu0.7Ca0.3CoO3 in the temperature range down to 2 K is quite comparable to the full magnetic entropy J/(K mol) of Co4+ ions.
Similar low-temperature anomalies in were observed in closely related Pr1-xCaxCoO3 [Tsubouchi et al., 2004] and in (Pr1-ySmy)1-xCaxCoO3 [Fujita et al., 2005] compounds as well as in undoped LaCoO3 [He et al., 2009]. C. He and co-workers He et al. (2009) have interpreted the observed anomaly as a Schottky anomaly associated with the first excited (by 0.6 meV) spin state of the Co3+ ion. Despite the similar magnetic field dependence of the anomaly that was observed in Ref. He et al., 2009 and in our data, the origin of this effect must be different. In our case, the anomaly appears only for the HD samples and, if the energy gap would arise from the proposed Schottky anomaly, it should increase with increasing distortion that would result in a suppression of the anomaly. But this is not the case: the anomaly is essentially the same for all HD sample. (These curves are not shown in Fig. 10, because they are almost coincide). Moreover, our samples contain a significant fraction () of magnetic Co4+ ions, in stark contrast to slightly oxygen-deficient LaCoO3. Thus, we conclude that the low-temperature upturns in observed in Eu0.7Ca0.3CoO3 and in the HD samples of the (Pr1-yEuy)0.7Ca0.3CoO3 series provide an evidence for some kind of magnetic ordering of a (dilute) system of Co4+ ions in a background of nonmagnetic LS Co3+ ions.
A quantitative determination of the entropy change related to the SST requires the knowledge of the phonon contribution. To estimate this contribution, we use the data of EuCoO3 and rescale the temperature axis by . This procedure does not have a quantitative meaning, but the obtained curve matches the data of the HD samples of the (Pr1-yEuy)0.7Ca0.3CoO3 series both on the high-temperature tail and in the region below the SST by using a single correction coefficient only. Thus, we consider this as a reasonable phonon background and its subtraction from the measurements on the HD samples yields entropy changes at the SST ranging from 2.5 to 2.6 J/(K mol) for to 0.26. These values are close to obtained independently from the observed field dependence of via the Clausius-Clapeyron equation. This entropy change is significantly smaller than the expected J/(K mol), when all Co3+ ions would be transformed from the LS to the IS state. Interestingly, the obtained entropy change is much closer to J/(K mol), suggesting that on average each Co4+ ion induces a SST in only one (probably) neighboring Co3+ ion. This is very different from the results for very lightly Sr-doped LaCoO3,Podlesnyak et al. (2008); Yamaguchi et al. (1996) where each Sr (or Co4+ thus created) promotes in average six neighboring Co3+ to the IS state. Thus, apparently the extent, to which the LS Co3+ ions are promoted to the IS state depend on details of the system. We suspect that this very different behavior of lightly Sr-doped LaCoO3 and the (Pr1-yEuy)0.7Ca0.3CoO3 series arises from two effects: (i) a larger crystal-field splitting and (ii) a reduced electron hopping because the bandwidth is reduced in the stronger distorted structure for the smaller rare-earth ions [(Pr1-yEuy) instead of (La1-xSrx)]. Note that in the 50%-doped Pr0.5Ca0.5CoO3 compound Tsubouchi et al. (2002) the spin-state-transition entropy was estimated to 4.7 J/(K mol), which is equal to the entropy if all 0.5 Co3+ are promoted from the LS to IS state. This does, however, not contradict our finding, because the half-doped case contains equal amounts of Co3+ and Co4+ ions.
V Phase diagram
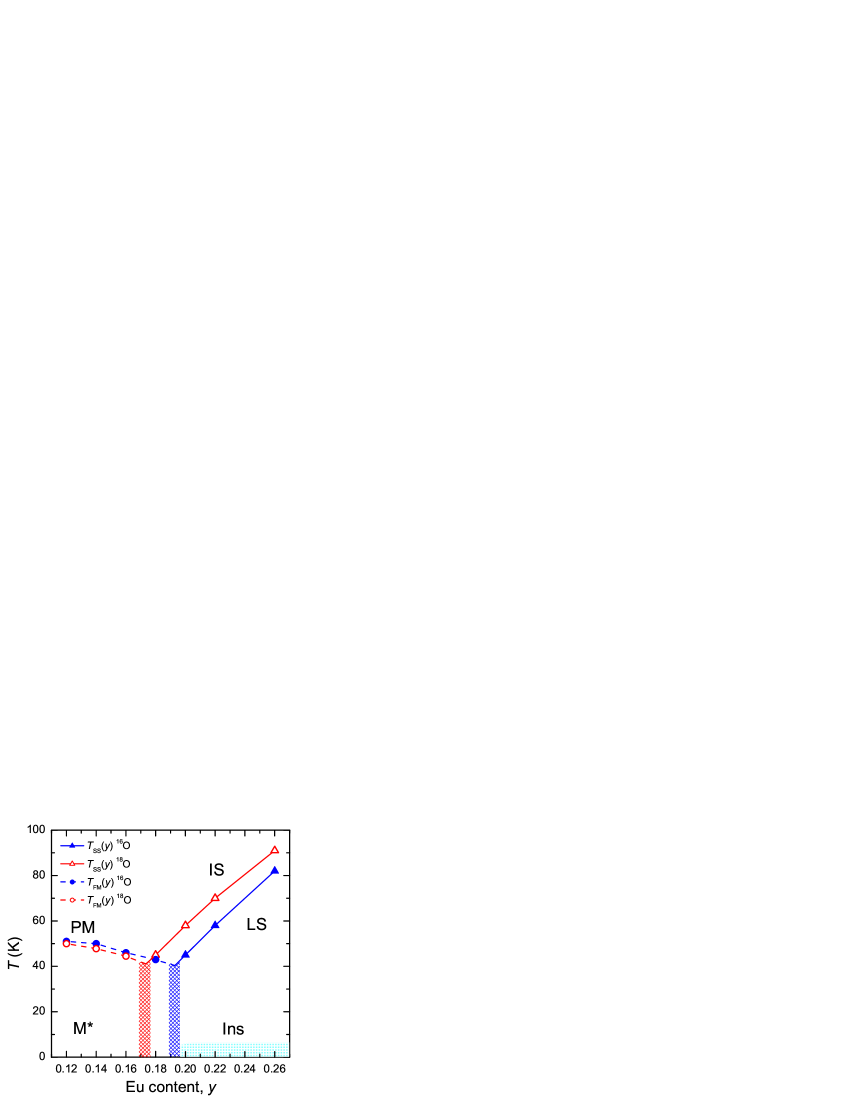
Based on all obtained results, we derive the phase diagram describing magnetic and spin-state transitions (see Fig. 11). There are three magnetic/spin states of Co3+ ions in the diagram. (Because we are not aware of any compound where Co4+ realizes another spin state than the LS state with , only the spin state of Co3+ ions is discussed.) For (LD samples), the ground state becomes ferromagnetic with a large remanence and coercitivity. A fuzzy line separates it from the high-temperature paramagnetic state. For Eu contents just below , the low-temperature saturation magnetization exceeds the maximum value for the LS state of all cobalt ions. This implies that in the absence of the FM ordering (due to LS-Co4+/IS-Co3+ interaction), the Co3+ ions just below would still show a transition to the LS state. Moreover, there is no low-temperature upturn in the data for the LD region, and a magnetic field of 10 T does not affect the specific heat at all. This suggests that the Co4+ ions are already ordered at high temperatures giving rise to the coercitivity. The low-temperature resistivity in these LD samples is lower by several orders of magnitude compared to that of the HD samples, but there is no real metallicity in the dependence. The saturation magnetization reaches only 0.35 per Co site (up to 0.5 Co for the end-member Pr0.7Ca0.3CoO3 with K [Tsubouchi et al., 2004]). A fully polarized Co3+ sublattice in the IS state should result in a much higher magnetization of 1.4 Co (and even more so for HS Co3+ ions). The intermediate-spin state makes the double exchange mechanism Zener (1951) possible due to the presence of the itinerant electrons that can explain the simultaneous nucleation of ferromagnetism and conductivity. We can qualitatively interpret these data (fuzzy transition, low magnetic moment, absence of a real metallic behavior) in the picture of a strongly inhomogeneous (phase-separated) state with ferromagnetic metallic clusters embedded into a nonmagnetic and insulating (or, at least, less magnetic and less conducting) background.
With increasing temperature the LD samples show a smooth crossover to the paramagnetic state, which is observable as a broad hump in the temperature dependence of the specific heat; see Figs. 3 and 10. The corresponding entropy associated with the crossover for Eu0.14-16 is estimated to 6.7 J/(K mol), which is smaller than the total magnetic entropy J/(K mol) assuming that the Co4+ ions are in LS () and all Co3+ ions are in the IS state ().
With increasing Eu content, i.e. increasing chemical pressure, the Co3+ LS state becomes more and more stabilized and above a certain critical value, temperature-dependent spin-state transitions occur for the HD samples. However, as discussed in the previous section, in average every Co4+ ion induces this spin-state transition in only one neighboring Co3+ ion, i.e., less than half of the Co3+ ions actually show the spin-state transition.
The isotope effect is clearly observed for the spin-state transition . The temperature has only marginal but visible dependence on the isotope content. However for both phase boundaries [ and ], the isotope exchange is equivalent to the change in by approximately 0.02. This means that the static distortions due to the change in the mean radius of rare-earth ions are somehow equivalent to changes in the lattice dynamics due to the isotope exchange, although the physical mechanisms are apparently different. An increase of the Eu content leads mainly to an increase of the – crystal field splitting, which stabilizes the LS state. On the other hand, the main effect of the oxygen isotope substitution is a change of the effective intersite hopping, i.e. of the bandwidth. For the LD samples both phases, FM and PM are “bad metallic” with magnetic Co3+ ions and partially filled bands. The bandwidth changes with the oxygen isotope substitution but the resulting effect on is relatively weak.Babushkina et al. (1998b) At the same time, the SST of the HD samples (in the right part of the phase diagram) is accompanied by a more drastic change of the electronic structure. Whereas in the insulating LS state the bands are practically empty, they are partially occupied in the high-temperature phase with the promotion of a part of the Co3+ ions to the IS state. In this case, the narrower bands for the 18O samples start to overlap with the levels much later than for the 16O samples. Consequently, the bands for the 18O samples become occupied later and are filled more slowly. This strongly stabilizes the LS state and shifts the SST upwards in the 18O case. Close to the LS – IS crossover even small changes in hopping and bandwidth ( is the number of nearest neighbors) lead to a pronounced shift of the phase equilibrium.Babushkina et al. (1998b) Indeed, we see that is much higher for the samples with the heavier oxygen isotope. Note, however, that the isotope effect for , being much weaker, is of the opposite sign. ( is slightly lower for the 18O samples with the narrower bands.) This fits to our expectations, because the ferromagnetism of the low-Eu doped samples (with metallic conductivity) should be stabilized by the double-exchange mechanism according to which is proportional to the effective bandwidth of the itinerant electrons. Itinerant electrons are less affected by the lattice and hence less sensitive to the isotope composition, although the bandwidth can be renormalized due to the electron-phonon interaction. However, such effects are usually rather small since the dimensionless electron-phonon coupling constant does not depend explicitly on the atomic mass, if the system does not correspond to the regime of small polarons. The situation here has some similarities with the isotope effect in manganites with competing states of a charge-ordered insulator and ferromagnetic metal.Babushkina et al. (2008)
VI Summary
The magnetic/spin-state phase diagram of (Pr1-yEuy)0.7Ca0.3CoO3 series was obtained on the basis on the measurements of the specific heat, thermal expansion, magnetization and resistivity. The phase diagram reveals three different states depending on the static distortions (Eu content), the oxygen-isotope mass, and the temperature. The samples with the lower Eu concentrations are ferromagnetically ordered up to moderate temperatures (about 50 K) most probably due to the Co4+ (LS, ) – Co3+ (IS, ) interaction of the double-exchange type, with the promotion of the Co3+ ions to the higher-spin state. As the Eu doping increases, the Co3+ LS () state becomes stabilized and the magnetic ordering of the Co4+ ions is suppressed to temperatures well below 5 K. At higher temperatures, we observe a first-order spin-state transition from the LS to the IS state of Co3+, which is accompanied by a strong decrease of the electrical resistivity. Again this temperature-activated spin-state transition is promoted by the electron hopping to the neighboring Co3+ ions, but on average every Co4+ ions induces a spin-state transition in only one Co3+ ion.
The oxygen-isotope exchange (16O to 18O) shifts the phase boundaries to the lower Eu concentration, i.e., an increase of the oxygen mass acts similarly to an increase of the Eu content. Nevertheless, the mechanisms of such shifts seem to be different: increasing the Eu content mainly increases the crystal field splitting whereas the main effect of the oxygen-isotope substitution from 16O to 18O is a decrease of the effective band width, but both effects favor the stabilization of the insulating state with LS Co3+. Note, however, that for a given composition, the isotope effect on the spin-state transition (in the samples with high Eu content) is quite strong, whereas it is much weaker and of opposite sign for the magnetic transitions in the samples with the low Eu contents.
We expect that the regularities observed in these systems should also be applicable to other cobaltites with spin-state transitions. For example, the observed correlation of the Co4+-related upturn at low temperatures with the presence of the spin-state transition at a higher temperature can be seen also in the Pr1-xCaxCoO3 [Tsubouchi et al., 2004] and in (Pr1-ySmy)1-xCaxCoO3 [Fujita et al., 2005] series.
Acknowledgements.
The present work was supported by the Russian Foundation for Basic Research (projects 07-02-00681, 07-02-91567 and 10-02-00598), and by the Deutsche Forschungsgemeinshaft via SFB 608 and the German-Russian project 436 RUS 113/942/0.References
- Imada et al. (1998) M. Imada, A. Fujimori, and Y. Tokura, Rev. Mod. Phys. 70, 1039 (1998).
- Khomskii (2000) D. I. Khomskii, Physica B 280, 325 (2000).
- Kagan and Kugel (2001) M. Y. Kagan and K. I. Kugel, Usp. Fiz. Nauk 171, 577 (2001), [Phys. Usp. 44, 553 (2001)].
- Dagotto (2003) E. Dagotto, Nanoscale Phase Separation and Colossal Magnetoresistance: The Physics of Manganites and Related Compounds (Springer-Verlag, Berlin, 2003).
- Jonker and Van Santen (1953) G. H. Jonker and J. H. Van Santen, Physica (Amsterdam) 19, 120 (1953).
- Goodenough and Raccah (1965) J. B. Goodenough and P. M. Raccah, J. Appl. Phys. 36, 1031 (1965).
- Señarís-Rodríguez and Goodenough (1995) M. A. Señarís-Rodríguez and J. B. Goodenough, J. Solid State Chem. 116, 224 (1995).
- Asai et al. (1998) K. Asai, A. Yoneda, O. Yokokura, J. M. Tranquada, G. Shirane, and K. Kohn, J. Phys. Soc. Jpn. 67, 290 (1998).
- Saitoh et al. (1997) T. Saitoh, T. Mizokawa, A. Fujimori, M. Abbate, Y. Takeda, and M. Takano, Phys. Rev. B 55, 4257 (1997).
- Tokura et al. (1998) Y. Tokura, Y. Okimoto, S. Yamaguchi, H. Taniguchi, T. Kimura, and H. Takagi, Phys. Rev. B 58, R1699 (1998).
- Korotin et al. (1996) M. A. Korotin, S. Y. Ezhov, I. V. Solovyev, V. I. Anisimov, D. I. Khomskii, and G. A. Sawatzky, Phys. Rev. B 54, 5309 (1996).
- Yamaguchi et al. (1997) S. Yamaguchi, Y. Okimoto, and Y. Tokura, Phys. Rev. B 55, R8666 (1997).
- Kobayashi et al. (2000) Y. Kobayashi, N. Fujiwara, S. Murata, K. Asai, and H. Yasuoka, Phys. Rev. B 62, 410 (2000).
- Sato et al. (2008) K. Sato, M. I. Bartashevich, T. Goto, Y. Kobayashi, M. Suzuki, K. Asai, A. Matsuo, and K. Kindo, J. Phys. Soc. Jpn. 77, 024601 (2008).
- Zobel et al. (2002) C. Zobel, M. Kriener, D. Bruns, J. Baier, M. Grüninger, T. Lorenz, P. Reutler, and A. Revcolevschi, Phys. Rev. B 66, 020402(R) (2002).
- Berggold et al. (2008) K. Berggold, M. Kriener, P. Becker, M. Benomar, M. Reuther, C. Zobel, and T. Lorenz, Phys. Rev. B 78, 134402 (2008).
- Baier et al. (2005) J. Baier, S. Jodlauk, M. Kriener, A. Reichl, C. Zobel, H. Kierspel, A. Freimuth, and T. Lorenz, Phys. Rev. B 71, 014443 (2005).
- Tong et al. (2009) P. Tong, Y. Wu, B. Kim, D. Kwon, J. M. S. Park, and B. G. Kim, J. Phys. Soc. Jpn. 78, 034702 (2009).
- Tsubouchi et al. (2002) S. Tsubouchi, T. Kyômen, M. Itoh, P. Ganguly, M. Oguni, Y. Shimojo, Y. Morii, and Y. Ishii, Phys. Rev. B 66, 052418 (2002).
- Fujita et al. (2004) T. Fujita, T. Miyashita, Y. Yasui, Y. Kobayashi, M. Sato, E. Nishibori, M. Sakata, Y. Shimojo, N. Igawa, Y. Ishii, et al., J. Phys. Soc. Jpn. 73, 1987 (2004).
- Podlesnyak et al. (2006) A. Podlesnyak, S. Streule, J. Mesot, M. Medarde, E. Pomjakushina, K. Conder, A. Tanaka, M. W. Haverkort, and D. I. Khomskii, Phys. Rev. Lett. 97, 247208 (2006).
- Haverkort et al. (2006) M. W. Haverkort, Z. Hu, J. C. Cezar, T. Burnus, H. Hartmann, M. Reuther, C. Zobel, T. Lorenz, A. Tanaka, N. B. Brookes, et al., Phys. Rev. Lett. 97, 176405 (2006).
- Ropka and Radwanski (2003) Z. Ropka and R. J. Radwanski, Phys. Rev. B 67, 172401 (2003).
- Haverkort (2005) M. W. Haverkort, Ph.D. thesis, University of Cologne (2005), cond-mat/0505214.
- Noguchi et al. (2002) S. Noguchi, S. Kawamata, K. Okuda, H. Nojiri, and M. Motokawa, Phys. Rev. B 66, 094404 (2002).
- Phelan et al. (2008) D. Phelan, J. Yu, and D. Louca, Phys. Rev. B 78, 094108 (2008).
- Phelan et al. (2009) D. Phelan, D. Louca, S. N. Ancona, S. Rosenkranz, H. Zheng, and J. F. Mitchell, Phys. Rev. B 79, 094420 (2009).
- Podlesnyak et al. (2008) A. Podlesnyak, M. Russina, A. Furrer, A. Alfonsov, E. Vavilova, V. Kataev, B. Büchner, T. Strässle, E. Pomjakushina, K. Conder, et al., Phys. Rev. Lett. 101, 247603 (2008).
- Maignan et al. (2004) A. Maignan, V. Caignaert, B. Raveau, D. Khomskii, and G. Sawatzky, Phys. Rev. Lett. 93, 026401 (2004).
- Kriener et al. (2004) M. Kriener, C. Zobel, A. Reichl, J. Baier, M. Cwik, K. Berggold, H. Kierspel, O. Zabara, A. Freimuth, and T. Lorenz, Phys. Rev. B 69, 094417 (2004).
- Zener (1951) C. Zener, Phys. Rev. 82, 403 (1951).
- de Gennes (1960) P. G. de Gennes, Phys. Rev. 118, 141 (1960).
- Kriener et al. (2009) M. Kriener, M. Braden, H. Kierspel, D. Senff, O. Zabara, C. Zobel, and T. Lorenz, Phys. Rev. B 79, 224104 (2009).
- Fujita et al. (2005) T. Fujita, S. Kawabata, M. Sato, N. Kurita, M. Hedo, and Y. Uwatoko, J. Phys. Soc. Jpn. 74, 2294 (2005).
- Babushkina et al. (1998a) N. A. Babushkina, L. M. Belova, O. Y. Gorbenko, A. R. Kaul, A. A. Bosak, V. I. Ozhogin, and K. I. Kugel, Nature (London) 391, 159 (1998a).
- Wang et al. (2006a) G. Y. Wang, T. Wu, X. G. Luo, W. Wang, and X. H. Chen, Phys. Rev. B 73, 052404 (2006a).
- Wang et al. (2006b) G. Y. Wang, X. H. Chen, T. Wu, G. Wu, X. G. Luo, and C. H. Wang, Phys. Rev. B 74, 165113 (2006b).
- Shannon (1976) R. D. Shannon, Acta Cryst. A 32, 751 (1976).
- Balagurov et al. (1999) A. M. Balagurov, V. Y. Pomjakushin, D. V. Sheptyakov, V. L. Aksenov, N. A. Babushkina, L. M. Belova, A. N. Taldenkov, A. V. Inyushkin, P. Fischer, M. Gutmann, et al., Phys. Rev. B 60, 383 (1999).
- Babushkina et al. (1998b) N. A. Babushkina, L. M. Belova, V. I. Ozhogin, O. Y. Gorbenko, A. R. Kaul, A. A. Bosak, D. I. Khomskii, and K. I. Kugel, J. Appl. Phys. 83, 7369 (1998b).
- Brinks et al. (1999) H. W. Brinks, H. Fjellvåg, A. Kjekshus, and B. C. Hauback, J. Solid State Chem. 147, 464 (1999).
- Mineshige et al. (1996) A. Mineshige, M. Inaba, T. Yao, Z. Ogumi, K. Kikuchi, and M. Kawase, J. Solid State Chem. 121, 423 (1996).
- Radaelli and Cheong (2002) P. G. Radaelli and S.-W. Cheong, Phys. Rev. B 66, 094408 (2002).
- Serrano et al. (2006) J. Serrano, R. K. Kremer, M. Cardona, G. Siegle, A. H. Romero, and R. Lauck, Phys. Rev. B 73, 094303 (2006).
- Cardona et al. (2007) M. Cardona, R. K. Kremer, R. Lauck, G. Siegle, J. Serrano, and A. H. Romero, Phys. Rev. B 76, 075211 (2007).
- Paraskevopoulos et al. (2001) M. Paraskevopoulos, J. Hemberger, A. Krimmel, and A. Loidl, Phys. Rev. B 63, 224416 (2001).
- Aarbogh et al. (2006) H. M. Aarbogh, J. Wu, L. Wang, H. Zheng, J. F. Mitchell, and C. Leighton, Phys. Rev. B 74, 134408 (2006).
- Tsubouchi et al. (2004) S. Tsubouchi, T. Kyômen, M. Itoh, and M. Oguni, Phys. Rev. B 69, 144406 (2004).
- He et al. (2009) C. He, H. Zheng, J. F. Mitchell, M. L. Foo, R. J. Cava, and C. Leighton, Appl. Phys. Lett. 94, 102514 (2009).
- Yamaguchi et al. (1996) S. Yamaguchi, Y. Okimoto, H. Taniguchi, and Y. Tokura, Phys. Rev. B 53, R2926 (1996).
- Babushkina et al. (2008) N. A. Babushkina, A. N. Taldenkov, A. V. Inyushkin, A. Maignan, D. I. Khomskii, and K. I. Kugel, Phys. Rev. B 78, 214432 (2008).