Present address: ]Muon Science Laboratory, Institute of Materials Structure Science, High Energy Accelerator Research Organization, Tsukuba,
Li diffusion in LixCoO2 probed by muon-spin spectroscopy
Abstract
The diffusion coefficient of Li+ ions () in the battery material LixCoO2 has been investigated by muon-spin relaxation (SR). Based on the experiments in zero-field and weak longitudinal-fields at temperatures up to 400 K, we determined the fluctuation rate () of the fields on the muons due to their interaction with the nuclear moments. Combined with susceptibility data and electrostatic potential calculations, clear Li+ ion diffusion was detected above K. The estimated from was in very good agreement with predictions from first-principles calculations, and we present the SR technique as an optimal probe to detect for materials containing magnetic ions.
pacs:
76.75.+i, 66.30.H-, 82.47.Aa, 82.56.LzIn spite of a long research history on lithium insertion materials for Li-ion batteries Ohzuku , e.g., LiCoO2, LiNiO2, and LiMn2O4, one of their most important intrinsic physical properties, the Li+ ions diffusion coefficient (), has not yet been determined with any reliability. Although Li-NMR is, in general, a powerful technique to measure for non-magnetic materials, it is particularly difficult to evaluate for materials containing magnetic ions, because the magnetic ions induce additional pathways for the spin-lattice relaxation rate (), resulting in huge compared with that expected for only the diffusive motion of Li ions.
Such difficulty was clearly evident in the curve for LiCoO2 and LiNiO2 Tomeno ; Nakamura , and, for that reason, was instead estimated from the Li-NMR line width Nakamura_2 . However, since the line width, i.e., the spin-spin relaxation rate () is also affected by the magnetic ions, the obtained by Li-NMR for LiCoO2 (cm2s-1 at 400 K) is approximately four orders of magnitude smaller than predicted by first-principles calculations Ven . Since lithium insertion materials always include transition metal ions, in order to maintain charge neutrality during the extraction and/or insertion of Li+ ions, it is consequently very difficult to determine for these compounds unambiguously by Li-NMR.
On the other hand, the chemical diffusion coefficient (), which is measured under a potential gradient, has also been determined by electrochemical measurements. Note that the relationship between and is given by , where is a thermodynamic factor. The magnitude of is, however, known to be very sensitive to the measurement system, e.g., the electrolyte as well as the compositions of the positive and negative electrodes. As a result, the reported for LixCoO2 ranges from to cm2s-1 for powder samples Mizushima_2 ; Yao ; Pyun ; Dokko1 ; Dokko2 and from to cm2s-1 for thin films Striebel ; Rho ; Xia ; Tang at ambient . In order to profoundly understand the physics behind the operation principle of battery materials, it is imperative to have a reliable probe to measure for all the components of the battery as a function of both Li content as well as . This is at present a key issue for further development of Li-ion batteries, and in particular for future fabrication of solid-state batteries.
In contrast to NMR, the effect of localized moments in a paramagnetic (PM) state on the SR signal is very limited at high , because the PM fluctuation is usually too fast to be visible by SR. Furthermore, although SR is very sensitive to the local magnetic environment, whether it is due to electronic or nuclear spins, an electronic contribution is, in principle, distinguishable from a nuclear contribution by weak longitudinal field measurements. In addition, since the SR timescale is different from the NMR’s one, SR is expected to provide unique information on nuclear magnetic fields. Indeed, SR studies of LixCoO2 at low indicate that s feel a nuclear magnetic field caused by Li and 59Co even at 1.8 K Jun_1 ; Mukai . This offers a possibility to determine of LixCoO2 by SR, if s locate in the vicinity of the O2- ion and make a stable -O2- bond in the LixCoO2 lattice. Here, we report our initial work on LixCoO2 (=0.73 and 0.53) to estimate their and establish SR as a novel tool to probe Li-ion diffusion.
A powder sample of LiCoO2 was prepared at Osaka City University by a solid-state reaction technique using reagent grade LiOHH2O and CoCO3 powders as starting materials. A mixture of the two powders was heated at 900oC for 12 h in air. Powder X-ray diffraction (XRD) analysis showed that the LiCoO2 sample was single phase with a rhombohedral system of space group ( nm and nm in hexagonal setting). The Li-deficient samples were prepared by an electrochemical reaction using LiLiPF6-ethylene carbonate-diethyl carbonateLiCoO2 cells. The LiCoO2 powder was pressed into a disc with 15 mm diameter and 0.4 mm thickness, and the disc was then used as a positive electrode. The LixCoO2 disk was removed from the cell in a glove-box and packed into a sealed powder cell just before the SR measurement. Their structures were subsequently confirmed by powder XRD, and, finally, their compositions were checked by an inductively coupled plasma atomic emission spectral analysis. The above procedure is essentially the same as that of our previous SR work on LixCoO2 Mukai and LixNiO2 Jun_2 .
The SR spectra were measured at the ARGUS surface muon beam line of the RIKEN-RAL Muon Facility at ISIS in the UK using a liquid-He flow type cryostat in the range between 10 and 400 K. The experimental techniques were described elsewhere Kalvius . was measured using a SQUID magnetometer (MPMS, Quantum Design) in the range between 5 and 200 K under a magnetic field of = 100 Oe.
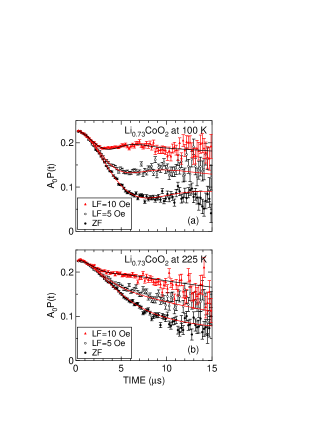
Figure 1 shows the zero field (ZF-) and longitudinal field (LF-) SR spectrum for the Li0.73CoO2 sample obtained at 100 and 225 K. At 100 K, the ZF-spectrum exhibits a typical Kubo-Toyabe (KT) behavior with a minimum at s, meaning that the implanted muons see the internal magnetic field () due to the nuclear magnetic moments of 7Li, 6Li and 59Co. The applied LF clearly reduces the relaxation rate, i.e., the time slope, by decoupling . Although the ZF-spectrum still shows KT behavior at 225 K, the relaxation rate is smaller than at 100 K.

In order to estimate the KT parameters precisely, the ZF- and two LF-spectra were fitted simultaneously by a combination of a dynamic Gaussian KT function [] and an offset signal from the fraction of muons stopped mainly in the sample holder, which is made of high-purity aluminum;
| (1) |
where is the empirical maximum muon decay asymmetry, and are the asymmetries associated with the two signals. is the static width of the local field distribution at the disordered sites, and is the field fluctuation rate. When and , is the static Gaussian KT function in ZF. At first, we fitted all the ZF-spectra using common and in Eq. (1). The “global fit” provided that and for Li0.73CoO2 (Li0.53CoO2). Then, using the obtained and , one ZF- and two LF-spectra were global-fitted using common and at each .
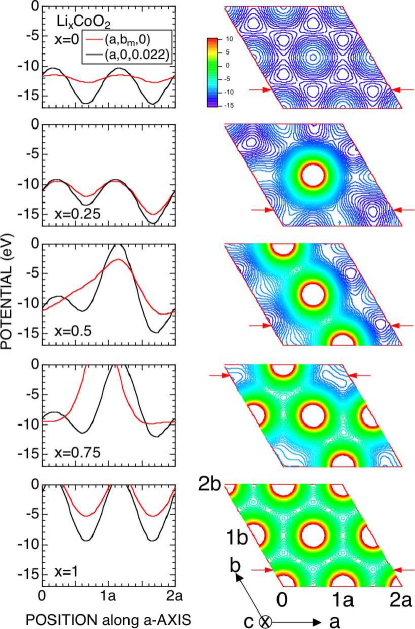
Figure 2 shows the dependencies of both and for the two samples together with measured in a 100 Oe magnetic field. For Li0.73CoO2, is almost constant for K, indicating that the are most probably stable in the crystal lattice until K. then rapidly decreases, but levels off again for 325 K. The curve is almost -independent up to 150 K, starts to increase at K, and exhibits a maximum at 275 K. Above 275 K, decreases to s-1 at K, and finally becomes almost -independent above 350 K. The increase in between 150 and 275 K is well explained by a thermal activation process [Figs. 2(g) and 2(h)], which signals the onset of diffusive motion of either Li+ or above 150 K. The clear decrease in at K also suggests an additional diffusion of Li+ or .
The curve exhibits a small anomaly around 150 K with a thermal hysteresis of K, while there is no indication of any magnetic anomalies in the range between 200 and 300 K [Figs. 2(e) and 2(f)] Jun_1 ; Mukai . This suggests that the change in the SR parameters around 150 K is caused by an intrinsic change in LixCoO2, but the change around 300 K is visible only by SR. The increase in above 150 K is, thus, most unlikely due to diffusion but it is rather due to Li+ diffusion, i.e., either a freezing of the Li+ motion or an order-disorder transition of the Li+ ions occurs below around 150 K. This is also supported by a recent 7Li-NMR experiment Nakamura_3 , in which the NMR line width -vs.- curve for Li0.6CoO2 exhibits a step-like decrease with around 150 K by motional narrowing due to Li+ diffusion. Since such diffusion naturally increases a local structural symmetry, it is reasonable that slightly decreases with around 150 K. On the other hand, both Li+ and are inferred to be diffusing above 300 K, resulting in the large decrease in caused by motional narrowing. Actually, because above 300 K, Eq. (1) is roughly equivalent to an exponential relaxation function [], and it is difficult to estimate and precisely at high .
The result for Li0.53CoO2 sample is very similar to that of Li0.73CoO2, although (Li0.53CoO(Li0.73CoO2) due to the decrease in the number density of Li+ ions, as reported previously Jun_1 ; Mukai . Also, the magnitude of of Li0.53CoO2 is smaller than of Li0.73CoO2 in the whole range measured, but the curve for both samples show a clear increase with above 150 K and a maximum around 300 K.
In order to predict the muon site(s) and to confirm the reliability of the above assumption that Li+ ions diffuse above 150 K whereas diffuse only above 300 K, we performed electrostatic potential () calculations for the LixCoO2 lattice using a point-charge model and the program DipElec Kojima . As seen in Fig. 3, the site in the vicinity of the O2- ions is more stable for than the site in the Li plane for the whole range between 1 and 0. This means that ’s are bound to the O2- ions so as to make a stable -O2- bond in LixCoO2. This is a common situation in oxides, as for example in the case for the high- cuprates Adams . Since s are assigned as an ideal point charge, such -O2- bond should be purely ionic. In fact, dipole field calculations for the site in the vicinity of the O2- ions provide that s s-1) for LixCoO2 with . Furthermore, is found to be comparable to measured at low in the whole range for LixCoO2 Mukai , if we consider the reduction of by the electric field gradient effect on the nuclear moments with Hayano ; Kaiser . This suggests that the point-charge model is acceptable for determining the muon site(s) in LixCoO2. As a result, it is clarified that, as increases from 5 K, the Li+ ions start to diffuse above 150 K () and then the diffuse above 300 K (), in spite of the mass difference between and Li+ () because the muons form a hydrogen-like bond with oxygen.
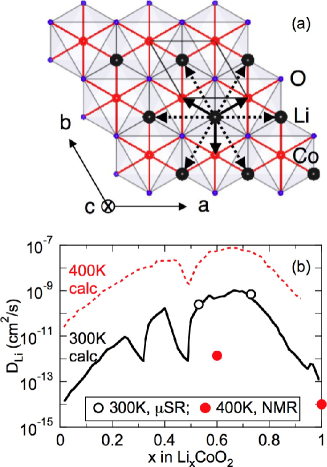
Finally, we estimate using the obtained fluctuation rate as directly measuring the jump rate. Figure 4(a) shows the possible jump paths for the Li ions. That is, the direct jump to the nearest (vacant) Li site (path No. 1) and the jump to the interstitial site in the center of the oxygen tetrahedron (path No. 2). Assuming that corresponds to the jump rate of the Li ions between the neighboring sites, is given by Borg ;
| (2) |
where is the number of Li sites in the -th path, is the vacancy fraction, and is the jump distance. Here, we naturally restrict the path to lie in the -plane, i.e., along the 2D channel, because it is most unlikely that the Li ions jump across the CoO2 plane to an adjacent Li plane. Therefore, , , is equivalent to the -axis length, , for Li0.73CoO2 (0.47 for Li0.53CoO2), and . As a result, we obtain cm2/s [ cm2/s] for Li0.73CoO2 [Li0.53CoO2] at 300 K. Here, K) for Li0.73CoO2 was estimated from the extrapolation of the linear relationship between log[] and [see Fig. 2(g)]. The estimated is found to be very consistent with the prediction by first-principle calculations Ven , as seen in Fig. 4(b). Note that the jump paths used in Eq. (2) are the same to those for the first-principle calculations. This means that there is no ambiguous factor for estimating by SR. Since SR detects ranging from to , it is applicable for materials with cm2/s, when , , nm, and s-1.
In conclusion, we have been able to determine the Li diffusion coefficient, , of LixCoO2 from the fluctuation rate of the field experienced by the muons in interaction with the nuclear moments of the diffusing ions. The value was found to be in good agreement with theoretical predictions. Consequently, we would like to suggest SR as a novel probe to investigate Li diffusion, especially for materials containing transition metal ions.
This work was performed at the RIKEN-RAL Muon Facility at ISIS, and we thank the staff for help with the SR experiments. We appreciate T. Ohzuku and K. Ariyoshi for sample preparation and K. Yoshimura for discussion. JS and YI are supported by the KEK-MSL Inter-University Program for Overseas Muon Facilities. This work is also supported by Grant-in-Aid for Scientific Research (B), 19340107, MEXT, Japan. The image involving crystal structure was made with VESTA.
References
- (1) T. Ohzuku and R. Brodd, J. Power Sources 174, 449 (2007).
- (2) I. Tomeno and M. Oguchi, J. Phys. Soc. Jpn. 67, 318 (1998).
- (3) K. Nakamura et al., Solid State Ionics 121, 301 (1999).
- (4) K. Nakamura et al., Solid State Ionics 135, 143 (2000).
- (5) A. Van der Ven and G. Ceder, Electrochem. Solid-State Lett. 3, 301 (2000).
- (6) K. Mizushima et al., Solid State Ionics 3-4, 171 (1981).
- (7) C. Y. Yao et al., J. Power Sources 54, 491 (1995).
- (8) S.-Il Pyun and Y.-M. Choi, J. Power Sources 68, 524 (1997).
- (9) K. Dokko et al., J. Electrochem. Soc. 148, A422 (2001).
- (10) K. Dokko et al., J. Power Sources 189, 783 (2009).
- (11) K. A. Striebel et al., J. Electrochem. Soc. 143, 1821 (1996).
- (12) Y. H. Rho and K. Kanamura, J. Electrochem. Soc. 151, A1406 (2004).
- (13) H. Xia et al., J. Electrochem. Soc. 154, A337 (2007).
- (14) S.B. Tang et al., J. Alloys Compounds 449, 300 (2008).
- (15) J. Sugiyama et al., Phys. Rev. B 72, 144424 (2005).
- (16) K. Mukai et al., Phys. Rev. Lett. 99, 087601 (2007).
- (17) J. Sugiyama et al., Phys. Rev. B 78, 144412 (2008).
- (18) G. M. Kalvius et al., in Handbook on the Physics and Chemistry of Rare Earths, edited by K. A. Gschneidner et al., 32, Ch. 206 (Elsevier Science B. V. Amsterdam, 2001), and references cited therein.
- (19) K. Nakamura et al., Solid State Ionics 177, 821 (2006).
- (20) K. M. Kojima et al., Phys. Rev. B 70, 094402 (2004).
- (21) T. R. Adams et al., Hyperfine Interact. 86, 561 (1994).
- (22) R. S. Hayano et al., Phys. Rev. B 20, 850 (1979).
- (23) C. T. Kaiser et al., Phys. Rev. B 62, R9236 (2000).
- (24) R. J. Borg and G. J. Dienes, in An Introduction to Solid State Diffusion, (Academic Press, San Diego, 1988).