Observational evidence for the link between the variable optical continuum and the subparsec-scale jet of the radio galaxy 3C 390.3
Abstract
The mechanism and the region of generation of variable continuum emission are poorly understood for radio-loud AGN because of a complexity of the nuclear region. High-resolution radio VLBI (very long baseline interferometry) observations allow zooming into a subparsec-scale region of the jet in the radio-loud galaxy 3C 390.3. We combined the radio VLBI and the optical data covering the time period of 14 years to look for a link between optical flares and parsec-scale jet. We identify two stationary and nine moving radio features in the innermost subparsec-scale region of the jet. All nine ejections are associated with optical flares. We found a significant correlation (at a confidence level of ) between the ejected jet components and optical continuum flares. The epochs at which the moving knots pass through the location of a stationary radio feature and the optical light curve reaches the maximum are correlated. The radio events follow the maxima of optical flares with the mean time delay of years. This correlation can be understood if the variable optical continuum emission is generated in the innermost part of the jet. A possible mechanism of the energy release is the ejection of knots of high-energy electrons that are accelerated in the jet flow and generate flares of synchrotron continuum emission in the wide range of frequencies from radio to X-ray bands. In this scenario, the beamed optical continuum emission from the jet and counterjet ionizes a gas in a subrelativistic outflow surrounding the jet, which results in a formation of two outflowing conical regions with broad emission lines (in addition to the conventional broad line region around the central nucleus).
keywords:
galaxies: jets – galaxies: nuclei – galaxies: individual: 3C 390.3 – radiation mechanisms: non-thermal.1 Introduction
The variable continuum flux in AGN, signaling the activity of the central engine, is detected throughout the entire electromagnetic spectrum, on time-scales from days to years (Peterson et al. 2002; Zheng 1996; Wamsteker et al. 1997; Shapovalova et al. 2001). The bulk of the continuum flux is believed to be generated in the accretion disk and is responsible for ionizing the cloud material in the broad-line region (BLR). Localization of the source of the variable continuum emission in AGN is instrumental for understanding the mechanism for release and transport of energy in active galaxies. In radio-quiet AGN, representing about 90 % of the AGN population, the presence of rapid X-ray flux variations and iron emission line (Fe K) indicates that most of the soft X-ray emission originates from the accretion disk (Mushotzky et al. 1993). In radio-loud AGN, the activity of the central engine is accompanied by highly-relativistic collimated outflows (jets) of plasma material formed and accelerated in the vicinity of the black hole (Ferrari 1998). Inhomogeneities in the jet plasma appear as a series of compact radio knots (jet components) observed on scales ranging from several light weeks to about a kiloparsec (Alef et al. 1996; Kellermann et al. 2004).
The unification scheme (Urry & Padovani 1995) of radio-loud AGN suggests that the optical continuum associated with the accretion flows and broad emission lines are viewed directly in radio-loud quasars and BL Lacertae objects (BL Lacs). The Doppler boosted continuum emission from the relativistic jet may dominate at all energies in BL Lacs (see Ulrich et al. 1997; Worrall 2005), suggesting that the continuum variability in radio-loud AGN is related to both the jet and the instabilities of accretion-disk flows (Mushotzky et al. 1993; Ulrich et al. 1997). In radio-loud quasars, the beaming of continuum emission is less but optical synchrotron radiation from the core of the jet (3C 273; Soldi et al. 2008) can be still significant. In radio-loud galaxies the emission from accretion disk or hot corona can be hidden by an obscuring torus, and hence, the bulk of the optical continuum and broad-line emission in radio galaxies can be attributed to the relativistic jet rather than the central engine if the boosted jet-emission is still strong, i.e. the jet is intrinsically luminous and highly relativistic.
The presence of a positive correlation between beamed radio luminosity of the jet and optical nuclear luminosity in the sample of radio galaxies suggests that the optical emission is non-thermal and may originate from a relativistic jet (Chiaberge et al. 1999, 2002; Hardcastle & Worrall 2000). In radio-loud quasars, there is evidence for a variable synchrotron optical flare generated around the radio core of PKS 0420-014 (D’Arcangelo et al. 2007) and in the innermost pc region of the jet in BL Lac (Marscher et al. 2008). A correlation between ejection of superluminal knots and dips in the X-ray emission was reported for the radio galaxy 3C 120 (Marscher et al. 2002). Evidence for correlated radio and optical variations has been reported for several AGN with time lags up to few hundreds days (Hanski et al. 2002). The detection of a correlation between variability of the continuum flux and changes in the radio structure in a radio galaxy on subparsec-scales would be the most direct evidence of optical continuum emission coming from the jet. We combine the results from monitoring of the double-peaked broad line radio-loud galaxy 3C 390.3 (redshift ) in the optical from 1992 to 2008 time period (Shapovalova et al. 2001; Sergeev et al. 2002, Shapovalova et al, in preparation), UV (Zheng 1996), and X-ray (Leighly et al. 1997; Gliozzi et al. 2006) regimes with 21 VLBI observations of its radio emission made from 1994 to 2008 as part of the 15 GHz VLBA111Very Long Baseline Array of National Radio Astronomy Observatory, Socorro, NM, USA survey (Kellermann et al. 2004) and our VLBA observations during the time period from 2005 to 2008.
In Sect. 2, we analyze the structure and kinematics of the pc-scale jet in 3C 390.3. Correlations between properties of the compact jet and nuclear optical emission on scales less than one parsec are analyzed in Sect. 3. Variable radio emission from stationary components of the jet is discussed in Sect. 4, and the identification of these stationary components is discussed in Sect. 5. In Sect. 6, we discuss possible radiation mechanism acting in the nuclear region of 3C 390.3.
| Comp. | ||||
|---|---|---|---|---|
| (yr) | (yr) | (mas yr-1) | ||
| (1) | (2) | (3) | (4) | (5) |
| C4 | 1992.79 | 1993.70 | 0.290.03 | 1.050.11 |
| C5 | 1995.62 | 1996.21 | 0.460.03 | 1.630.11 |
| C6 | 1995.66 | 1996.75 | 0.240.02 | 0.870.09 |
| C7 | 1997.15 | 1998.43 | 0.210.03 | 0.740.09 |
| C8 | 1999.29 | 2000.38 | 0.220.04 | 0.780.13 |
| C9 | 2001.65 | 2002.71 | 0.260.05 | 0.900.16 |
| C10 | 2003.11 | 2004.17 | 0.250.04 | 0.900.14 |
| C11 | 2004.89 | 2005.84 | 0.280.06 | 1.010.21 |
| C12 | 2006.63 | 2007.73 | 0.280.08 | 1.000.27 |
Columns are as follows: (1) - Component identifier, (2) - Ejection time from the component D, (3) - Passing time through the stationary component S1, (4) - Angular radial speed, (5) - Radial speed in units of the speed of the light.
2 Structure and kinematics of the parsec-scale jet
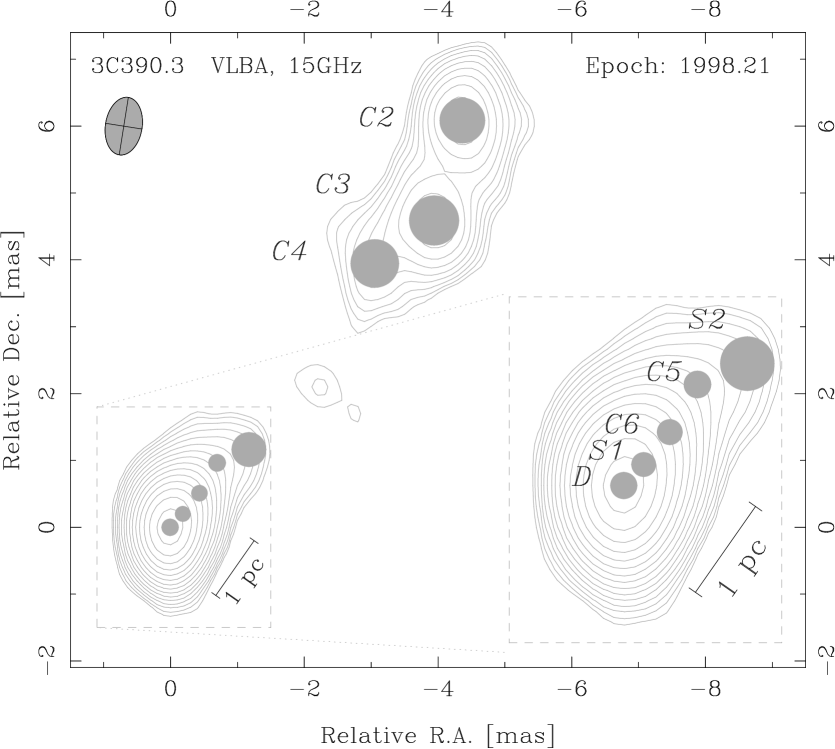
To parameterize the structure of the radio emission, we applied the technique of modelfitting (Pearson 1997) and fit interferometric visibility amplitudes and phases from each of the 21 VLBA datasets by a set of two-dimensional, circular Gaussian features (shaded circles in Fig. 1). Similar fits have been obtained for 17 observations from the 15 GHz VLBA survey database (Kellermann et al. 2004) and for four our observations with the VLBA at 15 GHz, for the purpose of cross-identifying and tracing different features in the jet (Table 3 in the Appendix A). We use the positions and flux densities of these components for tracing the evolution of the jet emission on angular scales of milliarcseconds (mas). At the distance of 3C 390.3, 1 mas corresponds to a linear distance of 1.09 pc for the flat CDM cosmology with the Hubble constant km s-1 Mpc-1 and the matter density .
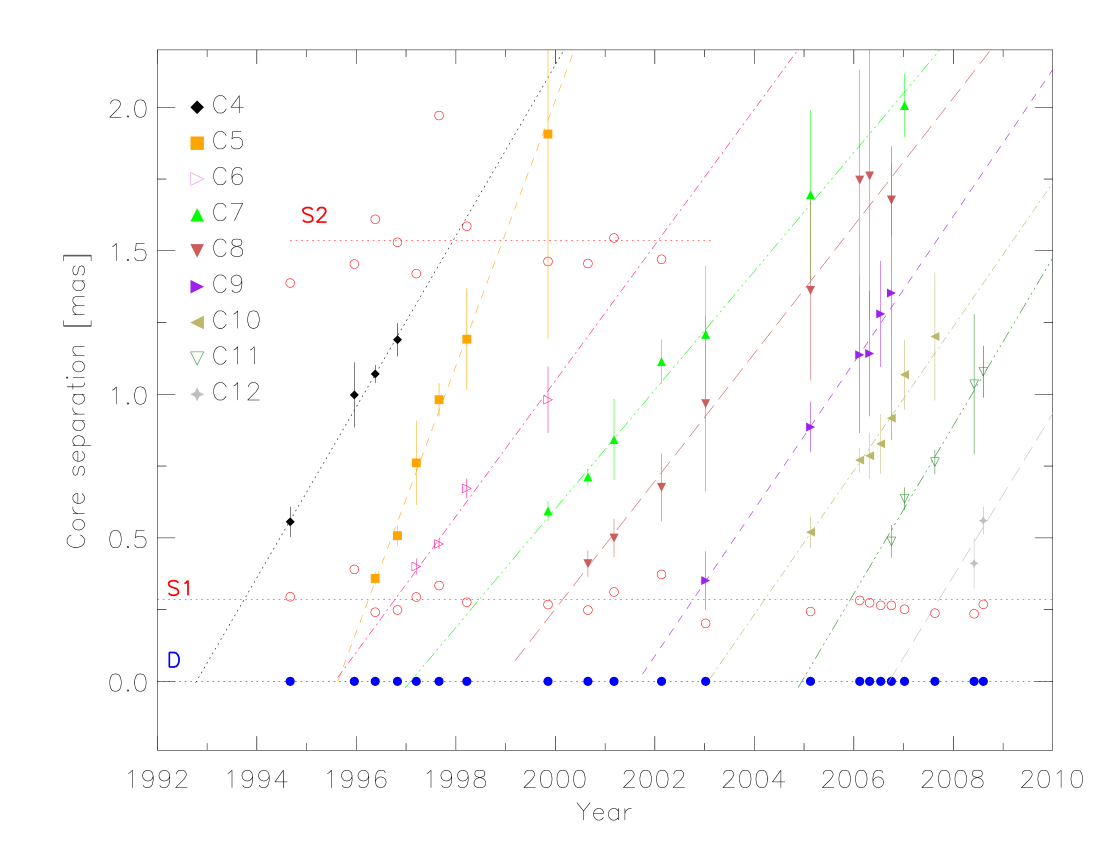
Based on the separations, sizes and flux densities of the Gaussian components located within 3 mas of the feature D at the narrow end of the jet (Fig. 1), we identified nine moving components C4–C12 (in addition to the previously known components C2 and C3; Alef et al. 1996) and two stationary features S1 and S2 separated from D by mas and mas, respectively (Fig. 2). Note that two innermost components D and S1 are spatially resolved and their flux densities are uncorrelated (see Appendix A). The more distant stationary feature S2 is probably related to a small change in the direction of the flow that causes the relativistic brightening of the radio emission (Gómez et al. 1997). The presence of S1 may be related to both geometrical and physical factors. Recent results from close VLBI monitoring of a sample of parsec-scale jets (Jorstad et al. 2001) imply that such stationary features are likely to be common in compact relativistic flows.
Proper motions of (0.2 to 0.5) mas/yr (which correspond to apparent speeds of (0.7 to 1.6) , where is the speed of light) are estimated from linear fits to the observed separations of the components C4–C12 from the component D (Table 1). Resolution of the VLBA data at 15 GHz is not sufficient for detecting moving components at locations between D and S1, since D and S1 are strong, unresolved features separated by less than one beamwidth, while the moving features are less prominent and more extended. High frequency VLBI observations are required to study these angular scales in 3C 390.3. Back-extrapolation of the fits for C5 and C6 indicates that these two components may originate from a single event. They could result from a moving perturbation in the jet that creates a forward and a reverse shock pair (Gómez et al. 1997) or trailing features behind a strong relativistic shock (Gómez et al. 2001; Agudo et al. 2001). We use the linear fits to estimate, for each moving component, the epoch, , at which it was ejected from the component D and the epoch, , when it passed through the location of the stationary feature S1 (see Table 1, Figs. 2 and 3). For C12 component, these epochs are estimated using the mean slope of the best-fits of eight components (C4-C11).
3 Link between subpc-scale jet and variable optical continuum emission
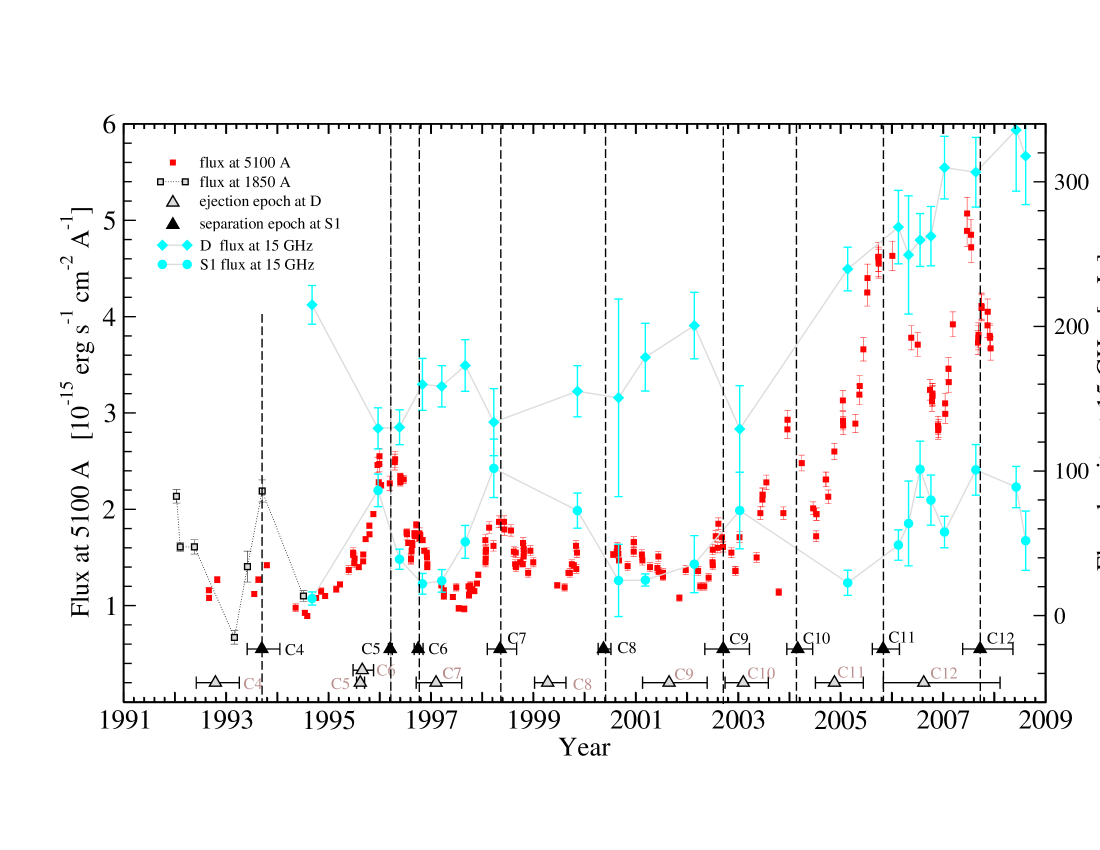
Optical fluxes and its errors measured at 5100Å (rest frame) from observations of 3C 390.3 between 1995 to 1999 (Fig. 3; red squares) are published in Shapovalova et al. (2001) and Sergeev et al. (2002). During the time period from 2000 to 2007, spectra of 3C 390.3 (97 nights) were taken with the 6 m and 1 m telescopes of the Special Astrophysical Observatory of Russian Academy of Sciences (SAO RAS, Russia) and at the 2.1 m telescope of the “Guillermo Haro Observatory” at Cananea, Sonora (México), respectively. Long-slit spectrographs, equipped with CCD detector arrays, were used to cover the typical wavelength interval from 4000 Å to 7500 Å with spectral resolution between 5 Å and 15 Å and the signal-to-noise ratio 50 in the continuum near H and H emission lines. The uncertainty in our flux determinations for the continuum is 3 %. Detailed description of the method and measurements of optical fluxes are given in Shapovalova et al. (2001). Optical continuum fluxes measured at 5100 Å between 2000 and 2007 are presented in the Table 2 (for a full table see the online Supporting Information).
| UT-date | JD | Flux at 5100 Å |
|---|---|---|
| (2400000+) | ||
| 1 | 2 | 3 |
| 2000Jul19 | 51745.363 | 1.557 0.047 |
| 2000Jul22 | 51748.230 | 1.602 0.048 |
| 2000Jul30 | 51756.293 | 1.543 0.046 |
| 2000Oct05 | 51823.141 | 1.410 0.042 |
| 2000Nov18 | 51867.137 | 1.558 0.047 |
| 2000Nov18 | 51867.223 | 1.661 0.050 |
| 2000Nov19 | 51868.129 | 1.660 0.050 |
| 2001Jan16 | 51925.633 | 1.533 0.046 |
| 2001Jan20 | 51929.621 | 1.465 0.044 |
| 2001Mar13 | 51981.949 | 1.396 0.042 |
Variations of the optical continuum emission (Fig. 3; red squares) exhibit a superposition of weak flares (few weeks to several months), prominent flares (from months to years) and a long-term rising trend (few decades). The later is seen also in the historical light curve of the optical continuum in 3C 390.3 (e.g. Shapovalova et al. 2001). It is remarkable, that all nine ejections are associated with nine optical flares happening on timescales from few months to few years (Fig. 3). This suggests that the frequency of optical flares and the ejection rate of jet components are interconnected. A link between the optical flares and the stationary component S1 in the radio jet is suggested by a correlation between the maxima of optical flares and the characteristic epochs of the moving components C4–C12 (Fig. 3). For these nine components, the epochs of separation from the stationary feature S1 are coincident, within the errors, with the maxima in the optical continuum flares. All nine ejection events occur within yr after a local maximum is reached in the intensity of the optical continuum. Considering that there are about 14 years of optical data, we estimate the probability that maxima of optical flares and ejections from S1 are associated by chance in the 0.3 yr window. The probability of any single ejection event at S1 occurring randomly less than 0.3 yr after a maximum of optical flare is about 0.02. The significance of the null hypothesis that all nine events happen by chance is and can be rejected at a confidence level of % (for a description of the statistical test see Marscher et al. 2002). The significance is still high () even without two components C4 and C8 for which the gaps in the optical data do not allow the timing of the optical maxima although the data is consistent with a maximum.
This is a clear evidence that the passage of moving radio knots through the location of the stationary component S1 and optical continuum flares are physically related. The radio events follow the maxima of optical flares with the mean time delay of yr. The average distance between the region where the optical flare reaches maximum and the component S1 is measured to be pc (or 0.36 pc from D) adopting that the knots propagate with the mean apparent speed during the time period of yr. Radio events are associated with optical flares occurring on time-scales of about a few months to a few years (Fig. 3). The rise of all nine optical flares occurs between two radio events, the ejection from component D and separation from S1 (Fig. 3) suggesting that the generation of variable optical emission happens in the innermost part of the jet, between D and S1, as a result of propagation of these ejections along the jet. The generation of optical flares and its characteristics such as the amplitude, timescale and the frequency are likely to be related to the properties of the subparsec-scale jet: ejection rate, structure and kinematics. Therefore, understanding the physical nature of the regions D and S1 is important for understanding the structure of the central engine in 3C 390.3 and location of continuum source(s) producing the variable continuum radiation.
4 Variable radio emission of the stationary components in the jet
Variations of the flux densities of D and S1 components of the jet ( and ) are shown in Fig. 3 (cyan circles and cyan diamonds). The relatively sparse time sampling of the VLBI measurements does not allow us to test for a correlation between radio flares and epochs of ejections. Fractional variability amplitude of S1 (), defined as in Lu & Yu (2001), is about two times higher than that of D and the optical emission ( and , respectively). The optical and radio flux densities of D increase by the same factor (3 times) from 1996 to 2008 showing a surprisingly similar behaviour over a time period of 14 years, while the radio flares from S1, varying on scales from a few months to a few years, show some correlation with the optical flares having comparable timescales. Moreover, magnitudes of the optical and radio flares are comparable in S1, with the flux density varying by a factor of three for optical continuum flux and a factor of four in the radio. It is therefore likely that the optical variations on timescales of few decades are related to the radio variability of the component D, while the optical flares are coupled with radio flares of S1 component of the jet.

We used the Z-transformed correlation function (Alexander 1997) to calculate the correlation between and as this method can deal with sparsely sampled data. The correlation function between and have two peaks at a timelag around days and days (implying that radio flares lead optical flares with time lag of about one year), with a correlation coefficient of around . Correlation function between and has a flat shape and high correlation coefficient, around , with time lags from 200 days to 400 days and from -400 days to -500 days. The present data suggest a correlation between variations of optical and radio emission curves but uncertainties of the correlation coefficient are large (because of the poor radio sampling) for making final conclusions. A denser VLBI radio sampling covering a time period of several years is needed to improve the correlation observed between the radio and optical flares.
5 Physical identification of the regions D and S1
The presence of several apparently stationary features in the radio jet of 3C 390.3 may be explained in several different ways. According to present models of relativistic jets (Marscher et al. 2008, and references therein), the plasma material accreted onto central nucleus is collimated into the jet. At the base of the jet, the jet flow either becomes supersonic (Daly et al. 1988) or optically thin (Königl 1981; Lobanov 1998) or releases the energy contained in the Poynting flux (Romanova & Lovelace 1996). The plasma material is then accelerated and collimated into continuous jet flow by helical magnetic fields on typical scales of Schwarzschild radii. At the end of the acceleration and collimation zone ( pc), the jet flow may become turbulent (due to weakening of the helical magnetic field) and end in a standing conical shock associated with the radio core of the jet (Marscher et al. 2008).
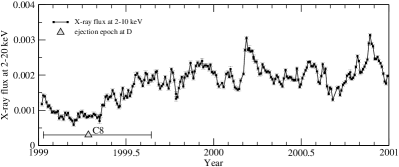
The link between the ejection epochs of jet components and the dip in the X-ray was found for two radio galaxies 3C 120 and 3C 111 (Marscher et al. 2002; Marscher 2006). This correlation was interpreted as accretion of the X-ray-emitting gas in the disk into the central black holes and ejection of a fraction of the infalling matter into the jet (Marscher et al. 2002). We found a similar correlation between the ejection epochs of the components C5 and C8 and the dip in the X-ray flux (see Fig. 4) and hardening of the spectrum (Arshakian & Belloni 2006). The ejection of C4 and C8 components happens during the dip in the X-ray flux suggesting that the component D is located near the black hole. Adopting an angle222On the assumption that the pattern speed and bulk speed of the jet of 3C 390.3 are equal, the jet inclination angle , bulk Lorentz factor and beaming angle are estimated using the variable Doppler factor (Lähteenmäki & Valtaoja 1999) and the maximum apparent speed of observed in the compact jet. of 50∘ between the jet and the line of the sight, the corresponding de-projected distance between D and S1 is pc pc. The average brightness temperature of the component D, K, is close to the inverse Compton limit K (Kellermann & Pauliny-Toth 1969) while the K of S1 component suggests that the synchrotron radiation mechanism maintains the approximate equipartition in energy between the particles and the magnetic field in the region around S1 (Readhead 1994). The component D can be identified with the accretion disk or hot corona, actual base of the jet or the radio core.
The high brightness temperature rules out the D being the accretion disk or hot corona since the brightness temperature for three major accretion disk models is estimated to be less than K. Standard disks are characterized by a balance between radiative cooling and viscous heating (Shakura & Sunyaev 1973). For a typical quasar with and W, the effective temperature will be K at a radius of ( is the Schwarzschild radius for a black hole of mass , where is the Newtonian gravitational constant). However, a hot thin corona ( keV; K) above the disk layer can be a bright source of radiation by means of inverse Compton scattering of UV photons from the disk (Haardt & Maraschi 1991, 1993). Advection-dominated accretion flow (ADAF) is radiatively inefficient so that most of heat produced through accretion is preserved (Narayan & Yi 1994). The ADAF model predicts that the mass accretion rate is a factor of of the Eddington limit and that the electron temperature is above K for (Manmoto et al. 1997). The slim disk model, with an extremely high mass accretion rate above the Eddington limit, was proposed by Abramowicz et al. (1988). The disk is hotter than the standard disk because of the high accretion rate. The brightness of the blackbody radiation from slim disks is K. However, as in the case of standard disks, a hot corona may produce a radiation with K.
The mean brightness temperature of the D component is higher than that of the S1, , suggesting that D is the radio core of the jet rather than the base of the jet. Were D the core of the counterjet and S1 the core of the approaching jet, we should expect that because of relativistic (Doppler) beaming effect. The fact that over the 14 years of monitoring period (see Fig. 3) rules out D being the core of the counterjet. The component D should then be associated with the radio core of the jet and its emission is non-thermal and generated by inverse Compton mechanism ( K). Then the component S1 should be associated with the standing shock (a common feature seen in superluminal AGN) downstream from the radio core. This is supported by the average K estimated for S1 component, which is close to the equipartition limit ( K; Readhead 1994).
Alternative scenario assumes that the component D is the base of the jet located in the immediate vicinity of the central black hole. Then the S1 stationary feature should be the radio core of the jet. Location of D near the accretion disk is supported from the X-ray data (Fig. 4). Very long-term variations (on time-scales of decades) of radio emission from D component is not characteristic for the jet emission which varies on time scales from months to years. Variations from D component on time-scales of decades mimic very long-term variations of optical continuum emission (Fig. 3) which is probably generated in or above a hot corona at a distance 200 above the accretion disk (Fabian 2004; Ponti et al. 2004). The non-thermal radio emission at the base of the jet can be generated by synchrotron or inverse Compton ( K) mechanisms by free electrons of corona accelerated in the rotating and twisted magnetic fields generated by the accretion disk.
Another possibility is that D and S1 are two independent, active nuclei in the binary black hole system. The binary black hole scenario cannot explain the correlated, simultaneous variability of the red and blue wings of the H line (Shapovalova et al. 2001). If the two black holes are located in D and S1, the total mass of the binary must exceed . The observed radial velocity changes indicate a possible periodicity shorter than 100 yr (Shapovalova et al. 2001), pushing the total mass of the binary to , in contradiction with the mass of measured using the reverberation mapping technique (Kaspi et al. 2000). The trends observed in the radial velocities cannot be reconciled with the orbital motion in a binary black hole (Eracleous et al. 1997). Thus it is also difficult to use a binary system with two black holes located in D and S1 as an explanation for the observed properties of 3C 390.3.
To understand the radiation mechanism and structure of the inner nuclear region of radio-loud galaxy 3C 390.3, it is fundamental to identify and locate the D and S1 regions. This requires multi-frequency VLBI observations to measure the spectral index and polarization of stationary components of the compact jet.
6 Discussion and conclusions
Soldi et al. (2008) have carried out multiwavelength of the quasar 3C 273 (Soldi et al. 2008), and have shown that its emission is complex due to the presence of many emission regions in the central engine. They suggested that variable optical emission is non-thermal and it is likely to be generated in the base of the jet. Evidence for optical synchrotron emission generated in and near the radio core of the jet comes from monitoring of radio and optical polarized emission of the quasar PKS 0420-014 (D’Arcangelo et al. 2007). Concurrent changes of the polarization angle at optical and radio (43 GHz) indicate that these variable emission is non-thermal and originate in the same region around the radio core. While the emission of the accretion disk is viewed directly for a quasar, it is hidden in radio galaxies by the dusty torus. Very weak (or absent) blue bump in 3C 390.3 (Wamsteker et al. 1997) indicates that the accretion disk is obscured and most of variable optical continuum emission could be generated in the jet.
The significant correlation found between the optical flares and the epochs can be interpreted in terms of disturbances (radio knots) propagating from the location of D component to the S1 stationary component. If the component D is the base of the jet then the following physical scenario is likely. A portion of the disk X-ray emitting material accreted onto central nucleus is ejected from the base of the jet (in the immediate vicinity from the black hole) at the epoch . The knot of electrons accelerated to high energies radiates a rising emission in X-ray, optical and radio as it propagates upstream from the base of the jet. The jet becomes visible in radio at because of the emitting region of the jet becoming optically thin or denser (Königl 1981; Romanova & Lovelace 1996). Alternatively, if the component D is the core of the jet then the rising synchrotron emission from X-ray to radio bands can be produced between D and S1 components by acceleration of the knot (shock?) in a helical magnetic field (Marscher et al. 2008) and/or evolution of the shock spectrum (or turnover frequency; Valtaoja et al. 1992). The minimum Doppler factor is required to increase the optical flux by factor of 2.5 (see Fig. 3), if the jet flow accelerates from to and the apparent speed of the jet is . This value is in reasonably good agreement with the measured variable Doppler factor (Lähteenmäki & Valtaoja 1999). Then the component S1 should be a standing shock formed by continuous relativistic flow (Gómez et al. 1995). The moving knot would be compressed by the shock wave thus producing variable emission in a wide range of electromagnetic spectrum as indicated from multiwaveband polarization variability (D’Arcangelo et al. 2007). As the disturbance passes the standing shock S1, which manifests the end of the acceleration zone, it expands adiabatically because of low magnetic field strength and low electron density, and the optical flux drops down on time scales of yr, while the high frequency radio emission lasts much longer because low-energy electrons have longer lifetimes. In this scenario, the timescale and amplitude of non-thermal optical flares depend on kinematics and emitting power of moving perturbations in the innermost subparsec-scale region of the jet.
Variations of the broad-line emission in 3C 390.3 follow the optical continuum with some time delay which is estimated by various authors to be in the range from about 20 days to 100 days (Wandel et al. 1999; Kaspi et al. 2000; Shapovalova et al. 2001; Sergeev et al. 2002). If the variable optical emission is being generated by shocks in the innermost part of the jet then the beamed continuum emission from the jet must ionize the gas around the jet thus producing the BLR downstream from the ‘classical’ virialized BLR ionized by the optical emission generated in the accretion disk. An outflowing, non-virialized BLR can be generated in the rotating subrelativistic outflow (Murray et al. 1997; Proga et al. 2000) surrounding the jet. In BL Lac type objects (in which the jet oriented near the line-of-sight) moving superluminal components also may produce the short-term radio flares, optical, X-ray and even gamma-ray flares (Marscher et al. 2008) when passing near the line-of-sight of the observer. In the case of 3C 390.3 the jet is inclined at , hence, the Doppler beaming of continuum emission is weak towards the observer but the emission is enhanced in the direction of the jet and able to ionize the conical outflowing BLR with a half-opening angle2 . In radio-loud galaxies there could be two regions of generation of variable optical emission, non-thermal emission in the innermost part of the jet and thermal optical emission in the accretion disk.
The existence of the jet-excited outflowing BLR in 3C 390.3 will question the assumption of virilized motion in the BLR (Kaspi et al. 2000) of all radio-loud AGN, galaxies and quasars, and, hence, the applicability of the reverberation mapping (Peterson et al. 2002) to estimate the black hole masses of radio-loud AGN. Time delays and profile widths measured during periods when the jet emission is dominant may not necessarily reflect the Keplerian motion in the disk, but rather trace the rotation and outward motion in an outflow. This can result in large errors in estimates of black hole masses made from monitoring of the broad-line emission. In the case of 3C 390.3, the black hole mass () estimated effectively from the measurements near the maximum in the continuum light curve (Shapovalova et al. 2001) is significantly larger than the values () reported in other works (Wandel et al. 1999; Kaspi et al. 2000). This difference is reconciled by considering the line width ( km s-1) and the time delay ( days) between the optical continuum and line fluxes near the minimum of the continuum light curve, which yields . The possible existence of an outflow-like region in a number of radio-loud AGN should be taken into account when estimates of the nuclear mass are made from the variability of broad emission lines.
The presence of the jet-excited nonvirial BLR in radio-loud AGN is capable of explaining some of the spectral characteristics of emission lines. Depending on the orientation of the jet, the approaching and rotating outflow material in the BLR will imprint prominent signatures on the emission lines. At small viewing angles of the jet this BLR may produce blue-shifted and single-peaked broad emission lines, while non-shifted and double-peak emission lines (Eracleous & Halpern 2003) will be observed at large angles of the outflowing BLR to the line of sight. The narrow emission lines will have similar characteristics (Boroson 2005) being ionized in the approaching subrelativistic outflow by the beamed continuum emission of the jet.
The correlation found for 3C 390.3, between the epochs of maxima in optical flares and passing of radio knots through S1 component, is also confirmed for the radio galaxy 3C 120 (León-Tavares et al. 2009). To check whether this correlation is common for other galaxies we conducted coordinated long-term radio-optical observations of several nearby radio-loud galaxies. A denser VLBI radio sampling covering a time period of several years is required to resolve the correlation between variabilities of the radio emission of the jet components and the optical continuum, and further to constrain the models for the nuclear region of radio-loud galaxies.
The principal results of this work comes from analysis of combined radio VLBI (15 GHz), optical/UV and X-ray data of the radio-loud galaxy 3C 390.3, and they can be summarized as follows:
-
1.
Structure of the parsec-scale jet: from ten epochs of VLBI observations we identified three stationary components (D, S1 and S2) and nine moving components (C4-C12) of the jet on scales of a few parsecs. Apparent speeds of moving components are estimated to be in the range from 0.7 to 1.6 .
-
2.
We found a new correlation between the local maxima in the optical continuum light curve and the epochs at which the moving components of the jet pass the stationary radio feature S1. Nine radio events follow the peaks of optical flares with the mean time delay of months. Optical flares brighten when radio knots move between stationary components D and S1.
-
3.
Identification and location of D and S1 regions: analysis of available archival X-ray monitoring data and ejection epochs of two components, C5 and C8, revealed that the ejection of these components from D occurs during the dip in the X-ray emission. It is most likely that the component D is associated with the VLBI core of the jet (rather than the base of the jet) and the component S1 is a standing shock located at a distance of pc downstream from the component D.
-
4.
These results have important implications for the structure of the sub-parsec-scale nuclear region of the radio-loud galaxy 3C 390.3. We suggest that the relativistic plasma of the jet is a dominant source of variable optical continuum emission: the bulk of optical continuum optical emission on timescales from few months to years are likely to be generated by knots of high-energy electrons propagating in the innermost 0.4 pc region of the jet between stationary components D and S1. In this scenario, the timescale, amplitude and frequency of optical synchrotron flares depend on energetics, kinematics and rate of ejected radio knots. The beamed continuum emission from the jet ionizes a gas in a subrelativistic outflow along the jet, which results in a formation of two non-virialized outflowing BLRs along the jet and counterjet.
Acknowledgments
We acknowledge helpful discussions with N.G. Bochkarev, thank E. Valtaoja for valuable comments and discussions which significantly improved the paper, and A. Roy for useful discussions and careful reading of the draft of the paper. This work was supported by grants form INTAS (grant N96-0328), RFBR (grants N97-02-17625 N00-02-16272, N03-02-17123 and 06-02-16843), State program ’Astronomy’ (Russia), and CONACYT research grant 54480 (Mexico). JLT acknowledges support from the CONACyT program for PhD studies, the International Max-Planck Research School for Radio and Infrared Astronomy at the Universities of Bonn and Cologne and the Deutscher Akademischer Austausch Dienst for a short-term scholarship in Germany. This research has made use of data from the MOJAVE database that is maintained by the MOJAVE team (Lister et al. 2009). The National Radio Astronomy Observatory is a facility of the National Science Foundation operated under cooperative agreement by Associated Universities, Inc.
References
- Abramowicz et al. (1988) Abramowicz, M. A., Czerny, B., Lasota, J. P., & Szuszkiewicz, E. 1988, ApJ, 332, 646
- Alef et al. (1996) Alef W., Wu S.Y., Preuss E., Kellermann K.I., Qiu Y.H., 1996, A&A, 308, 376
- Alexander (1997) Alexander, T. 1997, Astronomical Time Series, 218, 163
- Agudo et al. (2001) Agudo I. et al., 2001, ApJ, 549, 183
- Arshakian & Belloni (2006) Arshakian T.G., Belloni T., 2006, VI Microquasar Workshop: Microquasars and Beyond, ed Belloni, T., PoS (MQW6), 29
- Boroson (2005) Boroson T., 2005, AJ, 130, 381
- Chiaberge et al. (1999) Chiaberge M., Capetti A., Celotti A., 1999, A&,A, 349, 77
- Chiaberge et al. (2002) Chiaberge M., Capetti A., Celotti A., 2002, A&A, 394, 791
- Daly et al. (1988) Daly R.A., Marscher A.P., 1988, ApJ, 334, 539
- D’Arcangelo et al. (2007) D’Arcangelo, F. D., et al. 2007, ApJL, 659, L107
- Eracleous & Halpern (2003) Eracleous M., Halpern J.P., 2003, ApJ, 599, 886
- Eracleous et al. (1997) Eracleous M., Halpern J.P., Gilbert A.M., Newman J.A., Filippenko A.V., 1997, ApJ, 490, 216
- Fabian (2004) Fabian A.C., 2004, astro-ph/0412224
- Ferrari (1998) Ferrari A., 1998, ARAA, 36, 539
- Gliozzi et al. (2006) Gliozzi M., Papadakis I.E., Räth C., 2006, A&A, 449, 969
- Gómez et al. (1995) Gómez J.L., Marti, J.M.A., Marscher A.P., Ibanez J.M.A., Marcaide J.M., 1995, ApJL, 449, L19
- Gómez et al. (1997) Gómez J.L., Marti J.M.A., Marscher A.P., Ibanez J.M.A., Alberdi A., 1997, ApJ, 482, L33
- Gómez et al. (2001) Gómez J.L., Marscher A.P., Alberdi A., Jorstad S.G., Agudo I., 2001, ApJ, 561, 161
- Haardt & Maraschi (1991) Haardt, F., & Maraschi, L. 1991, ApJL, 380, L51
- Haardt & Maraschi (1993) Haardt, F., & Maraschi, L. 1993, ApJ, 413, 507
- Hanski et al. (2002) Hanski, M. T., Takalo, L. O., & Valtaoja, E. 2002, A&A, 394, 17
- Hardcastle & Worrall (2000) Hardcastle M.J., Worrall D.M. 2000, MNRAS, 314, 359
- Jorstad et al. (2001) Jorstad S.G. et al., 2001, ApJS, 134, 181
- Kaspi et al. (2000) Kaspi S. et al., 2000, ApJ, 533, 631
- Kellermann & Pauliny-Toth (1969) Kellermann, K. I., & Pauliny-Toth, I. I. K. 1969, ApJL, 155, L71
- Kellermann et al. (2004) Kellermann K.I. et al., 2004, ApJ, 609, 539
- Königl (1981) Königl A., 1981, ApJ, 243, 700
- Lähteenmäki & Valtaoja (1999) Lähteenmäki A., Valtaoja E., 1999, ApJ, 521, 493
- Leighly et al. (1997) Leighly K.M. et al., 1997, ApJ, 483, 767
- León-Tavares et al. (2009) Leon-Tavares, J., Lobanov, A. P., Chavushyan, V. H., Arshakian, T. G., Doroshenko, V. T., Sergeev, S. G., Efimov, Y. S., & Nazarov, S. V. 2009, submitted to ApJ, arXiv:0910.1320
- Lister et al. (2009) Lister, M. L., et al. 2009, AJ, 137, 3718
- Lobanov (1998) Lobanov A.P., 1998, A&A, 330, 79
- Lu & Yu (2001) Lu, Y., & Yu, Q. 2001, MNRAS, 324, 653
- Manmoto et al. (1997) Manmoto, T., Mineshige, S., & Kusunose, M. 1997, ApJ, 489, 791
- Marscher et al. (2002) Marscher A.P. et al., 2002, Nature, 417, 625
- Marscher (2006) Marscher A.P., 2006, VI Microquasar Workshop: Microquasars and Beyond, ed Belloni, T., PoS (MQW6), 25
- Marscher et al. (2008) Marscher, A. P., et al. 2008, Nature, 452, 966
- Murray et al. (1997) Murray N., Chiang G., 1997, ApJ, 474, 91
- Mushotzky et al. (1993) Mushotzky R.F., Done C., Pounds K.A., 1993, ArAA, 31, 717
- Narayan & Yi (1994) Narayan, R., & Yi, I. 1994, ApJL, 428, L13
- Pearson (1997) Pearson T.J., 1997, in ASP Conf. Ser. 180, Synthesis imaging in radio astronomy II, eds. G. B. Taylor, C. R. Carilli, R. A. Perley, 335
- Peterson et al. (2002) Peterson B.M., 2002, Advanced Lectures on The Starburst-AGN Connection, eds Aretxaga I., Kunth D. & Mújica R., Singapore World Scientific, 3
- Ponti et al. (2004) Ponti G., Cappi M., Dadina M., Malaguti G., 2004, A&A, 417, 451
- Proga et al. (2000) Proga D., Stone J.M., Kallman, T.R., 2000, ApJ, 543, 686
- Readhead (1994) Readhead, A. C. S. 1994, ApJ, 426, 51
- Romanova & Lovelace (1996) Romanova M.M., Lovelace R.V.E., 1996, A&AS, 120, 583
- Sergeev et al. (2002) Sergeev S.G., Pronik V.I., Peterson B.M., Sergeeva E.A., Zheng W., 2002, ApJ, 576, 660
- Shakura & Sunyaev (1973) Shakura, N. I., & Sunyaev, R. A. 1973, A&A, 24, 337
- Shapovalova et al. (2001) Shapovalova I.A. et al., 2001, A&A, 376, 775
- Soldi et al. (2008) Soldi, S., et al. 2008, A&A, 486, 411
- Ulrich et al. (1997) Ulrich M., Maraschi L., Urry C.M. 1997, ARAA, 35, 445
- Urry & Padovani (1995) Urry C.M., Padovani P., 1995, PASP, 107, 803
- Valtaoja et al. (1992) Valtaoja, E., Terasranta, H., Urpo, S., Nesterov, N. S., Lainela, M., & Valtonen, M. 1992, A&A, 254, 71
- Wamsteker et al. (1997) Wamsteker W., Ting-gui W., Schartel N., Vio R., 1997, MNRAS, 288, 225
- Wandel et al. (1999) Wandel A., Peterson B.M., Malkan M.A., 1999, ApJ, 526, 579
- Worrall (2005) Worrall D.M., 2005, Multiband Approach to AGN, eds Lobanov, A.P. & Venturi, T. Memorie della Societa Astronomica Italiana, 76, 28
- Zheng (1996) Zheng W., 1996, AJ, 111, 1498
Appendix A Properties of the VLBA images and model fits of 3C 390.3
| Epoch | I | M | I | M | I | M | I | M | I | M |
| 1994.67 | 423.9 | 422.9 | 213.3 | 211.1 | 1.175 | 1.186 | 253.1 | 253.8 | ||
| 1995.96 | 463.1 | 466.2 | 190.8 | 190.8 | 0.328 | 0.334 | 119.2 | 120.3 | ||
| 1996.37 | 471.6 | 477.6 | 192.4 | 192.6 | 0.453 | 0.475 | 83.4 | 85.5 | ||
| 1996.82 | 389.5 | 399.1 | 174.2 | 174.2 | 1.235 | 1.504 | 42.5 | 45.2 | ||
| 1997.19 | 370.0 | 377.5 | 179.1 | 180.4 | 1.533 | 1.800 | 39.9 | 43.0 | ||
| 1997.66 | 418.3 | 425.2 | 267.4 | 267.2 | 0.575 | 0.580 | 152.1 | 152.5 | ||
| 1998.21 | 392.4 | 389.6 | 191.2 | 191.4 | 0.429 | 0.430 | 94.6 | 94.7 | ||
| 1999.85 | 313.2 | 315.8 | 216.9 | 218.6 | 1.103 | 1.149 | 31.0 | 31.4 | ||
| 2000.65 | 310.4 | 300.2 | 161.8 | 167.4 | 1.234 | 1.595 | 38.9 | 42.2 | ||
| 2001.17 | 270.6 | 280.1 | 209.4 | 207.6 | 1.250 | 1.578 | 32.2 | 35.4 | ||
| 2002.13 | 301.3 | 297.6 | 217.0 | 217.3 | 1.094 | 1.437 | 28.4 | 31.6 | ||
| 2003.02 | 268.1 | 254.3 | 211.0 | 212.5 | 1.275 | 1.929 | 35.0 | 41.2 | ||
| 2005.13 | 299.6 | 303.9 | 220.3 | 217.0 | 1.013 | 0.996 | 26.1 | 25.5 | ||
| 2006.11 | 344.8 | 337.9 | 295.9 | 287.3 | 1.074 | 1.446 | 91.6 | 54.7 | ||
| 2006.31 | 340.6 | 348.3 | 278.8 | 279.0 | 1.127 | 1.228 | 31.6 | 32.5 | ||
| 2006.54 | 390.4 | 391.2 | 306.5 | 305.3 | 1.049 | 1.092 | 33.3 | 33.7 | ||
| 2006.75 | 379.2 | 377.6 | 303.0 | 303.8 | 1.052 | 1.067 | 31.6 | 31.9 | ||
| 2007.01 | 405.1 | 409.8 | 350.5 | 350.3 | 1.109 | 1.109 | 118.9 | 118.8 | ||
| 2007.63 | 444.5 | 445.7 | 380.6 | 380.6 | 1.131 | 1.141 | 76.3 | 76.3 | ||
| 2008.41 | 468.6 | 462.6 | 394.3 | 394.4 | 1.189 | 1.213 | 68.7 | 68.5 | ||
| 2008.60 | 429.4 | 422.6 | 344.0 | 341.5 | 1.138 | 1.267 | 65.8 | 69.2 | ||
| 0.999 | 1.000 | 0.7242 | 0.906 | 0.999 | ||||||
Column designation: – total flux in the image (“I”) and in the respective Gaussian (“M”) component models, – peak flux density in the respective images and models, – minimum flux density in the respective images and models, – goodness-of-fit parameter of the respective images and models, – r.m.s visibility noise for the respective images and models.
Table 3 compares the CLEAN component models (denoted “I”) and Gaussian model fits (denoted “M”) for the VLBA data used in the paper. The columns are: – total flux density [mJy/beam]; – peak flux density [mJy/beam]; – minimum flux density [mJy/beam]; – goodness of the fit parameter; – root-mean-square between the observed and model visibilities [mJy]. Last row presents average ratios between the respective image and model fit properties. The ratios are close to unity for the total and peak flux densities. The parameter and the visibility r.m.s. are only slightly larger for the Gaussian model fits, which indicates that the model fits represent the structure adequately. The higher maximum negative flux density in the model fits (column ) indicates that that the SNR of the Gaussian fits is on average 1.5 times lower than that of the VLBI images (due to increased non-Gaussian shapes of low-brightness regions). This reduction does not affect the fitted values of the component parameters (albeit it does increase the parameter errors) as it is related to extended emission associated with the underlying flow.
Properties of individual emitting regions in the radio jet are determined by fitting Gaussian patterns to interferometric amplitudes and phase closures. Errors of the modelfits are estimated by varying the best fit parameters and determining 1- confidence limits from the resulting distribution. This method accounts for correlations between parameters of adjacent modelfit components and provides conservative error estimates. Fidelity of the component sizes and separations obtained from the modelfits is further examined by comparing them with resolution limits calculated from the SNR of the detections. The resolution limit, , can be estimated for a Gaussian modelfit component from
where is the signal-to-noise of component detection and , are the major and minor axis of the point-spread function derived from the interferometric coverage of the data. The limiting separation, , at which two Gaussian components with sizes can be fitted adequately to visibility data can be estimated from
where and are the minimum resolvable sizes for the two components. Table 4 lists the ratios between the measured sizes of and separations of the components D and S1 and their respective limiting values. For resolved components the ratios between the measured sizes and their respective are larger than unity. For the component separations, ratios large than unity imply that the components parameters can be reliably estimated from the modelfit.
The SNR of detection varies from 30 to 900 for S1 and from 100 to 860 for D and the corresponding resolution limits are smaller than 0.2 mas for both features. The ratios between measured and limiting sizes and separations of D and S1 indicate that only the size measurements made for the first data point for S1 and the last one for D are coming close to the resolution limits, while all other measurements are certainly above these limits, both for the component sizes and separations. The limiting ratios and separations can be used to estimate the probability of the component flux to be correlated:
This formula gives for two identical Gaussian features separated by . The correlation probabilities (listed in the last column of Table 4) are smaller than 6 % for all of the model fits, implying that the flux densities of the component D and S1 estimated from these modelfits are uncorrelated.
| SNR | ||||||
|---|---|---|---|---|---|---|
| Epoch | D | S1 | D | S1 | D–S1 | |
| 1994.67 | 433.3 | 32.0 | 3.13 | 0.99 | 3.8 | 0.0540 |
| 1995.96 | 454.3 | 303.9 | 1.90 | 1.64 | 17.6 | 0.0094 |
| 1996.37 | 388.8 | 116.4 | 1.51 | 1.79 | 9.1 | 0.0182 |
| 1996.82 | 481.6 | 66.3 | 2.71 | 2.32 | 5.3 | 0.0608 |
| 1997.19 | 861.8 | 130.8 | 3.16 | 1.67 | 11.0 | 0.0156 |
| 1997.66 | 475.2 | 140.2 | 1.53 | 1.76 | 11.3 | 0.0115 |
| 1998.21 | 535.1 | 407.3 | 2.62 | 2.88 | 13.5 | 0.0401 |
| 1999.85 | 568.4 | 266.0 | 2.81 | 1.31 | 13.4 | 0.0205 |
| 2000.65 | 115.9 | 70.4 | 1.08 | 1.58 | 6.1 | 0.0431 |
| 2001.17 | 508.5 | 239.4 | 1.06 | 1.41 | 9.7 | 0.0127 |
| 2003.02 | 632.4 | 356.2 | 1.21 | 1.15 | 6.6 | 0.0272 |
| 2005.13 | 406.2 | 38.4 | 2.42 | 0.99 | 3.8 | 0.0428 |
| 2006.11 | 499.7 | 90.8 | 1.24 | 1.19 | 10.6 | 0.0046 |
| 2006.31 | 455.4 | 116.2 | 1.29 | 1.65 | 9.3 | 0.0122 |
| 2006.54 | 681.9 | 265.7 | 1.71 | 1.91 | 9.4 | 0.0249 |
| 2006.75 | 573.2 | 174.6 | 1.21 | 1.54 | 11.0 | 0.0088 |
| 2007.01 | 688.3 | 128.4 | 1.62 | 1.34 | 9.0 | 0.0097 |
| 2007.63 | 1069.1 | 351.5 | 1.28 | 1.24 | 13.3 | 0.0053 |
| 2008.41 | 1599.0 | 423.5 | 1.89 | 1.02 | 10.7 | 0.0099 |
| 2008.60 | 1633.3 | 266.2 | 2.39 | 1.39 | 7.0 | 0.0245 |
Column designation: SNR – signal-to-noise of component detection, – component ratio of the measured and minimum resolvable sizes, – ratio of the measured distances the minimum resolvable separations between the components D and S1, – probability of the measured flux densities of D and S1 being correlated.