Following the 2008 outburst decay of the black hole candidate H 1743-322 in X–ray and radio
Abstract
In this Paper we report on radio (VLA and ATCA) and X–ray (RXTE, Chandra and Swift) observations of the outburst decay of the transient black hole candidate H 1743-322 in early 2008. We find that the X–ray light curve followed an exponential decay, levelling off towards its quiescent level. The exponential decay timescale is 4 days and the quiescent flux corresponds to a luminosity of 3erg s-1. This together with the relation between quiescent X–ray luminosity and orbital period reported in the literature suggests that H 1743-322 has an orbital period longer than 10 hours. Both the radio and X–ray light curve show evidence for flares. The radio – X–ray correlation can be well described by a power–law with index 0.18. This is much lower than the index of 0.6–0.7 found for the decay of several black hole transients before. The radio spectral index measured during one of the radio flares while the source is in the low–hard state, is -0.50.15, which indicates that the radio emission is optically thin. This is unlike what has been found before in black hole sources in the low–hard state. We attribute the radio flares and the low index for the radio – X–ray correlation to the presence of shocks downstream the jet flow, triggered by ejection events earlier in the outburst. We find no evidence for a change in X–ray power law spectral index during the decay, although the relatively high extinction of limits the detected number of soft photons and thus the accuracy of the spectral fits.
keywords:
stars: individual (H 1743-322) — accretion: accretion discs — stars: binaries — X-rays: binaries1 Introduction
A wide variety of astrophysical objects are thought to be powered by accretion. In the case of accretion onto a black hole, the properties of these flows mainly depend on the mass and spin of the black hole and on the mass accretion rate (). Variations in are probably responsible for the spectral and variability states of black hole X-ray binaries (BHXBs; McClintock & Remillard 2006).
Transient BHXBs spend long periods at very low X-ray luminosities, referred to as ‘quiescence’, but during occasional outbursts the luminosity increases by as much as 7 to 8 orders of magnitude, typically reaching values of tens of per cent of the Eddington luminosity (). Maccarone (2003) has shown that below around a few percent of BHXBs typically return to the so–called hard state, in which the spectrum is dominated by a power law component with an index 1.5 (e.g. Kalemci et al. 2005). BHXBs are still in that state when they have decayed down to .
With Chandra and XMM-Newton it is possible to explore the spectral properties of BHXBs all the way to quiescence, for which log() is typically 30.5–33.0 (e.g. Kong et al. 2002; Hameury et al. 2003). This range corresponds to 39 for a 8.5 black hole (which is the average black-hole mass from McClintock & Remillard 2006). About 15 BHXBs have been observed in quiescence with Chandra and XMM-Newton, but only in a handful of cases could the spectral properties be well constrained. Nevertheless, these few cases suggest an interesting property of quiescent spectra: when fitted with a power-law the indices tend to be considerably softer than the index of found in the hard state (e.g. Corbel et al. 2006). Although the errors for individual sources are still large, the overall trend seems to indicate that, at least spectrally, the quiescent state is different from the hard state that is observed three to five decades higher in .
Corbel et al. (2003) and Gallo et al. (2003) have demonstrated the existence of a relation between observed X-ray and radio emission from hard state black holes, of the form ; this relation is nearly the same for V404 Cyg and GX 339–4. However, Xue & Cui (2007), Cadolle Bel et al. (2007), Rodriguez et al. (2007), Shaposhnikov et al. (2007) and Corbel et al. (2008) found that the relation might not be as universal as previously thought (see the compilation in Gallo 2007). On the other hand Homan et al. (2005) and Russell et al. (2006) found further relations between the X–ray and near–infrared fluxes in black hole transients: . Both relations extend over more than three decades in luminosity down to and suggest that the X–ray, near–infrared and radio emission in the hard state are intimately connected. Correlations between optical and X–ray light in the black hole source GX 339–4 point in the same direction (Gandhi et al. 2008). Chandra and VLA observations of A 0620–00 in quiescence by Gallo et al. (2006) showed that the radio and X–ray flux lie on the extension of the correlation, suggesting that it holds all the way down to quiescence. Some models predict that the relation should break down (i.e. significantly steepen) around (Yuan & Cui 2005). The result of Gallo et al. (2006) seems to rule this out, but given the contradicting results on the decay rate and normalisation of the radio – X–ray correlations, this needs to be investigated further.
ADAF and jet–models both predict that the X–ray luminosity scales as below (Narayan et al. 1997; Fender et al. 2003). Observational evidence for this scaling was deduced from X-ray/radio correlations (Markoff et al. 2003; Körding et al. 2006). In ADAF models a gradual softening of the power–law photon index is expected until an index of 2.2 in quiescence (Esin et al. 1997; Narayan et al. 1997). However, in ADAF models the disk should recede in the hard state, something that is recently debated by Miller et al. (2006a, b) (but see Gierliński et al. 2008; Hiemstra et al. 2009).
H 1743-322 was discovered in August, 1977 by the Ariel–5 all–sky monitor. The position was more accurately determined by HEAO–I ruling out an association with 4U 1755–388 (Kaluzienski & Holt 1977a; Kaluzienski & Holt 1977b). The source has shown repeated outbursts since 2003 after being rediscovered by the International Gamma–ray Astrophysics Laboratory (INTEGRAL; IGR J17464-3213 Revnivtsev et al. 2003). Markwardt & Swank (2003) suggested that the INTEGRAL–found source is the same as H 1743-322. Recently, the source showed several outbursts; one in 2007/2008 (the data presented in this paper is from this outburst; Kalemci et al. 2008a), one in late 2008 (Prat et al. 2009) and one in 2009 (Krimm et al. 2009).
McClintock & Remillard (2006) list H 1743-322 as a strong black hole candidate. Phase resolved optical or near–infrared observations to determine the mass function of the black hole have not yet been reported, even though the source was found in outburst in near–infrared and optical bands (Baba et al. 2003; Steeghs et al. 2003). Near–infrared observations of the source in quiescence show an unrelated star within 1′′ and found the counterpart –band magnitude to be 17.1 (McClintock et al. 2009). H 1743-322 is one of the few sources where X–ray jets have been imaged (Corbel et al. 2005). The other sources where an X–ray jet has been found are the black hole sources 4U 1755–33 and XTE J1550–564 (Angelini & White 2003; Corbel et al. 2002), the neutron star source Cir X–1 (Heinz et al. 2007; Soleri et al. 2009) and the peculiar source SS 433 (Migliari et al. 2002). In addition to X–ray jet outflows Miller et al. (2006c) found a strongly variable disc wind from H 1743-322. The distance to this source is so far not well constrained, however, Corbel et al. (2005) find from the fact that the jet speed is limited to maximally the speed of light and the observed X–ray jet proper motion that the upper limit to the distance is 10.42.9 kpc, consistent with the often assumed Galactic Center distance of 7.5 or 8 kpc. This assumption is based on the Galactic coordinates of the source (357.255 and -1.83); it lies towards the Galactic bulge. In this paper we assume a distance of 7.5 kpc.
Here, we report on contemporary RXTE, Swift and Chandra X–ray and Very Large Array (VLA) radio observations of H 1743-322 aimed at following the X–ray and radio light curves and establishing the X–ray – radio correlation while the source decays to quiescence. The observations have been obtained in the last stages of the outburst ending early 2008. For this outburst Kalemci et al. (2008b) reported that the source returned to the low–hard state between Jan, 24, 2008 and Feb., 1, 2008. To determine the quiescent spectral properties we further analysed three Chandra observations of H 1743-322 obtained when it was in quiescence (Corbel et al. 2006).
2 Observations, analysis and results
2.1 Chandra X–ray observations
We observed H 1743-322 with the Chandra satellite using the back–illuminated S3 CCD–chip of the Advanced CCD Imaging Spectrometer (ACIS) detector (Garmire 1997) on several occasions during the final parts of the decay to quiescence. During the first two observations in 2008 (Obs IDs 8985 and 8986) we employed the High Energy Transmission Grating (HETG) to mitigate effects of photon pile–up. In the subsequent observations we windowed the ACIS–S CCD, providing a frame time of 0.4104 s. We have reprocessed and analysed the data using the CIAO 4.0.2 software developed by the Chandra X–ray Center. In our analysis we have selected events only if their energy falls in the 0.3–7 keV range. All data has been used, as background flaring is very weak or absent in all data.
| Obs ID | Observing | MJD | Time on | Count rate |
|---|---|---|---|---|
| date | (UTC) | source (ks) | 0.3-7 keV (cnt s-1) | |
| 4565a | 2004 Feb. 13 | 53047.84959 | 23.0 | |
| 4566a | 2004 Mar. 25 | 53088.74413 | 28.4 | |
| 4567a | 2004 Mar. 27 | 53091.25914 | 40.0 | |
| 8985b,d | 2008 Feb. 19 | 54515.14003 | 6.4 | c |
| 8986b,d | 2008 Feb. 25 | 54521.04074 | 7.6 | c |
| 8987d | 2008 Mar. 02 | 54527.13111 | 6.5 | 0.1010.004 |
| 8988d | 2008 Mar. 08 | 54533.69200 | 13.7 | |
| 8989d | 2008 Mar. 16 | 54541.23027 | 20.5 | |
| 9833 | 2008 Mar. 17 | 54542.08033 | 11.0 | |
| 9838d | 2008 Mar. 21 | 54546.42945 | 23.8 | |
| 8990 | 2008 Mar. 22 | 54547.32918 | 21.2 | |
| 9839 | 2008 Mar. 23 | 54548.30002 | 28.7 | |
| 9837 | 2008 Mar. 24 | 54549.22579 | 20.6 |
Using wavdetect we detect H 1743-322 in each of the observations. We have selected a circular region of 10 pixel (5′′) radius centered on the accurately known source position (Steeghs et al. 2003) to extract the source counts. Similarly, we have used a circular annulus with inner and outer radius of 20 and 40 pixels centered on the source position to extract background counts. The source and background region for observation 4566 and 4567 excludes the X–ray jets found by Corbel et al. (2005). We have made redistribution and auxilliary response matrices for the source region of each of the observations separately.
The net, background subtracted, source count rate for each observation is given in Table 1. Using xspec version 11.3.2p (Arnaud 1996) we have fitted the spectra of H 1743-322 using statistics requiring at least 10 counts per spectral bin for the observations with IDs 8985, 8986, 8987, and 8988 and Cash statistics (Cash 1979) modified to account for the subtraction of background counts, the so called W–statistics111see http://heasarc.gsfc.nasa.gov/docs/xanadu/xspec/manual/ for the other observations. We have used an absorbed power–law model (pegpwrlw in xspec) to describe the data. For the observations with IDs 8985, 8986, 8987, and 8988 we allow all three parameters (neutral hydrogen column density , the power–law index and normalisation) to float freely. Due to the relatively low number of counts we fix the interstellar extinction during the fits to the rest of the observations to 2.3 cm-2, consistent with the found by Miller et al. (2006c) and for the observations with IDs 8985, 8986, 8987, and 8988. The power law index and normalisation were allowed to float.
We list the results of our spectral analysis in Table 2. Given the similar fluxes and contemporaneous observations we have also analysed the spectral behaviour of H 1743-322 for the observations 9838, 8990, 9839, 9837 together. Furthermore, in order to determine the best–fitting power law index for the source in quiescence we have fitted the spectral model to observations 4565, 4566, 4567, 9838, 8990, 9839, 9837 together (see Table 2).
| Obs ID | N | PL flux (0.3-7 keV Chandra) | PL index | Unabs. 0.5–10 keV flux | Goodness / |
|---|---|---|---|---|---|
| cm-2 | (0.5-10 keV Swift) erg-1 cm-2 s-1 | (erg cm-2 s-1) | per cent / d.o.f. | ||
| 8985d | 1.80.4 | 11.81.0 | 0.870.18 | 1.12/89 | |
| 8986d | 1.70.6 | 6.31.0 | 1.030.27 | 0.81/55 | |
| 8987 | 2.20.3 | 2.80.5 | 1.680.21 | 0.86/56 | |
| 8988 | 2.20.7 | 0.55 | 1.750.47 | 0.7/20 | |
| 8989 | 2.3a | 2.000.25 | 52% | ||
| 9833 | 2.3a | 1.70.5 | 54% | ||
| 9838 | 2.3a | 1.80.4 | 58% | ||
| 8990 | 2.3a | 2.10.4 | 76% | ||
| 9839 | 2.3a | 1.30.4 | 42% | ||
| 9837 | 2.3a | 2.50.4 | 30% | ||
| 4565 | 2.3a | 1.80.4 | 65% | ||
| 4566 | 2.3a | 1.80.6 | 71% | ||
| 4567 | 2.3a | 1.80.3 | 95% | ||
| Combb | 2.3a | 85% | |||
| Combc | 2.3a | 57% | |||
| 00031121001 | 2.3a | 2936 | 1.740.05 | 0.97/270 | |
| 00031121002 | 2.3a | 1063 | 1.590.08 | 1.01/166 | |
| 00031121003 | 2.3a | 453 | 1.70.08 | 0.67/91 | |
| 00031121004 | 2.3a | 241 | 1.60.1 | 0.95/73 | |
| 00031121005 | 2.3a | 101 | 1.90.2 | 0.63/19 | |
| 00031121001 | 1.850.13 | 26010 | 1.510.08 | 0.94/269 | |
| 00031121002 | 1.260.17 | 903 | 1.090.12 | 0.88/165 | |
| 00031121003 | 2.410.28 | 465 | 1.770.15 | 0.68/90 | |
| 00031121004 | 2.060.35 | 232 | 1.470.18 | 0.95/72 | |
| 00031121005 | 1.70.7 | 92 | 1.60.4 | 0.63/18 |
a has been fixed to 2.3 cm-2.
b Fit to Obs ID 4565, 4566, 4567, 9838, 8990, 9839, 9837 combined.
c Fit to Obs ID 9838, 8990, 9839, 9837 combined.
d Fit parameters affected by pile–up.
2.2 Swift X–ray observations
The Swift satellite observed the field of H 1743-322 during the decay of its 2008 outburst. We here report on results obtained using the X–ray telescope (XRT). A log of the observations is presented in Table 3. The ftools software package tool xselect has been used to extract source and background photons from regions centered on the known source position or a source free region on the CCD, respectively. Square boxes were used as extraction regions in the first two observations (Obs IDs 00031121001 and 00031121002) that were obtained in windowed timing mode. In that mode ten rows are read–out compressed into one, and the central 200 columns of the CCD are read. Hence, there is only one-dimensional spatial information allowing for faster CCD read–out and reducing effects of photon pile–up. The square boxes have a size of 40 pixels () along the one available spatial dimension. Events were selected if their event–grade is 0–2222http://swift.gsfc.nasa.gov/docs/swift/analysis/xrt_swguide_v1_2.pdf. For the four remaining observations two–dimensional information is available as the CCD is read–out in frame–transfer mode. These observations are in what is called photon–counting mode. Circular extraction regions that have a radius of 50 arcseconds were used. Events were selected if their event–grade is 0–4.
We have determined spectral parameters in the same way as we did for the Chandra observations restricting the fits to photon energies in the range from 0.5–10 keV. We have used two approaches. In the first we keep the neutral hydrogen column density fixed to 2.3 cm-2. All the spectral fits to the Swift data were done using a minimisation technique with 10 or more counts per spectral bin, except the spectral fits to the last observation (Obs. ID 00031121006). There, we employed the Cash statistics for estimating the best–fitting parameters, however, due to the low number of counts we could not extract meaningful spectral parameters. In the second approach we leave the neutral hydrogen column density free. The results of the spectral fits using both approaches are presented in Table 2.
| Obs ID | Observing | MJD | Time on |
|---|---|---|---|
| date | (UTC) | source (ks) | |
| 00031121001a | 2008 Feb. 12 | 54508.06499 | 1.74 |
| 00031121002a | 2008 Feb. 15 | 54511.61268 | 2.26 |
| 00031121003b,c | 2008 Feb .19 | 54515.02349 | 3.35 |
| 00031121004b | 2008 Feb. 22 | 54518.16801 | 4.62 |
| 00031121005b,c | 2008 Feb. 26 | 54522.05481 | 3.38 |
| 00031121006b | 2008 Mar. 04 | 54529.55583 | 3.53 |
a Windowed timing observing mode.
b Photon counting observing mode.
c Data point used in Figure 3.
2.3 RXTE X–ray observations
In addition to the Swift and Chandra observations we have used several archival RXTE observations in order to follow the flux evolution of the source after the source entered the low–hard state on the way to quiescence. We do not provide a full description of the source spectrum or power spectral properties since those have been described in depth for the 2003 outburst in McClintock et al. (2009) and, for this outburst, in Kalemci et al. (2008b). Instead, we use a simple power–law model to describe the X–ray spectrum in order to derive unabsorbed fluxes in the 0.5–10 keV band.
To this end we have extracted spectra from the RXTE’s Proportional Counter Array data using ftools version 6.6.2. We use only data from the Proportional Counter Unit 2 since that was always operational for these observations. We used the background model appropriate for bright sources and corrected the spectra for dead–time, even though the source count rate is such that dead–time effects are small. We added a systematic error of 0.6 per cent to the count rate in each spectral bin. Finally, we grouped the spectra such that there are at least 10 counts per spectral bin. We estimate the error on the unabsorbed flux that we thus determined to be 10 per cent.
| Obs ID | Observing | Start time | Flux (0.5-10 keV) |
|---|---|---|---|
| date | MJD (UTC) | erg cm-2 s-1 | |
| 93427-01-03-03 | 2008 Jan. 29 | 54494.19092 | 1.5E-08 |
| 93427-01-03-04 | 2008 Jan. 31 | 54496.74373 | 6.1E-09 |
| 93427-01-04-01 | 2008 Feb. 1 | 54497.85618 | 3.6E-09 |
| 93427-01-04-00a | 2008 Feb. 2 | 54498.83744 | 8.2E-09 |
| 93427-01-04-02a | 2008 Feb. 4 | 54500.80062 | 3.8E-09 |
| 93427-01-04-03a | 2008 Feb. 6 | 54502.82833 | 1.0E-09 |
| 93427-01-05-00a | 2008 Feb. 8 | 54504.92185 | 9.0E-10 |
a Data point used in Figure 3.
2.4 Results: X–ray decay
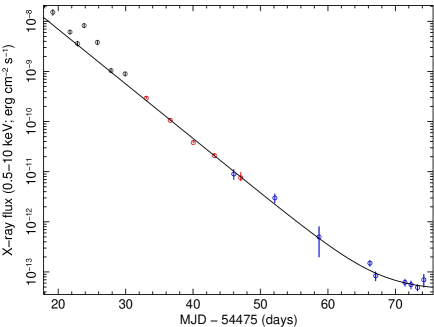
In Figure 1 we have plotted the X–ray decay light curve together with a best–fitting exponential towards the baseline quiescent flux. The best–fitting parameters are an exponential decay timescale of 4 days and a constant of 4.3erg cm-2 s-1. As can be seen from the figure the fit only globally describes the observations with the being very large (728 for 12 degrees of freedom). Obviously, the X–ray decay light curve is subject to additional variations beyond that described by the model (flares and other variability etc). During some of the Swift observations we find strong evidence for such variability. In contrast, during the Chandra observations there is no evidence for such variability. Note that we have not used the RXTE observations in the fit and we have used the Swift and Chandra flux values determined fixing the to 2.3 cm-1 in the figure.
There is a difference in the spectral parameters obtained from the spectral fits to the Chandra observations 8985 and 8986 and the contemporaneous Swift observations 00031121003 and 00031121005. We attribute this to effects of pile–up in the Chandra observations. The very flat power law and the somewhat low are signs of pile–up effects. Furthermore, at the observed count rates pile–up is indeed expected. The parameters for the spectral fits to the second Swift observation suggest a low and a very flat power law index as well. However, the observed count rate of 1 count per second is well below the threshold of a few hundred counts per second above which the XRT in windowed timing mode should be suffering from pile–up (Mineo et al. 2006). Close investigation of the spectrum reveals two potential reasons for the low and the flat power law index. First, there is emission at low energies that is not present in subsequent observations that are obtained in photon counting mode. It is unclear whether this emission is real (cf. Miller et al. 2006b) or due to calibration uncertainties of the windowed timing mode. Nevertheless, even when discarding all data below 1 keV the best–fitting power law still has a low index and the is low. Second, there seems to be excess emission around 6.5 keV that can be well described by broad line emission, however, we lack the signal–to–noise to investigate the properties of this line in detail. Given that such (relativistically smeared) emission lines are found in several black hole candidate sources (cf. Miller et al. 2006b) we attribute the discordant spectral parameters found when the spectrum is fit with an absorbed power law only, to unresolved line emission affecting the fit.
2.5 VLA radio observations and radio decay
H1743-322 was observed with the Very Large Array (VLA) under project codes S9208 and AR642. The VLA was in its CnB and C configurations (for the last two observations) implying a fairly large beam size (1.5′′). Observations were carried out in standard continuum mode with a 50 MHz bandwidth in each of two intermediate frequency (IF) pairs. A maximum of 14 retrofitted EVLA antennas were included in the array. The primary calibrator was 3C 286, which was used to set the flux scale according to the coefficients derived at the VLA by NRAO staff in 1999 as implemented in the 31Dec09 version of AIPS. The secondary calibrator was J17443116 (1 degree from the target source). Observations were carried out in fast switching mode to reduce target–calibrator slew time, using a 3.3 s integration time. Data calibration and imaging were carried out using standard procedures within AIPS. The source flux density was measured by fitting an elliptical Gaussian to the source in the image plane using the AIPS task JMFIT.
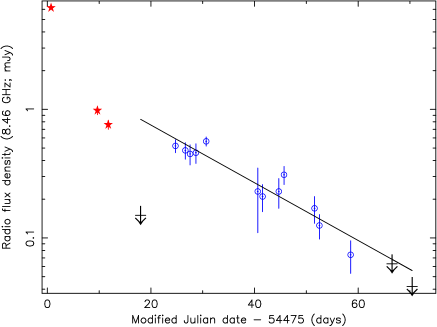
For a journal of the observations see Table 5. In Figure 2 we plot the observed radio 8.46 GHz decay light curve. Besides the VLA observations we use one observation obtained with the Austrialian Telescope Compact Array (ATCA) on Jan. 28, 2008 (MJD 54493) at 8.64 GHz. During this observation the source was not detected down to a 3 rms upper limit of 0.15 mJy (Kalemci et al. 2008b; at 8.64 GHz). This stringent ATCA upper limit shows that the radio emission reactivated close in time to the transition to the low–hard state.
The solid line in Figure 2 is the best–fitting exponential decay to the blue open circles, i.e. the VLA 8.46 GHz detections when the source was in the low–hard state. The exponential decay timescale is 192 days. The last radio observation yields a stringent upper limit of 0.04 mJy, which is below the extrapolation of the best–fitting exponential. This might indicate that the radio decay accelerated. The increase in source flux on Feb. 24, 2008 (MJD 54520) compared with the preceding observations on Feb. 20 and 23, 2008 (MJD 54516, 54519) is atypical since the X–ray flux decayed by a factor of 15 in the same period. Such behaviour could have been caused by a radio flare. Note that the radio flare was apparently not accompanied by an X–ray flare. Alternatively, the X–ray flare has been missed as the radio observation on Feb. 24, 2008 occurred 1.3 days before a Chandra observation and 2.5 days after the Swift observation nearest in time.
| Calender | Frequency | On source time | Flux density | Time between start X-ray | |
| date | MJD (days) | GHz | (minutes) | (mJy/beam) | and radio obs. (days) |
| 2008 Jan. 21 | 54486.740 | 1.4 | 3.4 | 2.40.26 | XXX |
| 2008 Feb. 20 | 54516.544 | 1.4 | 19 | 0.6b | XXX |
| 2008 Feb. 23 | 54519.680 | 1.4 | 18 | 0.6b | XXX |
| 2008 Mar. 01 | 54526.579 | 1.4 | 18 | 0.5b | XXX |
| 2008 Jan. 19 | 54484.663 | 4.86 | 3.4 | 1.540.09 | XXX |
| 2008 Jan. 21 | 54486.748 | 4.86 | 6 | 1.100.07 | XXX |
| 2008 Feb. 03 | 54499.737 | 4.86 | 17 | 0.630.09 | XXX |
| 2008 Feb. 06 | 54502.551 | 4.86 | 2.4 | 0.540.12 | XXX |
| 2008 Feb. 07 | 54503.673 | 4.86 | 3.4 | 0.590.14 | XXX |
| 2008 Feb. 09 | 54505.668 | 4.86 | 93 | 0.520.06 | XXX |
| 2008 Jan. 10 | 54475.719 | 8.46 | 13 | 6.160.05 | N.A. |
| 2008 Jan. 19 | 54484.669 | 8.46 | 6 | 0.980.07 | N.A. |
| 2008 Jan. 21 | 54486.760 | 8.46 | 10 | 0.760.06 | N.A. |
| 2008 Feb. 03 | 54499.742 | 8.46 | 12 | 0.520.06 | 0.9 RXTE |
| 2008 Feb. 05 | 54501.643 | 8.46 | 6 | 0.480.07 | 0.8 RXTE |
| 2008 Feb. 06 | 54502.557 | 8.46 | 6 | 0.450.08 | 0.3 RXTE |
| 2008 Feb. 07 | 54503.679 | 8.46 | 6 | 0.460.08 | 0.8 RXTE |
| 2008 Feb. 09 | 54505.674 | 8.46 | 17 | 0.560.05 | 0.8 RXTE |
| 2008 Feb. 19 | 54515.625 | 8.46 | 17 | 0.230.12 | 0.6 Swift |
| 2008 Feb. 20 | 54516.552 | 8.46 | 18 | 0.210.05 | 1.5 Chandra |
| 2008 Feb. 23 | 54519.689 | 8.46 | 18 | 0.230.06 | 1.3 Chandra |
| 2008 Feb. 24 | 54520.694 | 8.46 | 16 | 0.310.05 | 1.3 Swift |
| 2008 Mar. 01 | 54526.587 | 8.46 | 18 | 0.170.04 | 0.4 Chandra |
| 2008 Mar. 02 | 54527.529 | 8.46 | 51 | 0.130.03 | 0.4 Chandra |
| 2008 Mar. 08 | 54533.556 | 8.46 | 93 | 0.070.02 | 0.1 Chandra |
| 2008 Mar. 16 | 54541.550 | 8.46 | 124 | 0.06b | 0.3 Chandra |
| 2008 Mar. 20 | 54545.432 | 8.46 | 355 | 0.04b | 1.0 Chandra |
| 2008 Jan. 10 | 54475.720 | 22.46 | 7.5 | 3.010.21 | XXX |
a VLA 8.46 GHz observation reported in Rupen et al. (2008).
b Three rms limit.
2.6 Radio spectral index
On several nights near–simultaneous radio data has been obtained at different frequencies. We use this data to assess the radio spectral index. Initially, the spectral index is negative, implying optically thin radio emission. E.g. the 1.4, 4.86 to 8.46 GHz spectral index on MJD 54486 is -0.640.07.
After the transition to the low–hard state the spectral index is consistent with being 0. To obtain a more accurate measurement of the radio spectral index, we have averaged three short 4.86 GHz and 5 8.46 GHz observations close in time (in the range MJD 54499–54505) where the radio flux was consistent with being constant. The 4.86–8.46 GHz radio spectral index for these averages is 0.030.18. This is consistent with optically thick emission as has been observed in low–hard radio spectra.
However, the radio spectral index does not stay close to 0 during the decay to quiescence. We have averaged the 1.4 GHz and 8.46 GHz data in the MJD range 54516–54526. This data coincides with the radio flare observable at 8.46 GHz. Combining the three 1.4 GHz observations does provide a detection at 0.4310.097 mJy. At 8.46 GHz the average flux is 0.1750.028 mJy. The 1.4–8.46 GHz radio spectral index is -0.500.15. This implies optically thin radio emission late in the low–hard state.
2.7 Radio – X–ray correlation
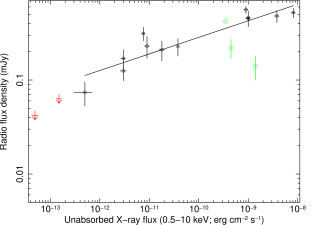
In Figure 3 we plot the observed correlation between the X–ray and 8.46 GHz radio fluxes for H 1743-322 using the X–ray observations closest in time to the radio observations (see footnotes to the journals of the X–ray observations and Table 5). The best–fitting power law with index 0.180.01 (1 ) is overplotted. The index is less steep than the index of 0.7 as found for several sources before (SGallo et al. 2003; Corbel et al. 2003).
There are several effects that could distort the picture. First, the radio and X–ray data are not strictly simultaneous (see Table 5). There is typically less than 1 day between the start of the radio and X–ray observations, however, in one case the difference in start times is as much as 1.5 days. This together with the flares apparent in the radio light curve as well as in the RXTE and Swift X–ray observations could result in a higher flux in either radio or X–ray which might confuse the apparent correlation. Short duration radio flares have been found in e.g. V404 Cyg (Miller-Jones et al. 2008). Last, since the spatial resolution of our VLA observations is several arcseconds, the observed radio flux might include emission from a ballistic jet–ejection event earlier in the outburst. Although the ATCA non–detection shows that the initial radio emission probably related to jet–ejection events occurring before the transition to the low–hard state faded away, shocks further down the flow can lead to rebrightenings in radio (and X–ray) at a later stage. The fact that the radio spectral index during the epoch related to the radio flare at MJD 54520 is showing that the radio emission is optically thin strongly argues in favour of this scenario.
Given the low spatial resolution of our radio observations this emission can significantly contribute to the radio flux density during the subsequent measurements. XTE J1550–564 dramatically demonstrates this, with radio (and X–ray) emission from the state transition ejecta still brightening years after the outburst (Corbel et al. 2002). The part of the radio decay of H 1743-322 that our observations sample with detections lasts about 33 days. In the most extreme case of a jet/flow speed of c, in 33 days a distance of 0.028 pc can be travelled. At a source distance of 7.5 kpc this corresponds to 078 for a jet in the plane of the sky. Such an angular extent would still be unresolved by the VLA in the CnB and certainly C configuration. This indicates that similar to the case of XTE J1550–564, shocks in the jet flow could indeed be responsible for the enhanced radio emission. Since such an angular extend could potentially be detected by Chandra we averaged the four Chandra observations obtained after March 20, 2008. We registered the four observations to a common astrometric frame using the position of the brightest X–ray source (besides H 1743-322) detected in the observations. After merging the registered frames, we determined the position of the X–ray source associated with H 1743-322 in the same way as described above. We find that the position of H 1743-322 in the average of the last 4 observations in 2008 is consistent with the best known radio position found by Rupen et al. (2004), therefore, the shocked radio emission is either not responsible for X–ray emission or it has travelled significantly less than the 078 calculated above.
In order for radio emission from shocks downstream to be the cause of the flattening of the index of the radio – X–ray correlation, the radio emission should not be accompanied by a similar amount of X–ray emission as during the processes responsible for the index of 0.7 during the normal low–hard state decay.
In order to compare the normalisation of this correlation with that found in other sources we need to know the distance of H 1743-322 (see Jonker et al. 2004). As mentioned in the introduction we use a distance of 7.5 kpc for H 1743-322. Comparing the normalisation of the radio – X–ray correlation for a distance of 7.5 kpc with that of other sources we find that H 1743-322 lies above the area traced out by GX 339–4 and V 404 Cyg (Gallo et al. 2003). Even lowering the distance by a factor 2 one still finds the source above GX 339–4 and V 404 Cyg. Finally, our fluxes and luminosities are given in the 0.5-10 keV band whereas the correlation was plotted in the 2–11 keV band by Gallo et al. (2003). The influence of the different energy bands on the slope of the radio – X–ray correlation is minimal since the X–ray spectrum does not change significantly during the decay. The normalisation is influenced by the difference in energy bands, though. For comparison we also computed the 2–11 keV X–ray fluxes of our X–ray observations and we find that the 2–11 keV values are 805 per cent of the values at 0.5–10 keV. Thus, our 0.5–10 keV luminosities are slightly higher than the 2–11 keV luminosities bringing H 1743-322 artificially closer to the area traced by GX 339–4 and V 404 Cyg. The difference in normalisation would be larger if we had used the exact same energy range.
3 Discussion
Using Chandra, Swift and RXTE X–ray observations with (near–)simultaneous radio VLA observations we have observed the decay towards quiescence of the black hole candidate X–ray binary H 1743-322 while the source was in the low–hard state. The overall shape of the X–ray decay light curve can be described with an exponential with an e–folding timescale of 4 days that levels off towards quiescence. X–ray flares are superposed on the exponential decay light curve. During several of the Swift observations flares were observed as well. The unabsorbed 0.5–10 keV quiescent flux is 4.3erg cm-2 s-1. For an assumed source distance of 7.5 kpc this implies a quiescent 0.5-10 keV X–ray luminosity of erg s-1. The source luminosity in quiescence after the outburst ending early 2008 is consistent with being the same as that after the 2004 outburst (Corbel et al. 2005).
The quiescent X–ray luminosity of erg s-1 of H 1743-322 implies an orbital period longward of 10 hours assuming H 1743-322 follows the general trend between orbital period and quiescent X–ray luminosity reported in Garcia et al. (2001). Such an orbital period suggests that the mass donor star in H 1743-322 has evolved off the main sequence. Alternatively, the mass of the black hole in H 1743-322 could be substantially larger than that in the sources defining the relation between orbital period and quiescent X–ray luminosity.
The low–hard state radio light curve shows evidence for radio flares superposed on an exponential decay with an e–folding timescale of days. When plotted against the X–ray light curve the radio – X–ray correlation index is lower () than found before (; Corbel et al. 2003; Gallo et al. 2003). The radio flares could be responsible for extended jet emission that due to the relatively large VLA beamsize in our observations using C and CnB configurations was not resolved. The 1.4–8.46 GHz radio spectral index during the MJD 54520 flare is -0.500.15 indicating that the radio emission is probably optically thin.
Relativistic arcsecond scale jets have not been found before for sources in the low–hard state (cf. Fender 2006; Fender et al. 2009). Therefore, it seems more likely that jet ejections earlier in the outburst of H 1743-322 caused shocks when travelling along the jet. We note that similar events could be behind the apparent scatter and variability in the observed radio – X–ray correlation in other sources (cf. Corbel et al. 2008). The resulting index then depends on the amount and energy in the shocks caused by earlier ejection events. These will change from source to source and from outburst to outburst. For instance, plotting the radio and X–ray detections in the low–hard state during the decay McClintock et al. (2009) we find that two of the three 2003 data points fall approximately a factor 2 to 3 below the curve in Figure 3.
Increases in the radio flux density in the low–hard state by factors of 3–10 have been observed in the short–timescale radio flares in the quiescent state of V 404 Cyg (Miller-Jones et al. 2008). Given that the radio and X–ray data that we presented here are not exactly simultaneous, any hour–long radio flare would have no corresponding flare in the X–ray band. Furthermore, even if the observations had been strictly simultaneous, the short integration times of our initial radio observations implies that an X–ray flare could have been missed since such an X–ray flare would take tens of minutes or longer to propagate downstream to the point in the compact jet where the optical depth is 1 at 8.46 GHz. Nevertheless, in order to produce a slope of the radio observations must have been close to the peak of flares, which seems unlikely. We conclude that optically thin radio emission from shocks caused by jet ejections earlier in the outburst influence the late time low–hard state radio emission.
Previous studies of black hole (candidate) sources decaying via the hard state to quiescence suggests that the power–law index of the X–ray spectrum in the quiescent state is different from that in the low–hard state. Ebisawa et al. (1994) observed GS 1124–68 with Ginga and found a power-law index that remained essentially constant at 1.6 during the time the source was decaying in the hard state, except at the lowest observed luminosity of (for =7) when it was found to be 1.840.04. Corbel et al. (2003) have reported a power-law spectral index of 2.2 around for GX 339–4 (for =5.8). Tomsick et al. (2004) followed XTE J1650–500 down to (for =8.5) with Chandra, and also found evidence for spectral softening. Finally, Corbel et al. (2008) show that the power–law spectral index is softer in V404 Cyg in quiescence compared to that in the brighter low–hard state.
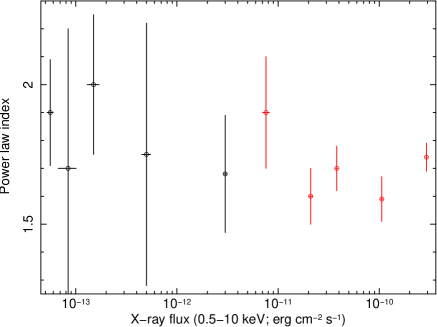
In Figure 4 we have plotted the power law index from the Swift and Chandra spectral modelling on H 1743-322 during the decay towards quiescence and in quiescence. The data point at the lowest X–ray flux is determined by combining the quiescent data obtained right after the outburst of early 2008 as well as the quiescence observations used by Corbel et al. (2005). There is no evidence for a softening of the power–law index towards and in quiescence, although for this source the relatively high neutral hydrogen column density limits the accuracy of the power–law determination. A fit of a constant power–law spectral index gives a best–fitting index of 1.7040.008 with a for 9 degrees of freedom.
We have compared the X–ray flux decay rate of H 1743-322 with that observed during the last part of the outburst decay from the black hole candidate XTE J1908+094 and we find that the fit function describing the decay of H 1743-322 is a good approximation to the last phase of approximately three weeks presented in Jonker et al. (2004) for XTE J1908+094. Note however, that due to a reduced sampling that source was only observed twice during those three weeks. Nevertheless, it is interesting to see that the sources have a similar decay rate. If other sources also follow the same decay rate in X–rays this could provide constraints on the accretion disc model, such as the accretion disc to ADAF evaporation.
Acknowledgments
PGJ acknowledges support from a VIDI grant from the Netherlands Organisation for Scientific Research. MAPT acknowledges support from NASA grant GO8-9042A. DS acknowledges an STFC Advanced FellowshipThe National Radio Astronomy Observatory is a facility of the National Science Foundation operated under cooperative agreement by Associated Universities, Inc.
References
- Angelini & White (2003) Angelini L., White N. E., 2003, ApJ, 586, L71
- Arnaud (1996) Arnaud K. A., 1996, in ASP Conf. Ser. 101: Astronomical Data Analysis Software and Systems V, Vol. 5, p. 17
- Baba et al. (2003) Baba D., Nagata T., Iwata I., Kato T., Yamaoka H., 2003, IAU Circ, 8112, 2
- Cadolle Bel et al. (2007) Cadolle Bel M., Ribó M., Rodriguez J., Chaty S., Corbel S., Goldwurm A., Frontera F., Farinelli R., D’Avanzo P., Tarana A., Ubertini P., Laurent P., Goldoni P., Mirabel I. F., 2007, ApJ, 659, 549
- Cash (1979) Cash W., 1979, ApJ, 228, 939
- Corbel et al. (2002) Corbel S., Fender R. P., Tzioumis A. K., Tomsick J. A., Orosz J. A., Miller J. M., Wijnands R., Kaaret P., 2002, Science, 298, 196
- Corbel et al. (2005) Corbel S., Kaaret P., Fender R. P., Tzioumis A. K., Tomsick J. A., Orosz J. A., 2005, ApJ, 632, 504
- Corbel et al. (2008) Corbel S., Koerding E., Kaaret P., 2008, MNRAS, 389, 1697
- Corbel et al. (2003) Corbel S., Nowak M. A., Fender R. P., Tzioumis A. K., Markoff S., 2003, A&A, 400, 1007
- Corbel et al. (2006) Corbel S., Tomsick J. A., Kaaret P., 2006, ApJ, 636, 971
- Ebisawa et al. (1994) Ebisawa K., Ogawa M., Aoki T., Dotani T., Takizawa M., Tanaka Y., Yoshida K., Miyamoto S., Iga S., Hayashida K., Kitamoto S., Terada K., 1994, PASJ, 46, 375
- Esin et al. (1997) Esin A. A., McClintock J. E., Narayan R., 1997, ApJ, 489, 865
- Fender (2006) Fender R., 2006, Jets from X-ray binaries, Lewin W. H. G., van der Klis M., eds., pp. 381–419
- Fender et al. (2003) Fender R. P., Gallo E., Jonker P. G., 2003, MNRAS, 343, L99
- Fender et al. (2009) Fender R. P., Homan J., Belloni T. M., 2009, MNRAS, 396, 1370
- Gallo (2007) Gallo E., 2007, in American Institute of Physics Conference Series, Vol. 924, The Multicolored Landscape of Compact Objects and Their Explosive Origins, di Salvo T., Israel G. L., Piersant L., Burderi L., Matt G., Tornambe A., Menna M. T., eds., pp. 715–722
- Gallo et al. (2006) Gallo E., Fender R. P., Miller-Jones J. C. A., Merloni A., Jonker P. G., Heinz S., Maccarone T. J., van der Klis M., 2006, MNRAS, 370, 1351
- Gallo et al. (2003) Gallo E., Fender R. P., Pooley G. G., 2003, MNRAS, 344, 60
- Gandhi et al. (2008) Gandhi P., Makishima K., Durant M., Fabian A. C., Dhillon V. S., Marsh T. R., Miller J. M., Shahbaz T., Spruit H. C., 2008, MNRAS, 390, L29
- Garcia et al. (2001) Garcia M. R., McClintock J. E., Narayan R., Callanan P., Barret D., Murray S. S., 2001, ApJ, 553, L47
- Garmire (1997) Garmire G. P., 1997, in Bulletin of the American Astronomical Society, Vol. 29, Bulletin of the American Astronomical Society, pp. 823–+
- Gierliński et al. (2008) Gierliński M., Done C., Page K., 2008, MNRAS, 388, 753
- Hameury et al. (2003) Hameury J.-M., Barret D., Lasota J.-P., McClintock J. E., Menou K., Motch C., Olive J.-F., Webb N., 2003, A&A, 399, 631
- Heinz et al. (2007) Heinz S., Schulz N. S., Brandt W. N., Galloway D. K., 2007, ApJ, 663, L93
- Hiemstra et al. (2009) Hiemstra B., Soleri P., Méndez M., Belloni T., Mostafa R., Wijnands R., 2009, MNRAS, 394, 2080
- Homan et al. (2005) Homan J., Buxton M., Markoff S., Bailyn C. D., Nespoli E., Belloni T., 2005, ApJ, 624, 295
- Jonker et al. (2004) Jonker P. G., Gallo E., Dhawan V., Rupen M., Fender R. P., Dubus G., 2004, MNRAS, 351, 1359
- Kalemci et al. (2008a) Kalemci, E, Tomsick, A. J., Yamaoka, K., Ueda, Y., 2008a, The Astronomer’s Telegram, 1348, 1
- Kalemci et al. (2005) Kalemci E., Tomsick J. A., Buxton M. M., Rothschild R. E., Pottschmidt K., Corbel S., Brocksopp C., Kaaret P., 2005, ApJ, 622, 508
- Kalemci et al. (2008b) Kalemci E., Tomsick J. A., Corbel S., Tzioumis T., 2008b, The Astronomer’s Telegram, 1378, 1
- Kaluzienski & Holt (1977a) Kaluzienski L. J., Holt S. S., 1977a, IAU Circ, 3099, 1
- Kaluzienski & Holt (1977b) —, 1977b, IAU Circ, 3106, 4
- Kong et al. (2002) Kong A. K. H., McClintock J. E., Garcia M. R., Murray S. S., Barret D., 2002, ApJ, 570, 277
- Körding et al. (2006) Körding E. G., Fender R. P., Migliari S., 2006, MNRAS, 369, 1451
- Krimm et al. (2009) Krimm H. A., Barthelmy S. D., Baumgartner W., Cummings J., Fenimore E., Gehrels N., Markwardt C. B., Palmer D., Parsons A., Sakamoto T., Skinner G., Tueller J., Ukwatta T., 2009, The Astronomer’s Telegram, 2058, 1
- Maccarone (2003) Maccarone T. J., 2003, A&A, 409, 697
- Markoff et al. (2003) Markoff S., Nowak M., Corbel S., Fender R., Falcke H., 2003, A&A, 397, 645
- Markwardt & Swank (2003) Markwardt C. B., Swank J. H., 2003, The Astronomer’s Telegram, 133, 1
- McClintock & Remillard (2006) McClintock J. E., Remillard R. A., 2006, Black hole binaries, Lewin W. H. G., van der Klis M., eds., pp. 157–213
- McClintock et al. (2009) McClintock J. E., Remillard R. A., Rupen M. P., Torres M. A. P., Steeghs D., Levine A. M., Orosz J. A., 2009, ApJ, 698, 1398
- Migliari et al. (2002) Migliari S., Fender R., Méndez M., 2002, Science, 297, 1673
- Miller et al. (2006a) Miller J. M., Homan J., Miniutti G., 2006a, ApJ, 652, L113
- Miller et al. (2006b) Miller J. M., Homan J., Steeghs D., Rupen M., Hunstead R. W., Wijnands R., Charles P. A., Fabian A. C., 2006b, ApJ, 653, 525
- Miller et al. (2006c) Miller J. M., Raymond J., Homan J., Fabian A. C., Steeghs D., Wijnands R., Rupen M., Charles P., van der Klis M., Lewin W. H. G., 2006c, ApJ, 646, 394
- Miller-Jones et al. (2008) Miller-Jones J. C. A., Gallo E., Rupen M. P., Mioduszewski A. J., Brisken W., Fender R. P., Jonker P. G., Maccarone T. J., 2008, MNRAS, 388, 1751
- Mineo et al. (2006) Mineo T., Romano P., Mangano V., Moretti A., Cusumano G., La Parola V., Troja E., Campana S., Chincarini G., Tagliaferri G., Capalbi M., Perri M., Giommi P., Burrows D., 2006, Nuovo Cimento B Serie, 121, 1521
- Narayan et al. (1997) Narayan R., Barret D., McClintock J. E., 1997, ApJ, 482, 448
- Prat et al. (2009) Prat L., Rodriguez J., Cadolle Bel M., Kuulkers E., Hanke M., Tomsick J., Corbel S., Coriat M., Wilms J., Goldwurm A., 2009, A&A, 494, L21
- Revnivtsev et al. (2003) Revnivtsev M., Chernyakova M., Capitanio F., Westergaard N. J., Shoenfelder V., Gehrels N., Winkler C., 2003, The Astronomer’s Telegram, 132, 1
- Rodriguez et al. (2007) Rodriguez J., Bel M. C., Tomsick J. A., Corbel S., Brocksopp C., Paizis A., Shaw S. E., Bodaghee A., 2007, ApJ, 655, L97
- Rupen et al. (2008) Rupen M. P., Dhawan V., Mioduszewski A. J., 2008, The Astronomer’s Telegram, 1384, 1
- Rupen et al. (2004) Rupen M. P., Mioduszewski A. J., Dhawan V., 2004, The Astronomer’s Telegram, 314, 1
- Russell et al. (2006) Russell D. M., Fender R. P., Hynes R. I., Brocksopp C., Homan J., Jonker P. G., Buxton M. M., 2006, MNRAS, 371, 1334
- Shaposhnikov et al. (2007) Shaposhnikov N., Swank J., Shrader C. R., Rupen M., Beckmann V., Markwardt C. B., Smith D. A., 2007, ApJ, 655, 434
- Soleri et al. (2009) Soleri P., Heinz S., Fender R., Wijnands R., Tudose V., Altamirano D., Jonker P. G., van der Klis M., Kuiper L., Kaiser C., Casella P., 2009, MNRAS, 397, L1
- Steeghs et al. (2003) Steeghs D., Miller J. M., Kaplan D., Rupen M., 2003, The Astronomer’s Telegram, 146, 1
- Tomsick et al. (2004) Tomsick J. A., Kalemci E., Kaaret P., 2004, ApJ, 601, 439
- Xue & Cui (2007) Xue Y. Q., Cui W., 2007, A&A, 466, 1053
- Yuan & Cui (2005) Yuan F., Cui W., 2005, ApJ, 629, 408