Color-Octet Production in Decay near the Kinematic Limit
Xiaohui Liu
Department of Physics and Astronomy,
University of Pittsburgh,
Pittsburgh, PA 15260
Abstract
Recent experiments by the CLEO III detector at CESR indicate that the
spectrum produced in decay is in conflict with
Non-Relativistic QCD (NRQCD) calculations. The measured momentum
distribution is much softer than predicted by the color-octet mechanisms. The
expected peak at the kinematic limit is not observed in the data. However it has
recent been pointed out that NRQCD
calculations break down near the kinematic endpoint due to large perturbative
and non-perturbative corrections. In this paper we combine NRQCD with
soft collinear effective theory to study the color-octet
contribution to the decay in this region of phase
space. We obtain a spectrum that is significantly softened when including the
correct degrees of freedom in the endpoint region, giving better agreement with
the data than previous predictions.
I Introduction
Since the discovery of the , heavy quarkonium decay and production
have served as a laboratory for testing both perturbative and
nonperturbative aspects of QCD dynamics. The large mass of the heavy
quark inside the quarkonium set a high mass scale () at which the QCD approaches
the asymptotically free regime and thus one could hope to calculate perturbatively.
On the other hand, hadronization process happens at the much smaller mass scale
of order , where is the typical velocity of the heavy quarks in
the quarkonium. For quarkonium, is numerically of order
so the involved QCD process also contains nonperturbative
effects.
During the past 15 years, the interactions of the non-relativistic heavy quarks inside the
quarkonium have been
understood to some extent using the framework of Non-Relativistic QCD
(NRQCD) Bodwin:1995prd ; Luke:2000prd . NRQCD is an effective theory
that reproduces the physics of full QCD by adding local interactions that
systematically incorporate relativistic corrections through any given order
in the heavy quark velocity . This effective theory provides a generalized
factorization theorem that includes nonperturbative
corrections to the color-singlet model, including color-octet decay mechanisms.
All infrared divergences can be factored into nonperturbative matrix elements,
so that infrared safe calculations of inclusive decay rates are
possible Bodwin:1992prd .
NRQCD solves some important phenomenological problems in quarkonium physics.
For instance, it provides the most convincing explanation to the
surplus and production at the Tevatron Braaten:1995prl ,
in which a gluon fragments into a color-octet pair in a pointlike
color-octet S-wave state which evolves nonperturbatively into the charmonium
states plus light hadrons. The NRQCD factorization formalism allows these
fragmentation procedures to be factored into the product of short distance
coefficients and long distance NRQCD matrix elements among which
the leading one is
where
are local -fermon operators in terms of
the fields of NRQCD.
There are, however, some problems that remain to be solved.
One challenging problem is with the polarization of
at the Tevatron. The same mechanism that produces the described above
predicts the should become transversely
polarized as the transverse momentum becomes
much larger than Cho:1995plb .
Though the theoretical prediction is consistent with the experimental data at
intermediate , at the largest measured values of the
is observed to be slightly longitudinally polarized and
discrepancies at the level are seen in both
prompt and polarization measurements Affolder:2000prl .
Recently, a new problem arose as a result of measurements of the
spectrum of produced in the decay by the CLEO III
detector at CESR Briere:2004prd . NRQCD calculations have been made
for the production of through both color-singlet and color-octet
configurations Li:2000plb ; Cheung:1996prd . Theoretical calculations
predict that the color-singlet process
features a soft momentum spectrum.
Meanwhile, the theoretical estimates based on color-octet contribution
indicates that the momentum spectrum peaks near the kinematic
endpoint Cheung:1996prd . In contrast to the theoretical predictoins,
the experimentally measured momentum spectrum is significantly softer than
predicted by the color-octet model and somewhat softer than the color-singlet
case Briere:2004prd .
The NRQCD predictions break down in the endpoint region because the effective field theory
does not contain the correct degrees of freedom to describe the physics. NRQCD contains soft
quarks and gluons, but it does not contain quarks and gluons moving collinearly.
The correct effective theory to use in situations where there is both soft and collinear physics is
Soft-Collinear Effective
Theory (SCET) BauerO:2001prd ; BauerS:2001prd ; Bauer:2001plb ; Bauer:2002prd .
A combination of SCET and NRQCD has been successful in reproducing the shape of the measured momentum spectrum in
FlemingIntro:2003prd . SCET has the power to
describe the endpoint regime by including the light energetic degrees of
freedom. In addition, renormalization group equations of SCET can be used to
resum large perturbative logarithmatic correctoins. Nonperturbative martix
will occur naturely in deriving the factorizatoin theorem using SCET.
In this paper, we use SCET to study the color-octet
contribution to the decay near the endpoint.
We derive the factorization theorm in SCET for this process.
We find that the spectrum is significantly softened
when including perturbative up to leading logarithms (LL)
and nonperturbative corrections near the
endpoint, giving better agreement with the data than the previous
predictions.
II Factorization and Matching
In this section, we briefly derive the SCET factorization theorem
for near the endpoint. A more detailed
derivation will be presented in the Appendix. The derivation is
similar to radiative decay Fleming:2003prd ,
which we refer to for details. However, for the process we discussed here,
it involves the decay of a heavy quarkonium into another heavy quarkonium,
thus we should combine SCET with two independent NRQCD’s for these two onia
systmes. The factorization for a similar process
has been discussed in Ref. Bobeth:2008prd .
Near the endpoint regime, a new factorization formula is required
since the NRQCD does not
include all the relevant physical degrees of freedom and thus the
factorization theorem breaks down.
This can easily be seen when we analyze the kinematics at the endpoint.
To do so, we work in the centre-of-mass (COM) frame, and introduce
light cone coordinates. By introducing the parameter
, we have
(1)
Here and , we
have defined , and we also assumed
that and .
and are the residual momentum
of the pair inside the and respectively. Near the kinematic
endpoint, the variable and thus the jet invariant mass
approaches zero.
In NRQCD, an expansion of is performed and hence the
jet mode is integrated out, which is only
valid when it has a large invariant mass, i.e., away from the endpoint.
As , the jet becomes energy is large, but the invariant mass becomes small,
with of order . Hence we must
keep to all orders. As a result, the standard NRQCD
factorization breaks down at the endpoint. SCET is the appropriate framework
for properly including the collinear modes needed in the endpoint
in order to make reasonable predictions.
To derive the factorization theorem in SCET, we start from the optical theorem
in which the decay rate can be written
as
(2)
where the summation includes integration over phase space of . The SCET operator
is
(3)
where the Wilson
coefficient is obtained by matching from QCD to SCET at some hard scale
and the SCET current function is contrained by
the gauge invariance. For instance, in our case, to leading order the
non-vanshing SCET current will be of the form
(4)
Here is a hard coefficient containing the
color and spin structures which is obtained by matching onto the QCD
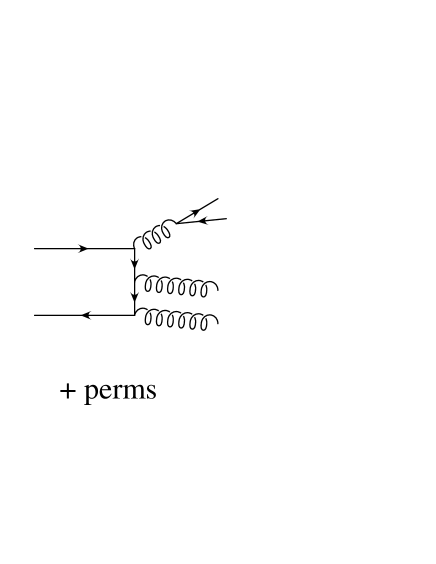
Feynman diagrams shown in fig. 1.
Figure 1: QCD production amplitude for .
The is produced in a color-octet and becomes
a color-singlet by emitting a soft gluon.
There is another contribution to this process with only one gluon emitted,
which is suppressed by an order of .
The matching gives
(5)
where we have chosen the coefficient so that the Wilson coeffcient
is at the hard scale .
The ’s boost the or from the COM frame to a frame where
those quarkonia have arbitrary four-momentum.
and are the heavy quark and antiquark fields which
create or annihilate the constituent heavy (anti-)quarks inside the quarkonia.
The collinear gauge invariant field strength is built out of the collinear
gaugle field
(6)
where
(7)
is the collinear Wilson line. The operator picks out the large momentum
label Bauer:2001plb .
We can decouple the usoft modes from the collinear degrees of
freedom by making the field redefinition Bauer:2002prd
(8)
where is the usoft Wilson line made out of the usoft gauge fields. In such
a way, we can separate the collinear physics from the usoft and obtain the
factorization theorem in SCET. Meanwhile using similar arguments presented
in Ref. Bobeth:2008prd allows us to factorize the matrix element into
the convolution of the shape functions for in color-singlet
configuration and in color-octet one.
Following this procedure, the decay rates can be written as
a convolution of soft shape functions and the jet function with an
overall hard coefficient. By introducing ,
we get the decay rate of the form
to simplify the matrix elements, and applied the
identity , where is the four-velocity
of the or .
The shape function for is defined as
(12)
where we have made the field redefinition in Eq. (8) for the two
collinear gluons in the final state by introducing two different usoft Wilson lines
and .
For we have the shape function
(13)
respectively. Both shape functions are normalized so that
.
The jet function is given by
(14)
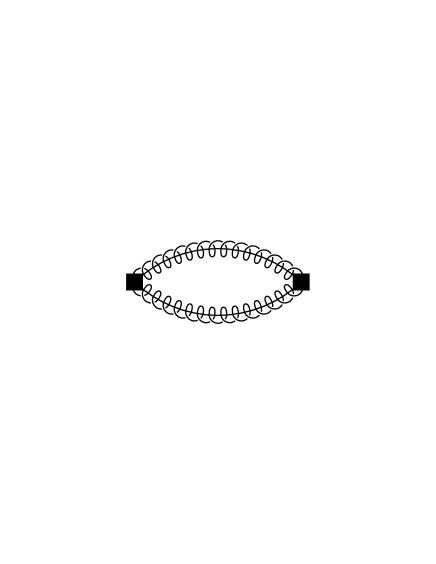
To the leading order, the jet function can be calculated by evaluating the
diagram shown in Fig. 2 , which gives
(15)
where is the total four momentum carried by the jets.
Figure 2: Feynman diagram for the leading-order jet function. The spring with a line through
it represents a collinear gluon.
The shape function can formally be written as
(16)
and to lowest order in , . By
integrating over and in Eq. (9), we find
the tree level decay rates become
(17)
with . This can easily be seen to reproduce the
tree level calculation of NRQCD Cheung:1996prd .
III Running
Effective field theories provide a powerful tool to sum logarithms
by using the renormalization group equations (RGEs). Logarithms of the
ratio of different scales arise naturally in perturbation theory, which
can cause a breakdown of the perturbative expansion when those scales are
well separated. By matching onto an effective theory, the large scale is removed to
be replaced by a running scale and the effective
operators are run from a high scale to the low scale using the RGEs, which
sum all large logarithms of the ratio of scales into an overall factor.
In our case, there are logarithms of the form that will appear in
the perturbation series. Near the endpoint, , these
become large, and must be resummed.
In this section, we will apply the RGEs of SCET to sum these large logarithms.
In the previous section, we have matched QCD onto the SCET operator by
intergrating out the hard scale , replacing it with a running scale
. We now run the operator from this hard scale to the collinear scale. To do
so, we calculate the counterterm for the operator to determine the anomalous
dimension, and then use this in the RGEs.
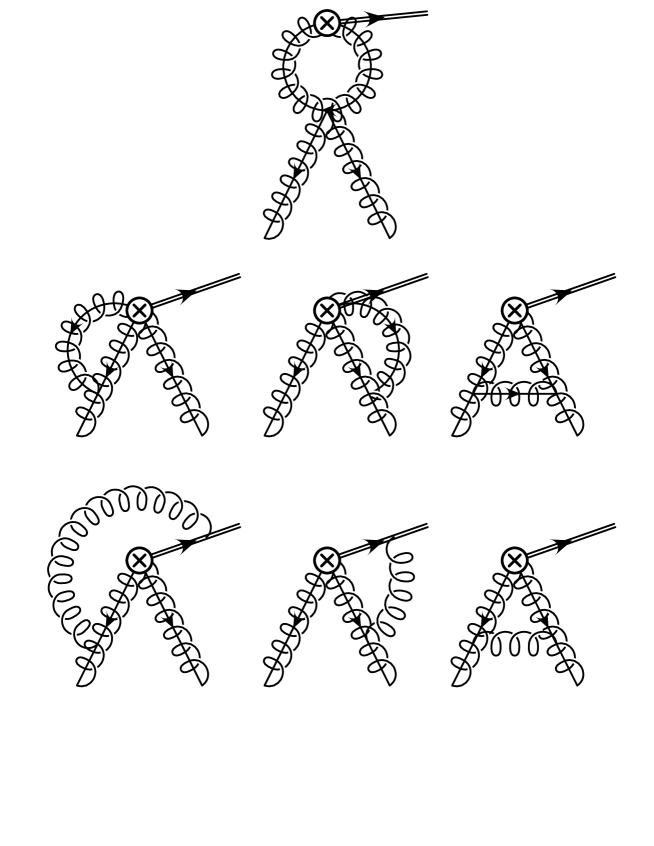
Figure 3: One-loop order diagrams needed to calculate the counterterm to the color-octet
operator.The double line presents the fields in color-octet
configuration while the spring lines are the soft gluons.
The one-loop corrections to the SCET operator in Eq. (4) is given by
the graphs in Fig. 3. Evaluating these diagrams gives the
divergent term
The calculation lets us estimate the hard scale be
which will minimize
the logarithm. The divergent piece must be canceled by
, where is the couterterm for the
operator in SCET, is the gluon wave function counterterm
(19)
and is the counterterm of color-octet operator
(20)
This leads to
From Eq. (III), we can extract the anomalous dimensioin of the operator
through the standard method. Using the anomalous dimension in the RGE for the
color-octet Wilson coefficient and running from the hard scale down to the
collinear scale gives
(22)
where
(23)
with , , and the collinear scale
.
At the collinear scale, the jet mode can be regarded as large and can be
integrated out. The decay rate can be further run down to the soft scale
. To do this, we first note that the decay rate can be modified to
And here we introduced an evolution kernel as in
Ref. Fleming:2007prd .
The soft shape function has evolution through which will sum the
large logarithms between and .
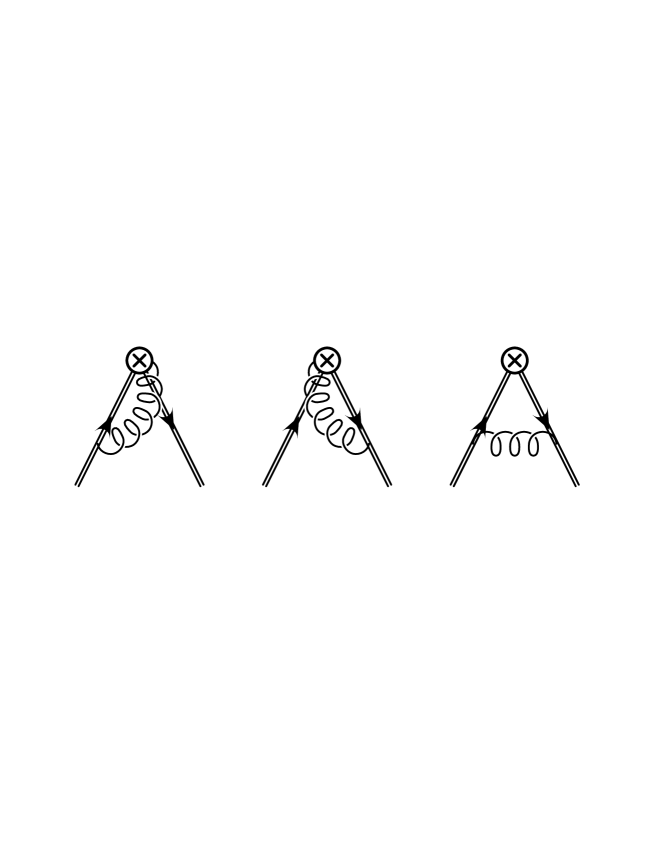
Figure 4: One loop corrections to the soft shape function defined in
Eq. (12).
The evolution kernel can be calculated explicitly Fleming:2007prd , once
we figure out the anomalous dimension for the soft shape function. To one-loop
order, calculating the diagrams in fig. 4, we get
Gathering all the pieces we have, we find the resumed decay rate
(31)
IV Phenomenology
The decay rate from the previous section, Eq. (31), summed up the
leading logarithmic corrections which are important near the kinematic
endpoint. Away from that region, the
logarithms that we have summed are not important and contributions that we
neglected in the endpoint become important. We therefore would like to
interpolate between the leading order color-octet contribution in NRQCD away
from the endpoint and the resummed result near the endpoint. We thus
define the interpolated differential rate as
(32)
Here, in order to compare with the data, we have used the scaled momentum
defined as . We see that as the first term
vanishes, leaving only the SCET contribution in the endpoint region.
To proceed, we need the soft shape fucntion of that appears in
Eq. (31). We will apply a modified version of a model used in the
decay of B mesons Leibovich:2002plb ,
(33)
with . Here is of order
, and and are adjustable parameters of order .
In our case, we choose and . was determined so that
the first and the second moments of the shape function
(34)
take the value and respectively.
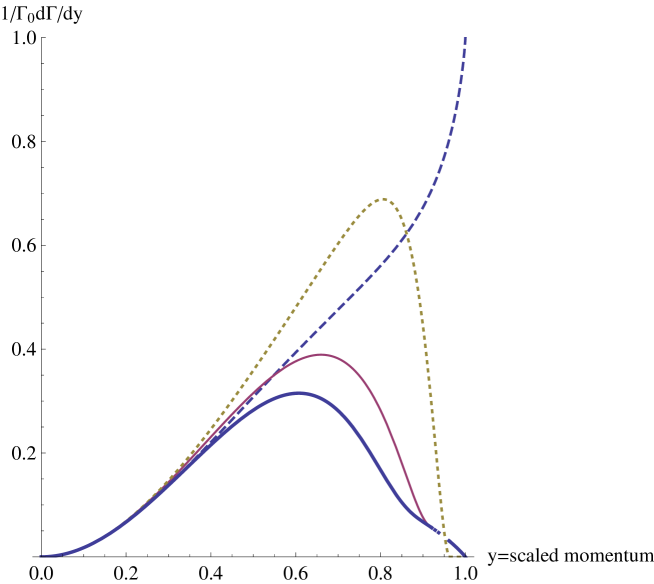
We show the results of resumming in fig. 5. The short
dashed line is the
NRQCD decay rate only and the dotted line is the NRQCD decay rate convoluted
with the shape function. The thin line includes only the perturbative resummed
interpolated decay rates without convoluted with the soft shape function.
The solid thick line presenting our final result is
the interpolated decay rate
convoluted with the shape function in Eq. (33).
As can be
seen, the shape function and the perturbative resummation both result in a softer spectrum.
The combination of the two is softer still.
In fig. 6, we compare our results with the experimental data from
CLEO Briere:2004prd . We use the values , , and
so that . The solid line represents the color-octet interpolated decay rate convoluted with the shape function. The
NRQCD matrix element was chosen to be
. For comparison, we have used in the plot the same value for the
overall strong coupling evaluated at the scale as in
Ref. Cheung:1996prd . The shaded band is obtained by varying the
NRQCD color-octet matrix
element from 0.003 GeV3 to 0.014 GeV3. Since the numerical value of the
matrix element
is fixed by experimental data,
it has large uncertainties coming both from experiments and theoretical higher order
corrections. For comparison, we also show the color-singlet contribution as the dashed line Briere:2004prd ; Li:2000plb .
The complete spectrum involves a combination of the color-octet contribution
we calculated here, and the color-singlet
component Briere:2004prd ; Li:2000plb shown in the figure.
Figure 5: Comparison between the NRQCD results and SCET predictions
normalized to the NRQCD decay rate at the end-point.
Here is the scaled momentum. The short
dashed line is the NRQCD
decay rate only and the dotted line is the NRQCD decay rate convoluted with
the shape function. The solid
thin line includes only the perturbative resummed
interpolated decay rates without convoluted with the soft shape function.
The solid thick line presents the interpolated decay rates
convoluted with the shape function.
Figure 6: Comparison of the color-octet contribution to the differential rate to
the data from
CLEO Briere:2004prd .
The solid thick line presents the interpolated decay rates
convoluted with the shape function with a choice of
Cho:1996prd .
The shaded band is obtaiend by varying
from to
Fleming:1997prd . Here, we also show the
color-singlet contribution in long dashed line Briere:2004prd ; Li:2000plb . The complete spectrum will involve a combination of both
the color-octet and color-singlet contributions.
The differential rate predicted by the
color-octet model is peaked near the end-point region. When convoluted with
the shape function, the momentum distribution is shifted to the left
but still close to the kinematic limit. Once we resum the large leading
logarithms under the framework of SCET, interpolate the result with the NRQCD
prediction and then convolute with the soft shape function, we find that
spectrum is significantly softened near the endpoint and the peak is pushed
further to the left, in better agreement with the data. We
note here that if we use a high scale for the overall coupling constant, the
color-octet contribution will be much smaller.
In order to make a consistent comparison of theory to data, one needs
to treat the endpoint of the color-singlet contribution in SCET and NRQCD,
which we have not done here and will leave for future work. In the
perturbative expansion, the color-singlet process is suppressed relative to
the color-octet one by an factor of . However, there is a large enhancement
due to kinematic factors in the diagram, which can be as large as that provides a huge
enhancement to compensate the perturbative suppression Li:2000plb .
V Conclusion
In this paper we studied the color-octet contribution to
near the kinematic endpoint. In this regime, the usual
NRQCD factorization formalism breaks down due to large perturbative and
nonperturbative corrections. We combined the usual NRQCD effective theory with
SCET, which contains the correct physical degrees of freedom, to derive a factorizatioin
theorem for the differential decay rate, ,
valid in the endpoint region.
This also allows us to resum large logarithms which appear in the endpoint by
running the rate from the hard scale to the collinear scale and then to the
soft scale using the RGE of the effective theory.
At the soft scale, we are left with NRQCD shape functions.
Using models for the color-octet shape function, and interpolating away from the endpoint to the leading order NRQCD prediction, we are
able to make predictions about the color-octet contribution to the decay rate
over the entire kinematic region.
Though a quantitative comparison to data can be made only when including both
the color-singlet and color-octet terms, some qulitative conclusions can still
be drawn here. We note that once we sum the large leading logarithms
using the
framework of SCET and
convolute with the soft shape function, the spectrum is significantly
softened near the endpoint and the peak is broadened and shifted to the left.
This effect greatly improves the agreement between the data constraints and
the theoretical predictions.
We note here that the hard scale we have chosen in our final results is
the same as in Cheung:1996prd .
This scale is much smaller than what we expected from our
one loop order corrections. If we used the hard scale decided by
our caculations, the color-octet contribution will be further suppressed.
As a result, we expected that the dominant contribution for this process
will be from color-singlet rate. Once including higher order effects as well as
the feed-down of and to Briere:2004prd ,
the color-singlet decay rate should also be softened. We expected that
combining color-singlet and octet contributions will give a good fit to the
data.
VI Acknowledgements
I am grateful to Professor A. K. Leibovich for guidances and carefully
reading the manuscript and checking all the calculations. XL was supported
in part by the National Science Foundation under Grant No. PHY-0546143.
Appendix A Deriving The Factorization Theorem for the Endpoint
In this Appendix we show the factorization theorem for
near the endpoint. We begin with the differential
decay rate
(35)
where includes both the usoft sector and the collinear sector.
The operator is the SCET operator defined
in Section II of the form
(36)
where
(37)
(38)
(39)
Inserting the operator into Eq. (35), the picks
up an additional phase and the differential rate becomes
(40)
In the exponent of Eq. (40), we have used
.
As mentioned in Section II, we can decouple the usoft modes from
the collinear degrees of
freedom using the field redefinition Bauer:2002prd
(41)
which modifies to
(42)
Using this field redefinition, we can write
(43)
where we have introduced an interpolating field,
, for the and used the completeness of states in the usoft
and collinear sectors
(44)
(45)
The the usoft Wilson lines only come with the color-octet operator,
.
The is a very compact
bound state, due to the large -quark mass. In a multipole expansion, long wavelength gluons interacts
with the color charge distribution through its color dipole moment since
the state itself is color neutral. In the theoretical limit of very heavy bottom quark,
this coupling to the dipole vanishes Bobeth:2008prd . The order of the
corrections can be estimated by means of the
“vacuum-saturation approximation” Bodwin:1995prd . A complete set of
light-hadronic states
can be inserted between the operator and the operator.
Notice that the operator is in color-singlet configuration.
therefore the sum over states is saturated by the QCD vacuum with
corrections of order Bodwin:1995prd .
Thus we are able to write
(46)
Now we substitute the expressions for the and shape functions
as well as the jet function from Section II into Eq. (46),
and use
. The
result for differential decay rate becomes
(47)
Thus we obtain the desired factorization theorem in the endpoint region.
References
(1)
G. T. Bodwin, E. Braaten and G. P. Lepage, Phys. Rev. D 51 1125 (1995).
(2)
M. E. Luke, A. V. Manohar and I. Z. Rothstein, Phys. Rev. D 61
074025 (2000).
(3)
G. T. Bodwin, E. Braaten and G. P. Lepage, Phys. Rev. D 46 1914 (1992).
(4)
E. Braaten and S. Fleming Phys. Rev. Lett 74 3327 (1995).
(5)
P. L. Cho and M. B. Wise, Phys. Lett. B 346 129 (1995);
A. K. Leibovich, Phys. Rev. D 56 4412 (1997);
M. Beneke and M. Kramer, Phys. Rev. D 55 5269 (1997);
E. Braaten, B. A. Kniehl and J. Lee, Phys. Rev. D 62 094005 (2000).
(6)
T.Affolder et al. [CDF Collabortion], Phys. Rev. Lett. 85 2886 (2000).
(7)
R. A. Briere, et al, CLEO Collaboration, Phys. Rev. D 70 072001 (2004)
(8)
Shi-yuan Li, Qu-bing Xie and Qun Wang, Phys.Lett. B 482 65 (2000).
(9)
Kingman Cheung, Wai-Yee Keung and Tzu Chiang Yuan, Phys.Rev. D
54 929 (1996).
(10)
C. W. Bauer, S. Fleming and M. Luke, Phys. Rev. D 63 014006 (2001).
(11)
C. W. Bauer, S. Fleming, D. Pirjol and I. W. Stewart, Phys. Rev. D 63
114020 (2001).
(12)
C. W. Bauer and I. W. Stewart, Phys. Lett. B 516 134 (2001).
(13)
C. W. Bauer, D. Pirjol and I. W. Stewart, Phys. Rev. D 65 054022 (2002).
(14)
S. Fleming, A. K. Leibovich, and T. Mehen, Phys. Rev. D 68 094011 (2003).
(15)
C. Bobeth, B. Grinstein, and M. Savrov, Phys. Rev. D 77 074007 (2008).
(16)
S. Fleming, A. K. Leibovich, Phys. Rev. D 67
074035 (2003).
(17)
E. Braaten and Y. Q. Chen, Phys. Rev. D 54 3216 (1996).
(18)
I. Z. Rothstein and M. B. Wise, Phys. Lett. B 402, 346 (1997).
(19)
S. Fleming, A. H. Hoang, S. Mantry and I. W. Stewart,
Phys. Rev. D 77 114003 (2008).
(20)
A. K. Leibovich, Z. Ligeti and M. B. Wise,
Phys. Lett. B 539 242 (2002).
(21)
P. Cho and A. K. Leibovich, Phys. Rev. D 53 150 (1996).
(22)
S. Fleming, O. F. Hernandez, I. Maksymyk and H. Nadeau,
Phys. Rev. D 55 4098 (1997).