Unfolding times for proteins in a force clamp
Abstract
The escape process from the native valley for proteins subjected to a constant stretching force is examined using a model for a -barrel. For a wide range of forces, the unfolding dynamics can be treated as one-dimensional diffusion, parametrized in terms of the end-to-end distance. In particular, the escape times can be evaluated as first passage times for a Brownian particle moving on the protein free-energy landscape, using the Smoluchowski equation. At strong forces, the unfolding process can be viewed as a diffusive drift away from the native state, while at weak forces thermal activation is the relevant mechanism. An escape-time analysis within this approach reveals a crossover from an exponential to an inverse Gaussian escape-time distribution upon passing from weak to strong forces. Moreover, a single expression valid at weak and strong forces can be devised both for the average unfolding time as well as for the corresponding variance. The analysis offers a possible explanation of recent experimental findings for ddFLN4 and ubiquitin.
pacs:
87.15.A-,87.15.hm,87.15.La,05.40.JcSingle-molecule pulling experiments have become an important and widely used tool for examining mechanical properties of proteins forman . These experiments have stimulated a renewed interest in the escape processes from metastable potential wells in the presence of a biasing force evans . Traditionally, the dependence of the escape rate on the stretching force has often been modeled using the phenomenological Bell formula bell , where is the distance from the native to the transition state and assumed constant (, with being Boltzmann’s constant and the temperature). The zero-force rate satisfies , where is the escape free-energy barrier at zero force. There are, however, uncertainties about how to extract the zero-force properties , and from observed escape rates at non-zero force. One problem is the unknown constant of proportionality in the expression for . Another difficulty is that the distance between the native free-energy minimum and the unfolding barrier, which is assumed constant in the Bell formula, generally depends on the applied force.
To address these problems, several generalizations of the Bell formula have recently been proposed dudko ; liu ; friddle ; dudko08 . Most of the extensions are based on the same underlying picture as for the Bell formula; the protein is viewed as a Brownian particle moving in a tilted one-dimensional potential, , where is the equilibrium free-energy profile. Using different approximations and parametrizations of , key properties of the escape process have been analyzed, like the mean and variance of the rupture force at constant velocity pulling dudko ; friddle . It was further shown dudko08 that the approach of Dudko, Hummer and Szabo (DHS) dudko is able to describe experimentally observed deviations from the Bell formula for the protein ddFLN4 rief .
These extensions based on Kramers theory review assume that the escape barrier is high compared to , leading to single-exponential kinetics. Very recently, Yew et al. analyzed deviations from single-exponential kinetics in unfolding simulations based on a Cα model paci . By including the next-to-leading term in an eigenfunction expansion, they obtained an improved description of the unfolding dynamics at strong force. However, a comprehensive picture describing and the full escape-time distribution at both weak and strong force is still missing. A key parameter when describing the force dependence is the critical force , at which the escape barrier disappears. In the DHS approach dudko ; dudko08 , one has , where is a model parameter ( corresponds to the Bell formula). The above-mentioned ddFLN4 analysis dudko08 (with or 2/3) suggests that –110 pN for this protein. For the titin module I27, on the other hand, appears to be significantly larger ( pN dougan ). Due to different , when analyzing experimental data, the strong-force regime may or may not be relevant, depending on the protein.
In this Letter we investigate the response of a model protein to a wide range of constant pulling forces. We show that, once the free-energy landscape is known with sufficient accuracy, the usual Smoluchowski equation review in one dimension is sufficient to obtain a good estimate of the average escape time from the native valley and the associated variance. Two force regimes, separated by the critical force , are observed. For , unfolding occurs through a thermally activated escape process. For , the unfolding dynamics can instead be interpreted as pure diffusion with an external bias. The transition from the weak- to the strong-force regime is accompanied by a drastic change in the shape of the escape-time distribution, from exponential to inverse Gaussian. The applicability of this approach to real proteins, at forces studied experimentally, is addressed using recently reported data for ddFLN4 rief ; dudko08 and ubiquitin garcia2 ; garcia1 .
The protein model we consider is the 3D off-lattice BPN model honey ; berry ; veit , where each residue is represented by a single point and is of one of the following three types: hydrophobic (B), polar (P) or neutral (N). We study a 46-residue sequence which is known to form a four-stranded -barrel in its native state. The folding honey ; berry ; veit ; guo and mechanical unfolding cinpull ; lit of this sequence have been extensively studied. We analyze via Langevin dynamics the response of this model protein to external forces acting on the chain ends in proximity of its folding temperature, namely at lit . Parameters values are as in Ref. lit and all model quantities are dimensionless; for a comparison with physical units, see Ref. veit .
A typical unfolding trajectory begins with a waiting phase, where the end-to-end distance stays close to its native value. This phase is followed by a sudden increase in . A fundamental question is whether the escape from the native valley can be effectively described as one-dimensional diffusion, parametrized in terms of . Based on this assumption the unfolding process is commonly described as the motion of a point-like Brownian particle in the potential , where is the equilibrium free-energy profile. The average first passage time at a threshold for a particle with initial position can be obtained by solving the Smoluchowski equation. One finds that review
| (1) |
where is the particle mass and the damping constant. The boundaries at and are reflecting and absorbing, respectively. When using Eq. (1) to calculate the escape time from the native valley, is the native and is that of the saddle, or barrier, to be crossed. The escape time is obtained as . In our simulations, escape times are measured using a threshold slightly larger than , to avoid saddle recrossing review .
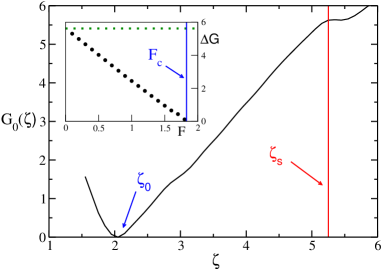
We begin by testing the escape-time prediction directly against simulation results for the BPN protein, without making any further assumption on the form of . For this purpose, we determine numerically, using methods described in Ref. lit . Fig. 1 shows the calculated free-energy profile at zero force, , which exhibits a pronounced native minimum at and a barrier at . The height of the barrier is . The application of a stretching force tilts the free-energy landscape to and reduces the barrier height . As shown in the inset of Fig. 1, decreases almost linearly with . The barrier finally disappears at .
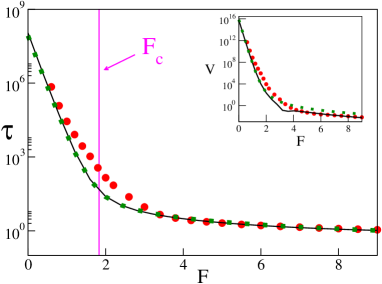
Knowing , the escape-time prediction can be obtained by numerically evaluating the double integral in Eq. (1). In Fig. 2 we compare with simulated escape times. The agreement is very good for strong forces () as well as at weak forces (). Due to computational limitations, it was impossible to investigate forces . The regime in which the simulated escape times are most difficult to reproduce is around the critical force , where there is no clear free-energy gradient either towards or away from the native state. In this regime, the details of the free-energy profile matter. It is remarkable, however, that this simple picture, without employing any fitting parameter, is able to describe the behavior at both strong and weak forces, despite escape-time differences of almost six orders of magnitude.
This analysis, based on the full profile , addresses in a direct manner the question of whether or not the system can be described in terms of one-dimensional diffusion. In unfolding experiments, is unknown, and the challenge is to extract the main features of the free-energy landscape from measured escape times. This task is greatly facilitated if the free energy can be linearly approximated in the interval , as (up to an additive constant). With this approximation, the integrals in Eq. (1) can be evaluated analytically. The resulting expression, for the average escape time of a diffusive particle in one dimension in the presence of a bias ( in the present context), is Redner
| (2) |
where is the distance between the reflecting and absorbing boundaries. Unlike the result reported in Ref. Redner , Eq. (2) includes the effect of a zero-force barrier, represented by the term . The singular terms at in Eq. (2) cancel out, as they should.
The assumption that is linear between the native state and the saddle is quite well satisfied for the BPN protein (see Fig. 1). Actually, the escape times obtained using this approximation, , essentially coincide with the estimated obtained using the full , as can be seen from Fig. 2. Note that Eq. (2), like Eq. (1), has no parameter that needs to be fitted, because we can use the value of previously determined. While Eq. (2) well describes the escape time down to the lowest forces that could be studied, one should still be cautious in using this expression to extrapolate to zero force, because a “turnover” to a force-independent process is likely to occur at weak force Best . The extent of this weak-force regime might be non-negligible if the temperature is high Best .
The variance of the escape time is in the Smoluchowski approach given by , where the second moment reads gardiner
| (3) |
Like the mean, the variance can be obtained analytically if depends linearly on . This estimate of the variance, , can be found in Eq. (S1) epapsfile . The inset of Fig. 2 shows our simulation results for the variance of the escape time for the BPN protein, along with the estimates and . For , and are almost identical; while for , is slightly larger than both and the simulation results, although the corresponding three average times are very similar in this regime. Overall, both and agree well with the simulation results.
It is informative to go beyond the first and second moments and also study the full probability distribution of the escape time. For , we find that the escape-time distribution of the BPN protein to a very good approximation is exponential, , with being the mean (see Fig. 3a). This observation confirms that at weak forces, where a free-energy barrier is still present, the main escape mechanism is thermal activation. At , the escape process changes in character, from a thermally activated process to a diffusive process driven by an external bias (force). In the latter regime, it is known that first-passage times follow a so-called inverse Gaussian distribution gaussiana . This distribution is given by
| (4) |
where is the mean and , being the variance. This expression indeed provides a very good description of our simulation results at strong forces, as illustrated in Fig. 3b. It should be noticed that this comparison does not involve any parameter fitting, because and are determined directly from the simulations.
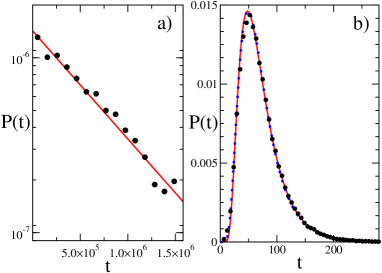
Previous studies have used a log-normal distribution, rather than the inverse Gaussian, to describe the escape-time distribution at strong forces Cieplak ; zamparo . While the log-normal distribution is similar to the inverse Gaussian (see Fig. 3b), there is no theoretical background to justify its use in the present context. The inverse Gaussian distribution is, by contrast, known to arise from biased Brownian motion gaussiana , which provides a simple physical picture of the unfolding dynamics at strong forces.
Having seen that our approach provides a good description of the unfolding dynamics of the BPN protein, we now turn to two real proteins, ddFLN4 and ubiquitin. Two results of the above analysis are particularly useful when comparing with experimental data. The first is Eq. (2), which provides an approximate closed-form expression for the average escape time at both weak and strong forces. The second result is that the onset of the non-exponential strong-force behavior of is accompanied by a change of shape of the escape-time distribution, from exponential to inverse Gaussian.
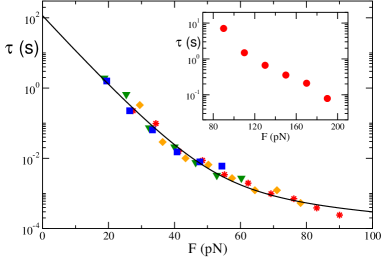
Experimental unfolding times for ddFLN4 show, as mentioned earlier, clear deviations from the Bell formula rief ; dudko08 . It has been demonstrated dudko08 that the DHS approach dudko describes the data well. In Fig. 4, we show a fit of our Eq. (2) to the same data. The fit is good, and the fitted values nm (corresponding to ) and kcal/mol are consistent with the results of Ref. dudko08 . Unlike the DHS approach, ours does not assume the escape barrier to be high. For ddFLN4, our fit to the data indicates that the barrier disappears already at pN. It would be very interesting to see whether the escape-time distribution is inverse Gaussian at, say, 100 pN, but this distribution has not been evaluated, as far as we know.
For ubiquitin, the escape-time distribution has been measured experimentally at 110 pN garcia2 . The data were found to be well described by a log-normal distribution garcia2 , which is very similar to the inverse Gaussian one found above at strong forces. Our approach thus offers an explanation of the shape of the observed distribution. This explanation requires that pN. Very recent experimental data for ubiquitin garcia1 show signs of deviations from the Bell formula (see inset of Fig. 4). However, it was found that the data could not discriminate between the Bell and DHS formulas garcia1 . Neither are the data sufficient to permit a stable fit of Eq. (2), which would have given us an independent estimate of . The assumption that pN seems, however, fully consistent with the experimental data.
In this Letter we have shown for a model protein that the unfolding process from the native valley under force-clamp conditions can be modeled as a Brownian motion in a tilted one-dimensional free-energy landscape. Moreover, it turned out that this description could be further simplified with a surprisingly small loss of accuracy, by adopting a linear approximation for the free energy. This analysis links deviations from the Bell formula for for to an altered shape of the escape-time distribution, from exponential to inverse Gaussian. Comparison with experiments indicates that the strong-force regime might set in at relatively weak force ( pN) for both ddFLN4 and ubiquitin.
References
- (1) J.R. Forman and J. Clarke, Curr. Opin. Struct. Biol. 17, 58 (2007).
- (2) E. Evans and K. Ritchie, Biophys. J. 72, 1541 (1997).
- (3) G. I. Bell, Science 200, 618 (1978).
- (4) O.K. Dudko et al., Phys. Rev. Lett. 96, 108101 (2006).
- (5) H.J. Lin et al., Phys. Rev. Lett. 98, 088304 (2007).
- (6) R. W. Friddle, Phys. Rev. Lett. 100, 138302 (2008).
- (7) O.K. Dudko et al., Proc. Natl. Acad. Sci. U.S.A. 105, 15755 (2008).
- (8) M. Schlierf and M. Rief, Biophys. J. 90, L33 (2006).
- (9) P. Hänggi et al., Rev. Mod. Phys. 62, 251 (1990).
- (10) Z.T. Yew et al., Phys. Rev. Lett. 101, 248104 (2008).
- (11) L. Dougan et al., Proc. Natl. Acad. Sci. U.S.A. 105, 3185 (2008).
- (12) S. Garcia-Manyes et al., Biophys. J. 93, 2436 (2007).
- (13) S. Garcia-Manyes et al., Proc. Natl. Acad. Sci. U.S.A. 106, 10534 (2009).
- (14) J.D. Honeycutt and D. Thirumalai, Proc. Natl. Acad. Sci. U.S.A. 87, 3526 (1990).
- (15) R.S. Berry et al., Proc. Natl. Acad. Sci. U.S.A. 94, 9520 (1997).
- (16) T. Veitshans et al., Folding & Design 2, 1 (1997).
- (17) Z. Guo and C.L. Brooks III, Biopolymers 42, 745 (1997); J.G. Kim et al. Phys. Rev. Lett. 97, 050601 (2006).
- (18) F.-Y. Li et al., Phys. Rev. E63 (2001) 021905; D.J. Lacks, Biophys. J. 88 (2005) 3494.
- (19) A. Imparato et al., Phys. Rev. Lett. 99, 168101 (2007); S. Luccioli et al., Phys. Rev. E78, 031907 (2008).
- (20) S. Redner, A guide to first passage processes (Cambridge University Press, Cambridge, 2001)
- (21) R.B. Best et al., J. Phys. Chem. B 112, 5968 (2008).
- (22) C.W. Gardiner, Handbook of Stochastic Methods (Springer, Berlin, 2004).
- (23) See EPAPS Document No. # for supplementary material.
- (24) R. S. Chikara and J. L. Folks, The inverse Gaussian distribution (Marcel Dekker, New York, 1988).
- (25) A. Imparato et al., Phys. Rev. Lett. 98, 148102 (2007); J. Chem. Phys, 127, 145105 (2007).
- (26) P. Szymczak and M. Cieplak, J. Phys.: Condens. Matter 18, L21 (2006)
Supplementary Information
Variance of the unfolding time in the linear approximation
The variance of the unfolding time as obtained in the Smoluchowski approach is given in the Letter, for a general free energy . The integrals in this expression can be evaluated analytically if the free energy is assumed to be linear in the interval , . At external force , the variance is then given by
| (S1) |
where the symbols are as in the Letter. This result extends the one reported in equation (2.2.31) of Ref. Redner , for a particle diffusing in one dimension in the presence of a bias ( in our context), to the case where a barrier (represented by the term ) is present also at zero bias.
Strong force limit
The expressions for the average unfolding time and the associated variance, in the linear approximation, can be simplified for strong forces tuckwell ,
| (S2) |
Using these expressions, it is, in principle, possible to extract the critical force () and the distance to the transition state (), and thereby also the zero-force barrier (), from escape-time measurements at strong forces.
Description of the experimental data for ddFLN4
Fig. 4 in the Letter shows unfolding times at different forces for the ddFLN4 protein. The data have been extracted from Fig. 2b in Ref. dudko08 . The results in Ref. dudko08 were based on constant-velocity AFM pulling experiments by Ref. rief . Rupture-force histograms obtained by Ref. rief were transformed in Ref. dudko08 into force-dependent unfolding times measurable at constant force. The symbols in Fig. 4 are as in Ref. dudko08 and correspond to different pulling velocities in the original experiments: nm/s (blue squares), nm/s (green triangles); nm/s (yellow diamonds), and nm/s (red stars).
References
- (1) S. Redner, A guide to first passage processes (Cambridge University Press, Cambridge, 2001).
- (2) H.C. Tuckwell, Introduction to theoretical neurobiology (Cambridge University Press, Cambridge, 1988)
- (3) O.K. Dudko et al., Proc. Natl. Acad. Sci. U.S.A. 105, 15755 (2008).
- (4) M. Schlierf and M. Rief, Biophys. J. 90, L33 (2006).