A slitless spectroscopic survey for H emission-line objects in SMC clusters
Abstract
Aims. This paper checks on the roles of metallicity and evolutionary age in the appearance of the so-called Be phenomenon.
Methods. Slitless CCD spectra were obtained covering the bulk of the Small Magellanic Cloud. For H line emission twice as strong as the ambient continuum, the survey is complete to spectral type B2/B3 on the main sequence. About 8,120 spectra of 4,437 stars were searched for emission lines in 84 open clusters. 370 emission-line stars were found, among them at least 231 near the main sequence. For 176 of them, photometry could be found in the OGLE database. For comparison with a higher-metallicity environment, the Galactic sample of the photometric H survey by McSwain & Gies (2005) was used.
Results. Among early spectral sub-types, Be stars are more frequent by a factor 3-5 in the SMC than in the Galaxy. The distribution with spectral type is similar in both galaxies, i.e. not strongly dependent on metallicity. The fraction of Be stars does not seem to vary with local star density. The Be phenomenon mainly sets in towards the end of the main-sequence evolution (this trend may be more pronounced in the SMC); but some Be stars already form with Be-star characteristics.
Conclusions. In all probability, the fractional critical angular rotation rate, , is one of the main parameters governing the occurrence of the Be phenomenon. If the Be character is only acquired during the course of evolution, the key circumstance is the evolution of , which not only is dependent on metallicity but differently so for different mass ranges.
Key Words.:
Stars: early-type – Stars: emission-line, Be – Stars: fundamental parameters – Stars: evolution – Galaxies: Magellanic Clouds – Astronomical data bases: Catalogs1 Introduction
The so-called Be phenomenon manifests itself through the single, intermittent, or permanent occurrence of emission lines in main-sequence stars with spectral types O through A. This line emission arises from rotationally supported disks formed from matter lost (often ejected) by the central star. An excellent introduction to the complex idiosyncrasies of Be stars is given by Porter & Rivinius (2003). While extremely rapid rotation is a necessary condition for the Be phenomenon, it is not clear whether it is also sufficient or which other conditions need to be fulfilled. There are reports suggesting that the Be phenomenon also depends on metallicity (Maeder et al. 1999) and evolutionary phase (e.g., Fabregat & Torrejón 2000; Martayan et al. 2007b). An obvious method to investigate the latter possibility is the study of open star clusters with a suitable range of ages. In the Galaxy, it has been applied various times but mostly using photometric techniques. A very good discussion of the subject and previous work can be found in McSwain & Gies (2005).
In the Small Magellanic Cloud (SMC), a major spectroscopic survey for emission-line objects was performed by Meyssonnier & Azzopardi (1993). Although it identified 1898 emission-line objects, the photographic nature of the data did not permit too many emission-line stars to be found near the main sequence or in crowded areas such as open clusters. This paper reports on the first digital slitless-spectroscopy survey of the SMC in search for Oe/Be/Ae stars (a second paper will concern the LMC). During its execution, some 3 million spectra were obtained.
2 Observations
The observations111Observations at the European Southern Observatory, Chile under project number 069.D-0275(A) were carried out (by JF) on September 25 and 26, 2002 with the Wide Field Imager (WFI) attached to the 2.2m MPG Telescope at ESO’s observatory on Cerro La Silla in Chile (see Baade et al. 1999). Due to bad weather, the second night was only partly useful.
In its slitless spectroscopic mode the WFI has a crudely circular field of view of diameter 0.31 degrees. The R50 grism yields a dispersion of 54 nm/mm or 0.811 nm/pixel. The nominal resolution at optimal focus and seeing is 5.1 nm at H. In order to reduce crowding and overlapping spectra, the length of the spectra was limited by means of a filter with a full width at half maximum of 7.4 nm centered on H. This means that spectra are acceptably separated if the stars are 2″ apart perpendicular to the dispersion direction and 6″ apart along this direction. These numbers vary slightly with the quality of the focus. But in general they do not require an adaptation of the parameters for the automatic extraction by software of the spectra.
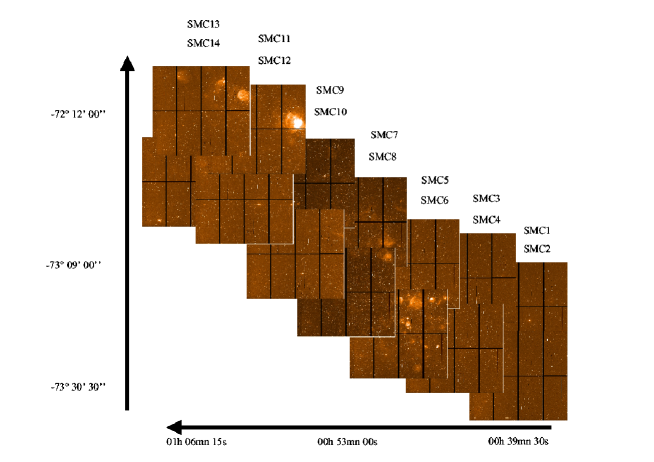
The exposure time per field was set to 600 s. The coverage of the SMC achieved with 14 telescope pointings is shown in Fig. 1.
For a similar study with the WFI but in the Galaxy and with a broader filter, see Martayan et al. (2008).
3 Data reduction, extraction of spectra, and identification of emission-line stars
 |
 |
 |
 |
3.1 Data reduction
The elementary CCD image processing was performed with IRAF222IRAF is distributed by the US National Optical Astronomy Observatory, which is operated by the Association of Universities for Research in Astronomy (AURA), Inc., under cooperative agreement with the US National Science Foundation tasks and the MSCRED package.
The subsequent extraction of the bias- and flat field-corrected spectra posed considerable technical challenges:
-
•
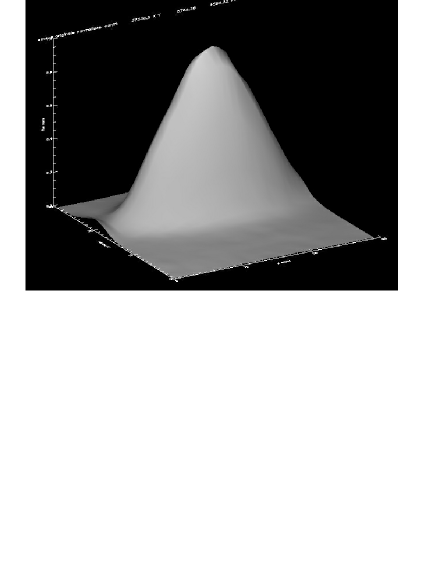
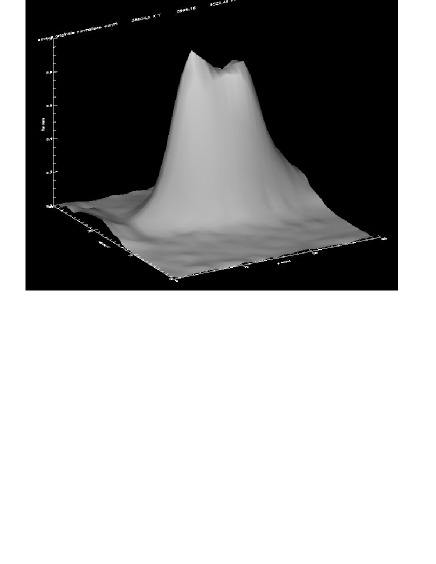
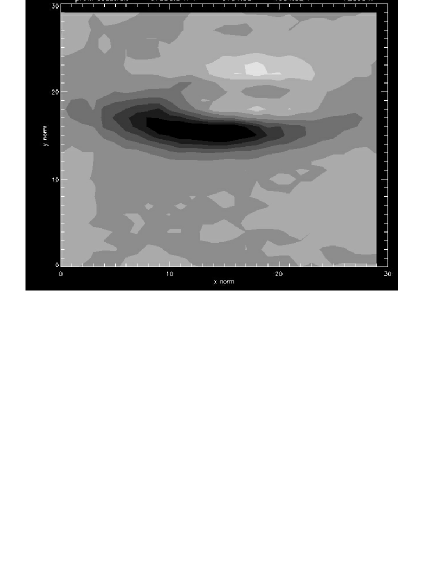
All images suffer from substantial and non-homogeneous defocus, which increases from the field center to the edges. The reasons could not be reconstructed. (However, special techniques permit continuum and emission-line objects to be distinguished at a fairly acceptable level of confidence, turning the problem almost into an advantage - see Fig. 2.)
-
•
Each object appears in several spectral orders. The 0th order is undispersed and corresponds to the point-spread function (PSF). The order suitable for the extraction of the H spectra is -1, which in the following will be referred to as “the spectrum”. In the case of bright stars, up to 7 or even 8 orders are visible, significantly increasing the probability of spectra being contaminated. While this implies the possible non-detection of some emission-line objects, it will not lead to false detections because even the 0th order has a very different PSF.
-
•
There are parasitic spectra resulting from scattered light from stars outside the direct field of view.
-
•
The position angle of the dispersion direction varies (by 5) from the center to the edges of the images.
In principle, spurious detections of emission-line objects may arise from particle events or hot pixels. However, their very different PSFs make such confusions rather unlikely. The extraction algorithm used tries to automatically reject particle hits. On the other hand, the completeness of the survey is reduced by spectra falling onto the gaps (amounting to 3.1 % in area) between the 4x2 CCDs of the WFI.
After careful, realistic tests with representative subsets of the data it was decided that it is not just most time effective but also still safe to let properly tuned software search for spectra automatically. For this task and the 2-D extraction of the spectra SExtractor (Bertin & Arnouts 1996) was employed with specially adapted convolution masks (E. Bertin, private communication). About 3 million spectra were extracted in the whole SMC (14 images, see Fig. 1), of which about 1 million are useful.
A comparison of such extracted spectra with spectra counted by eye suggests that the extraction efficiency in clusters is on average around 75 to 80%, depending on the area density of the stars. With position of the cluster in the WFI field, i.e. mainly the level of de-focus, this mean value may range from 60% to 100%.
Because of the need to work on samples with defined ages, only the areas of 83 clusters listed in the OGLE database (Udalski et al. 1998) and a number of neighboring comparison fields (14 fields, 1 or 2 per target field and with diameters of 2 to 4′, located close to the open clusters treated) were retained for the classification as stars with and without line emission. The open clusters selected in this way (from Pietrzynski & Udalski 1999) are compiled in Table 7; other parameters (total number of stars, number of emission-line stars, etc.) are included (where applicable, separately for multiple observations of a given cluster). This process led to a sample of 7,867 spectra to be examined for the presence of line emission.
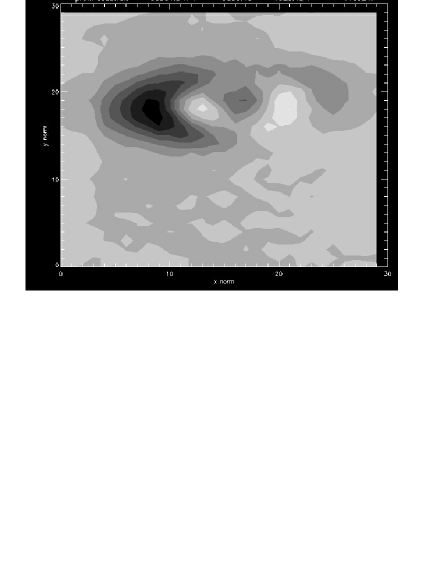
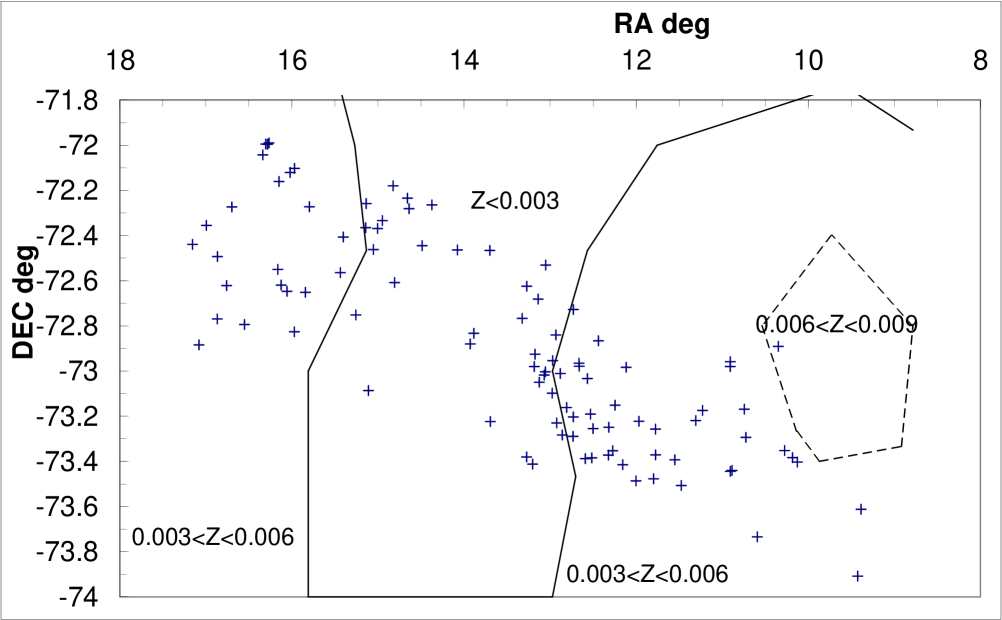
The WFI database includes an 84th open cluster: NGC 346, which is a complex young structure, probably consisting of a number of sub-aggregates. But OGLE photometry is not available for this dense field, which also suffers from extended nebular emission. Details are in Sect. A. Fig. 3 shows the distribution of studied open clusters in the SMC as well as the metallicity areas by Cioni et al. (2006). They confirm that the open clusters are in metallicity environment significantly lower than the Galactic one.
3.2 Identification of emission-line stars: the Album code
The exploratory tests alluded to above also showed that it would not be safe to let software distinguish without human supervision between stars with and without H line emission. However, the visual classification of several thousand spectra could be greatly facilitated by transforming them into an easy-to-classify format. To this effect, the Album package was written (in IDL).
Album starts out from the assumption that the 2-D PSF is only slowly varying with position in the frame. To compute the latter, typically 50-250 spectra were registered (by cross correlation), co-added, and normalized. This step is operator-supervised; ill-suited stars can be rejected. In the first step, all obvious emission-line stars, apparent binaries, too closely spaced sources, spectra with severe particle hits or otherwise reduced quality are rejected and a new regional mean spectrum is computed. It was empiricially established that the inclusion, at the 5% level, of emission-line objects only insignificantly modifies the regional mean spectrum profile. The resulting regional template spectrum was subtracted (after cross correlation and shift) from each normalized 2-D spectrum (see Fig. 2-left) to be checked for H line emission. Album also rejects automatically artifacts such as ghosts or particle events by applying a suite of tests to the shapes of the spectra.
In the case of emission-line stars, the 2-D spectra show a secondary peak (see Fig. 2). But after subtraction of the mean PSF the resulting difference images display a more characteristic and conspicuous ring-like structure. This is due to the large defocus, which affects the at most marginally resolved line emission like a point source. Therefore, while the continuum flux is just blurred by the defocus, the line emission takes on roughly the shape of a donut or horseshoe (i.e. the telescope pupil).
In a properly prepared and homogeneous album (hence the name Album) of images, this peculiar structure is conveniently and more readily and reliably recognized by the human eye than by software developed with the same amount of effort.
Using this scheme, all stars were classified into three categories: definite emission-line stars, candidate emission-line stars, and stars without H line emission. An emission-line star is considered definite, if its flux distribution shows a significant secondary peak (cf. Fig. 2) at a position consistent with H. Obviously, this depends on the signal-to-noise ratio but also on the location within the frame and the associated defocus. If the purity of this signature is potentially diluted by particle events or noise spikes, the object is called a candidate emission-line star. For example, for relatively bright objects from V=14 to 17, 100 to 80 % of the emission-line stars found are classified as definite emission-line stars. However, towards lower brightness and lower signal-to-noise ratio, the fraction of definite emission-line stars drops from 55 to 13 %.
3.3 Efficiency of H emission detection
In order to determine the thresholds for the detection of H emission, Album was applied to WFI observations of the open cluster NGC 330 and its well-studied population of Be stars. With the help of SIMBAD the previously known Be stars and the ones found by Album were compared, and the H equivalent widths and line strengths were taken from Hummel et al. (1999, 2001); Martayan et al. (2007a), similar to the WFI observations of NGC 6611 by Martayan et al. (2008). The results are shown in Figure 4 for the detection efficiency in terms of H line emission equivalent width (top) and strength (bottom). The Album-based procedure found slightly less than 80% of the Be stars known in NGC 330.
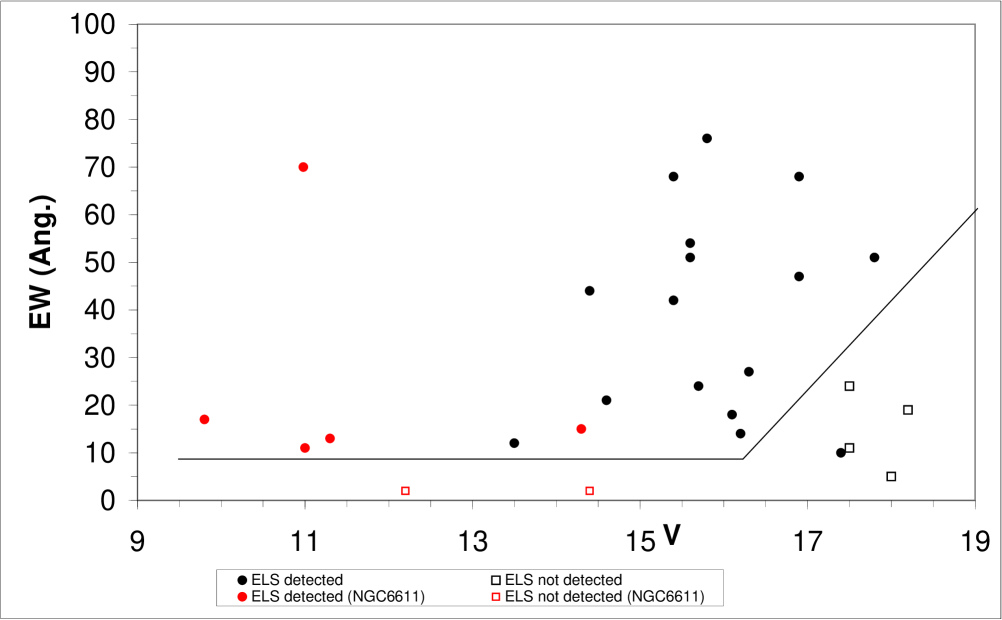
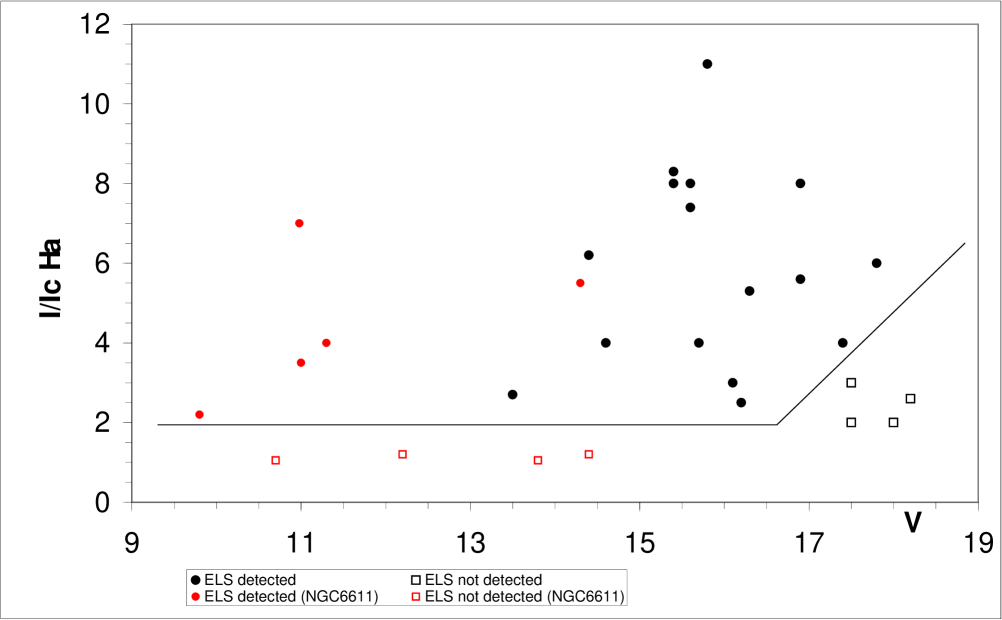
Fig. 4 suggests that our SMC survey technique detects H line emission, when the equivalent width is higher than 10 Å or the peak intensity is more than twice the one of the underlying continuum, down to V 16.5-17 mag, which corresponds to spectral types later than B2-B3 (see Martayan et al. 2007b). Note that, contrary to the conventional definition, positive values indicate a net line emission. For fainter stars, the signal-to-noise ratio is lower and the detection thresholds increase.
A further check is provided by the following: Martayan et al. (2007b) observed 31 WFI stars preselected from the emission-line stars found with the WFI in the field of NGC 330. At a spectral resolving power of 8,600 with the VLT, all of the 31 emission-line stars were confirmed as true H emission-line objects, 28 of which could be classified as Be stars. The remaining 3 turned out to be of a different nature (compact planetary nebulae, supergiants, B[e] or Herbig B[e] stars).
The case of NGC 330 is also useful to guess the false-alarm probablity, which evidently is low. For a more precise constraint, one would need to have a control sample with B/Be classifications that are true at the time of the WFI observations. This does not exist, and some instrument-independent uncertainty is introduced by the comparison of observations made in different years because the Oe/Be/Ae characteristics of a star are (sometimes: highly) time dependent and not seldom only intermittently present.
4 Astrometry, photometry, and spectral classification
For the detected emission-line stars to be put into an evolutionary context, intrinsic colours and magnitudes are needed. In the following subsections, they are derived separately for the WFI emission-line stars in the SMC and for a comparison data set in the Galaxy.
4.1 WFI SMC data
As the largest homogeneous source of photometry in SMC clusters we chose OGLE (Udalski et al. 1998). The first step for the cross-identification is astrometry.
4.1.1 Astrometry and correlation with OGLE
The ASTROM package (Wallace & Gray 2003) was applied to the extracted spectra of the -1st order. Per WFI image, 30 to 80 astrometric reference stars from the GSC2.2 and/or UCAC2, USNO catalogues were utilized. In this way, the coordinates of the 7,867 SMC stars mentioned in Sect. 3.1 (plus 55 in NGC 346) were determined with an accuracy of 0.5-1. Cross-correlating these WFI positions with the OGLE catalogues Udalski et al. (1998) revealed a systematic global offset of in right ascension and in declination. In order to maximize the probability of identifying the WFI emission-line stars in OGLE, these shifts were applied for the extraction of the photometric data from OGLE (note that the WFI coordinates provided in this paper do not include these offsets).
For each cluster, any multiple observations and identifications were merged into one per star. Table 8 provides a summary of the results for each cluster. On average, 73.7% of all WFI stars and 79.7% of the WFI emission-line stars were found in OGLE. The incompleteness is explained mostly on the part of OGLE, which is undercomplete in crowded areas (i.e., clusters) and in the presence of extended nebulosities. But imperfect WFI coordinates also add their share. Note also that only about 80% of the 3 square degrees of this WFI survey are covered by OGLE II. This especially affects large complexes like the one of NGC 346.
4.1.2 Photometric spectral classification
The resulting apparent colours and magnitudes need to be converted to absolute ones, and absolute luminosities and spectral types need to be derived so that inter-cluster comparisons within the SMC but also between SMC and Galaxy become possible. V0, (B-V)0, (V-I)0 were derived by means of the per-cluster EB-V reddenings from Pietrzynski & Udalski (1999). The absolute of each star was calculated from the resulting V0 and the SMC distance modulus provided by Udalski (2000). That is, for all clusters the same effective distance was adopted.
Using the HR diagramme in Fig. 5, the following
regions were assumed to delineate the main sequence:
O stars: and (B-V)0+0.1 and
(V-I)0+0.3
B stars: MV and (B-V)0+0.1
and (V-I)0+0.2
A stars: 0.43 and (B-V)0+0.25 and
(V-I)0+0.25.
Individual spectral types were assigned by applying the calibration of
Lang (1992) and Wisniewski & Bjorkman (2006, and references therein) as
shown in Table 1 and Fig. 5. The break-down of the full sample by spectral
types and emission-line characteristics is given in
Table 2.
Apart from the global uncertainties of spectral types derived from photometry, differential reddening across a cluster and erroneous membership assignments will introduce individual errors. However, they will only dilute but not probably falsify general trends derived from the database at large.
Sect. A.3 compares for 12 stars in NGC 346 spectral types derived as described above and spectroscopic classifcations from the literature. The average difference only amounts to 1 spectral sub-type.
| ST | Mv Range | ST | Mv Range |
|---|---|---|---|
| Hot O | -6.0 | B6 | [-0.6; -0.25[ |
| O3 | [-6.0; -5.9[ | B7 | [-0.25; 0.025[ |
| O4 | [-5.9; -5.7[ | B8 | [0.025; 0.285[ |
| O5 | [-5.7; -5.5[ | B9 | [0.285; 0.43] |
| O6 | [-5.5; -5.2[ | A0 | ]0.43; 1.0[ |
| O7 | [-5.2; -4.9[ | A1 | [1.0; 1.3[ |
| O8 | [-4.9; -4.5[ | A2 | [1.3; 1.5[ |
| O9 | [-4.5; -4.2[ | A3-A4 | [1.5; 1.95[ |
| B0 | [-4.2; -3.25[ | A5-A6 | [1.95; 2.2[ |
| B1 | [-3.25; -2.55[ | A7 | [2.2; 2.4[ |
| B2 | [-2.55; -1.8[ | A8-A9 | [2.4; 2.55[ |
| B3 | [-1.8; -1.4[ | F0-F1 | [2.55; 3.6[ |
| B4 | [-1.4; -0.95[ | cool F | 3.6 |
| B5 | [-0.95; -0.6[ |
The results of the photometric and spectral classification and much additional information are compiled in a number of tables. For basic data of Be stars and their absolute photometric data and spectral types, see Tables 9 and 10, respectively. For mere candidate-Be stars, Tables 11 and 12 are the equivalents. Tables 13 and 14 concern Oe and Ae stars. Emission-line objects well outside the main sequence are covered in Tables 15 and 16. Table C compiles all WFI-based data (coordinates, etc.) for emission-line stars without counter part in the OGLE catalogues (Udalski et al. 1998). Where applicable, the tables also contain information extracted from SIMBAD within a search radius of 2 ″about each emission-line star. Because of the high density of objects especially in the cluster cores, this information will inevitably suffer from misidentifications.
Similar tables for the 3,792 SMC non-emission line stars are available on request.
4.2 Comparison data for the Galaxy
The most recent and comprehensive photometric survey for Be stars in Galactic clusters is the one by McSwain & Gies (2005). It comprises 52 definite Be stars and 116 Be candidates in 48 of the 54 clusters studied. Using data from McSwain et al. (2008), we estimate that the detection limit for H line emission in that sample is 7 Å, similar to the one of our spectroscopic study in the SMC.
McSwain & Gies (2005) published the Stroemgren parameters y, (b-y), E(b-y) but not m1. For a comparison with the SMC sample, the conversion to the Johnson UBV system was performed as follows:
-
–
First, (B-V) was derived from the relation Warren & Hesser (1977): (B-V)=1.668(b-y)-0.030
- –
-
–
Third, E[B-V] results from E[B-V]=E[b-y]/0.745, where E[b-y] is taken from McSwain & Gies (2005).
-
–
Fourth, V0 follows from V0=V-3.1E[B-V].
-
–
Fifth, absolute magnitudes, MV, were calculated from MV=V0-, using the distance moduli, , given by McSwain & Gies (2005) for each cluster.
-
–
Sixth, (B-V)0=(B-V)-E[B-V].
From this point on, spectral types of main-sequence stars were derived in the same way as for the WFI SMC sample (Sect. 4.1.2).
| Type | Number | Number |
|---|---|---|
| (SMC) | (Galaxy) | |
| Open clusters | 84 | 54 |
| O | 25 | 13 |
| Oe+Oe? | 6 | 3 |
| B | 1384 | 1741 |
| Be | 109 | 52 |
| Be? | 54 | 116 |
| A | 250 | 495 |
| Ae+Ae? | 7 | 57 |
| Other non-ELS | 2408 | 17845 |
| ELS outside main sequence | 90 | |
| Unclassified ELS | 49 | |
| NGC 346 (Be, HBe, WR, etc) | 55 | |
| Total | 4437 | 20322 |
5 Results and discussion
 |
 |
5.1 Topology of global HR diagrams
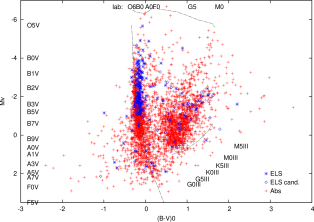
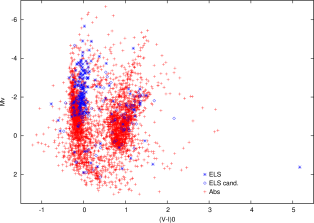
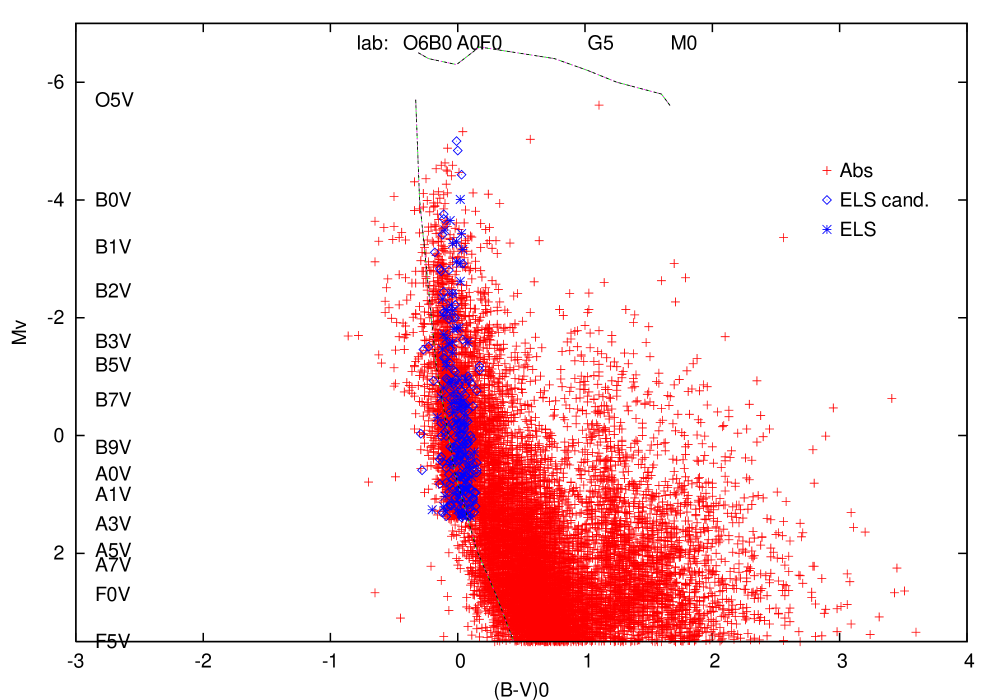
Reddening-free colour-magnitude diagrams incorporating all WFI stars in SMC clusters are shown in Fig. 5. Emission-line stars are found on, or close to, the main sequence, the red giant branch, and the asymptotic giant branch. As expected from Fig. 4, the number of stars seems to become visibly incomplete below mag (corresponding to ).
The emission-line stars near the main sequence are mainly Be stars. While their spread in colour is not larger than the one of the apparent zero-age main sequence they are significantly displaced towards redder colours. This topology is discussed in more detail in Sect. 5.2.
5.2 Colour excesses of emission-line stars
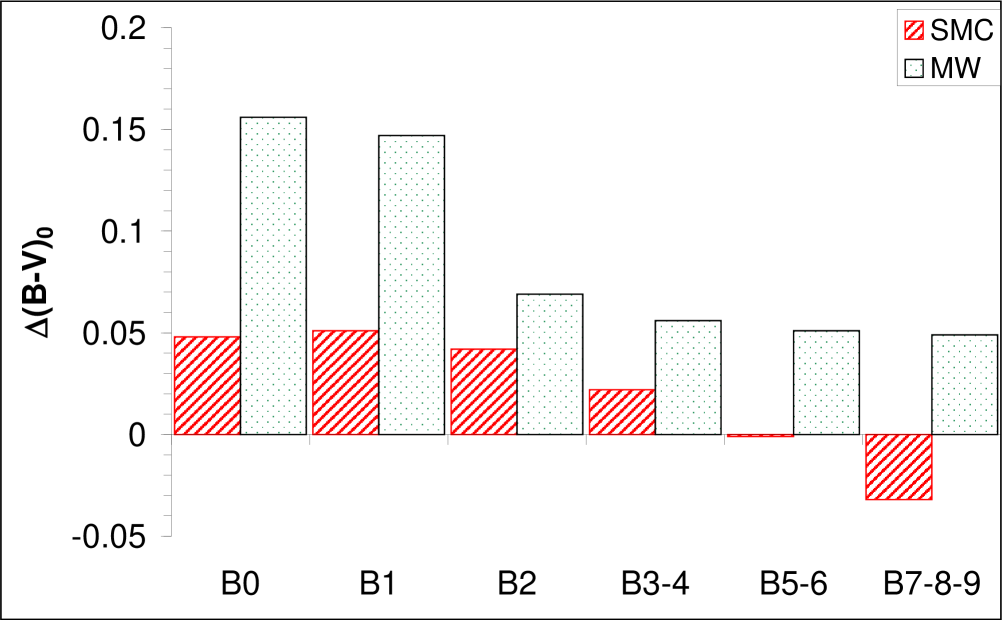
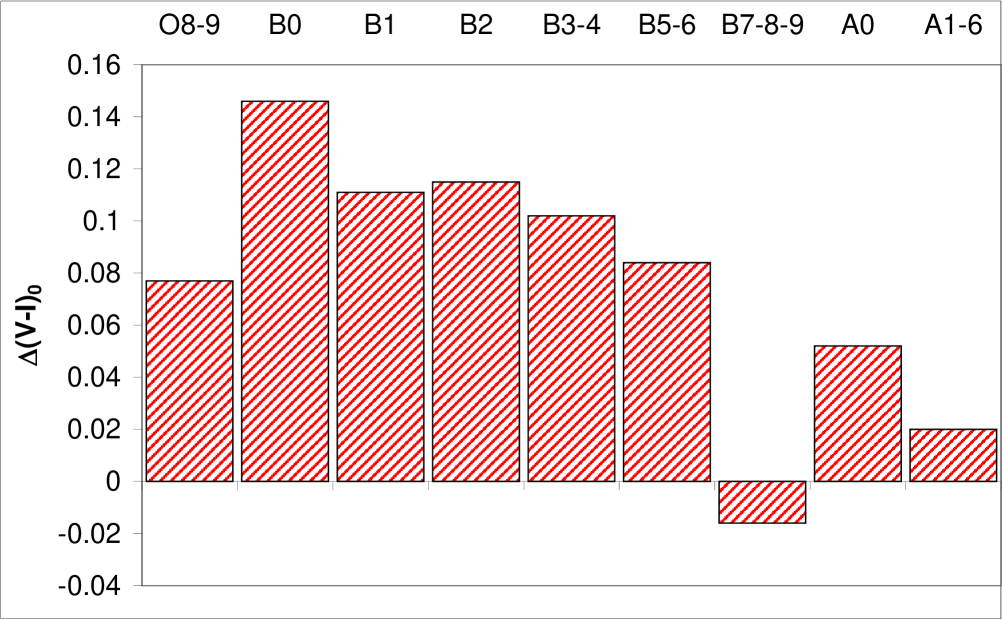
Table 3 collects the mean colour offset per spectral sub-type between emission and non-emission line stars (separately for SMC and Galaxy). Not only are emission-line stars redder than non-emission lines stars but they possibly even delineate a separate red sequence. This is already on average more prominent in than in but some individual stars deviate much more strongly in than in . In , the Galactic Be stars seem to differ more strongly from the normal main sequence than in the SMC. Since for early-type stars the colour-magnitude diagrams are degenerate in colour, nothing can be said about any systematic differences in luminosity.
The excess reddening seems to reach a maximum around spectral types B0-B2 in both SMC and Galaxy. Figs. 7 and 8 illustrate the reddening excess between emission and non-emission line stars in and in the SMC and Galaxy. Similar segregations of Be and normal B stars were also found by Keller et al. (1999). This could be due to one or more of stellar evolution, light scattering in the circumstellar disk (Dachs et al. 1988), and gravitational darkening linked to the fast rotation of Be stars (Frémat et al. 2005). Of these, evolutionary differences are the least likely since the comparisons are made for stars in the same open clusters and for similar spectral type. (The evolutionary status is discussed in more detail in Sect. 5.6.)
This leaves fast rotation and circumstellar disks as candidate explanations of the extra reddening in Be stars: At low metallicity (SMC), Be stars seem to rotate faster than at high metallicity (Martayan et al. 2007b), so it is expected that the fast-rotation effects are larger in the SMC than in the Galaxy. In theory (Maeder & Meynet 2001), this is partly compensated by the radii of low-metallicity stars being smaller by 15 to 20 % which can affect the luminosity of the stars. On the other hand, work by Trundle et al. (2007) and Evans et al. (2008), indicates that, in the SMC, the class V stars of a given spectral sub-type are hotter than their counterparts in the Galaxy. But their luminosity is about the same: for B0V, LSMC/LMW=0.9; for B1V LSMC/LMW=1.01; for B2V LSMC/LMW=1.04.
Circumstellar disks of Be stars have been reported (Wisniewski & Bjorkman 2006; Wisniewski et al. 2007a; Martayan et al. 2007a) to be closer to the central star at lower metallicity so that the circumstellar extinction towards low-inclination Be stars would be increased. But, as explained above, the radii of the stars are smaller, thereby partly offsetting the claimed difference in geometry.
| ST | Mv | (B-V)0 | (B-V)0 | (V-I)0 | (V-I)0 | N | Galaxy (B-V)0 | Galaxy (B-V)0 | |
|---|---|---|---|---|---|---|---|---|---|
| O8-O9 | -4.522 | -0.123 | -0.063 | 16 | -0.227 | ||||
| O8-O9e | -4.638 | -0.098 | 0.025 | 0.014 | 0.077 | 5 | |||
| B0 | -3.569 | -0.190 | -0.154 | 49 | -0.286 | ||||
| B0e | -3.569 | -0.142 | 0.048 | -0.008 | 0.146 | 27 | -0.130 | 0.156 | |
| B1 | -2.781 | -0.211 | -0.177 | 90 | -0.238 | ||||
| B1e | -2.799 | -0.160 | 0.051 | -0.066 | 0.111 | 37 | -0.091 | 0.147 | |
| B2 | -1.947 | -0.190 | -0.184 | 258 | -0.238 | ||||
| B2e | -1.934 | -0.148 | 0.042 | -0.069 | 0.115 | 56 | -0.169 | 0.069 | |
| B3-4 | -1.381 | -0.174 | -0.162 | 236 | -0.209 | ||||
| B3-4e | -1.414 | -0.152 | 0.022 | -0.060 | 0.102 | 22 | -0.153 | 0.056 | |
| B5-6 | -0.916 | -0.156 | -0.144 | 386 | -0.194 | ||||
| B5-6e | -1.050 | -0.157 | -0.001 | -0.060 | 0.084 | 19 | -0.143 | 0.051 | |
| B7-8-9 | -0.193 | -0.132 | -0.114 | 365 | -0.153 | ||||
| B7-8-9e | -0.490 | -0.164 | -0.032 | -0.130 | -0.016 | 2 | -0.104 | -0.049 | |
| A0 | 0.718 | -0.062 | -0.088 | 116 | -0.124 | ||||
| A0e | 0.820 | -0.155 | 0.093 | -0.036 | 0.052 | 3 | -0.076 | 0.048 | |
| A1–6 | 1.432 | -0.011 | -0.034 | 129 | -0.103 | ||||
| A1–6e | 1.596 | -0.014 | 0.003 | -0.014 | 0.020 | 4 | -0.165: | -0.062 |
5.3 Frequency of Be stars as a function of local star density
Various studies in the Galaxy (for example Keller 2004) suggest that the rotational velocities of B stars are higher in open clusters than in the field. By contrast, investigations in the LMC and SMC using statistical tests (Martayan et al. 2006, 2007b) did not find significantly different rotational velocities in clusters and the field. In the Galaxy, Huang & Gies (2006) found more slow rotators in the field than in open clusters. They also concluded that the more massive B stars spin down during their main sequence phase and suggested that some of the rapid rotators found may have been spun up by mass-transfer in close binary systems. These authors ascribe the difference between open clusters and fields to a difference in the evolutionary phase of the stars (the older, the slower are the stars).
The same difference is attributed by Wolff et al. (2007) to the difference in number density. They argue that stars in low-density environments could retain their pre-main sequence disk for a longer time. Star-disk locking would, then, preserve the angular speed so that such stars cannot become young fast rotators.
However, the clusters studied are mainly young ones, among them NGC 6611. Martayan et al. (2008) have shown that in this cluster some early-type objects are still on the pre-main sequence. They also found that the rotational velocities of these two kinds of objects differ by about 20%, with ZAMS stars rotating more slowly. The theoretical models from Meynet & Maeder (2000) explain this decrease by an internal redistribution of the angular momentum at the ZAMS.
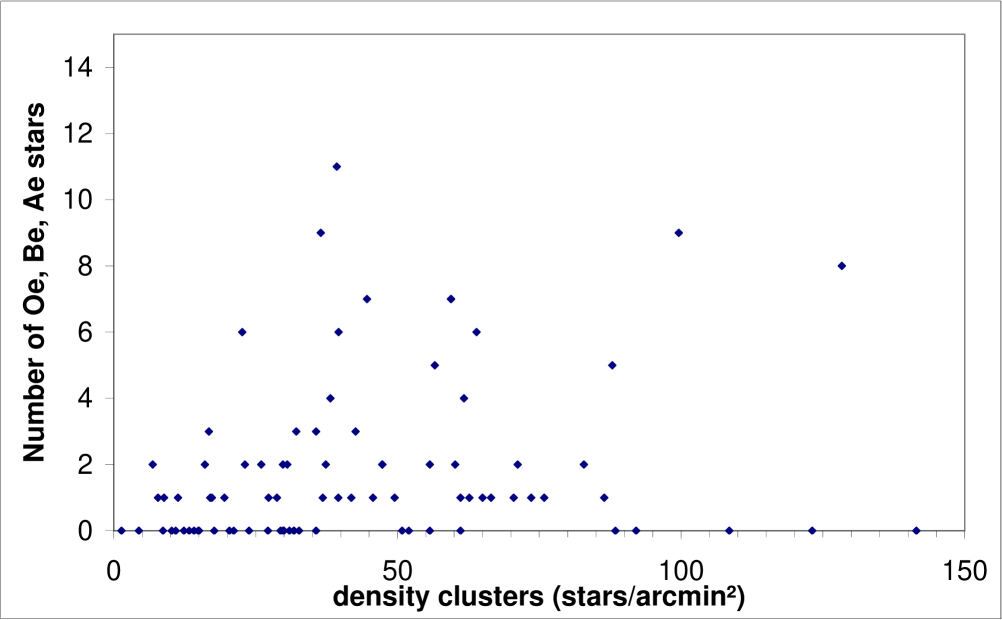
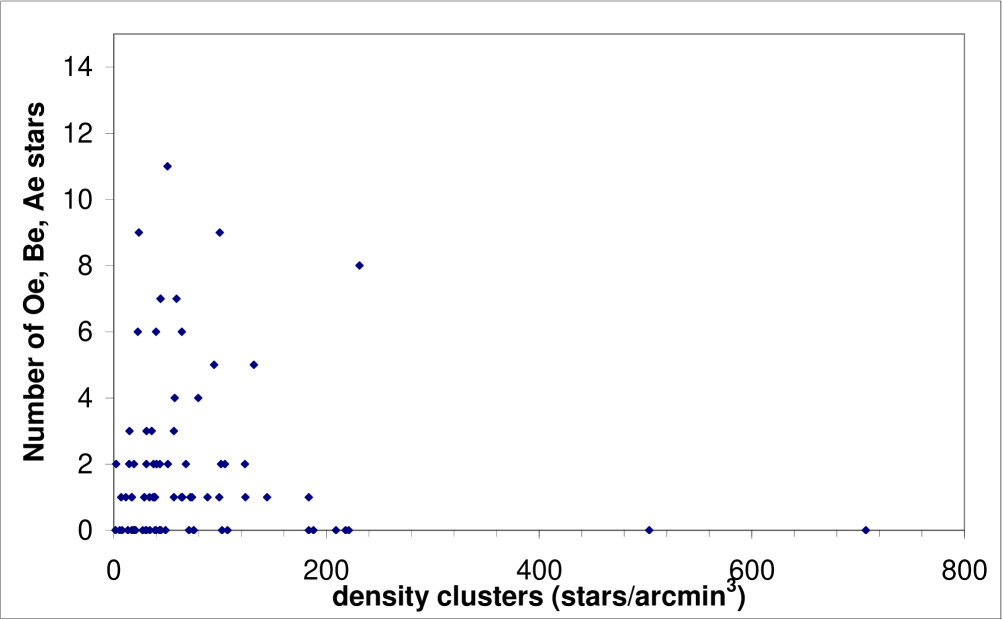
If a difference between the rotational velocity of cluster and field stars is not due to biased sampling of evolutionary effects but related to local stellar density, the expected frequency of Be stars should be higher in open clusters than in the field at large and also higher in higher-density fields. The WFI SMC database permits such a comparison to be made. This hypothesis will be checked in a following paper dealing with SMC field stars. Accordingly, the star surface and space density of each open cluster in the sample was calculated and compared to its contents of main-sequence emission-line stars (Oe, Be, Ae). No correlation became evident (Fig. 9), in agreement with the findings of McSwain & Gies (2005) for Galactic clusters.
5.4 The Be phenomenon: SMC vs. Galaxy
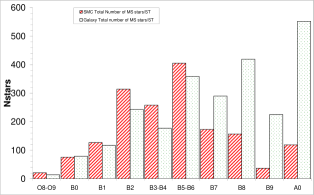
In both galaxies, the fraction of near-main sequence Be stars varies drastically from one open cluster to the other but there is not even the beginning of an explanation of this very conspicuous (and well-known) fact. In order not to be misled by such small-number instabilities, all WFI SMC and all Galactic emission-line stars were combined to one sample each. The completeness with spectral type of these samples can be inferred from Fig. 10, which confirms that the SMC sample is incomplete towards fainter stars, i.e. later B sub-types, whereas in the Galaxy the increase toward later subtypes basically follows the Initial Mass Function (IMF).
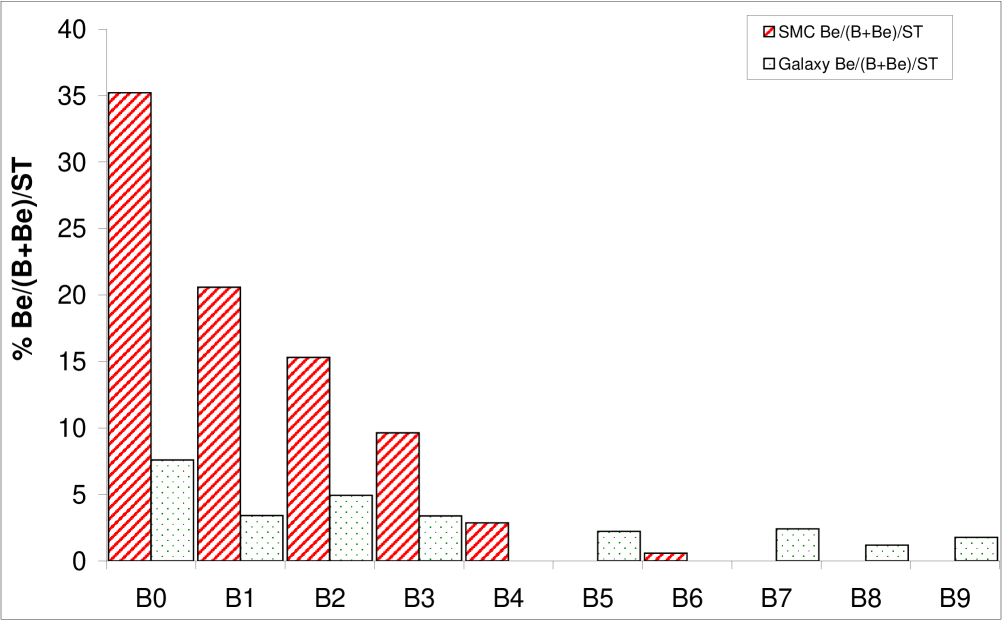
The global fractions of main-sequence Oe/Be/Ae stars per spectral sub-class are provided in Table 4. As Fig. 11 illustrates, the distributions have similar overall shapes. But with fractions reaching nearly 35%, early-type Be stars are more abundant in the SMC than in the Galaxy by a factor of 3-5. This factor drops to 2-4 if the very populous cluster NGC 330 is removed from the sample so that the overfrequency of Be stars among early spectral subtypes is robust. The recent slitless study of Mathew et al. (2008) reports similar Be-to-B star ratios in Galactic clusters as McSwain & Gies (2005) do.
Note that these three studies may be compared because they are all single-epoch studies. Since the Be phenomenon is transient, the true frequency of Be stars must be higher than apparent from such surveys. The study by Fabregat (2003) suggests that up to one-third of all Be stars may be missed at any one epoch. Studying the Galactic cluster NGC 3766, McSwain et al. (2008) even suggest that 25 to 50 % of the Be stars could be missed in a single-epoch spectroscopic survey. This is, of course, very much dependent on the nature and quality of the data. Note that is not known whether the volatily of emission lines is different in Galaxy and SMC. In the Galactic field, the variability of classical Be stars is significantly higher among the early spectral subtypes, to which the present study is limited.
The inclusion of candidate Be stars (Table 4) does not much affect the distribution function in the SMC. However, for the Galactic late-type candidate-Be stars from McSwain & Gies (2005) there is a large increase. It is conceivably due to the difficulty of photometrically distinguishing pre-main sequence or Herbig Ae/Be stars from classical Be stars. The more frequent occurrence of these stars in young open clusters supports this interpretation.
| Spectral type | SMC | SMC % | Galaxy |
|---|---|---|---|
| % | without NGC 330 | % | |
| O8-O9e | 23.8 | 20.8 | 14.3 |
| B0e | 35.2 | 26.3 | 7.6 |
| all B0e | 36.1 | 12.7 | |
| B1e | 20.6 | 16.7 | 3.4 |
| all B1e | 27.0 | 7.7 | |
| B2e | 15.3 | 13.9 | 4.9 |
| all B2e | 19.9 | 7.8 | |
| B3e | 9.6 | 8.9 | 3.4 |
| all B3e | 14.0 | 6.8 | |
| B4e | 2.9 | 3.0 | 0.0 |
| all B4e | 7.6 | 0.0 | |
| B5e | 0.0 | 0.0 | 2.2 |
| all B5e | 1.8 | 9.2 | |
| B6e | 0.6 | 0.6 | 0.0 |
| all B6e | 1.2 | 0.0 | |
| B7e | 0.0 | 0.0 | 2.4 |
| all B7e | 0.0 | 7.2 | |
| B8e | 0.0 | 0.0 | 1.2 |
| all B8e | 0.0 | 9.3 | |
| B9e | 0.0 | 0.0 | 1.8 |
| all B9e | 0.0 | 11.1 | |
| A0e | 2.5 | 2.5 | 0.9 |
5.5 The Be phenomenon as a function of spectral type
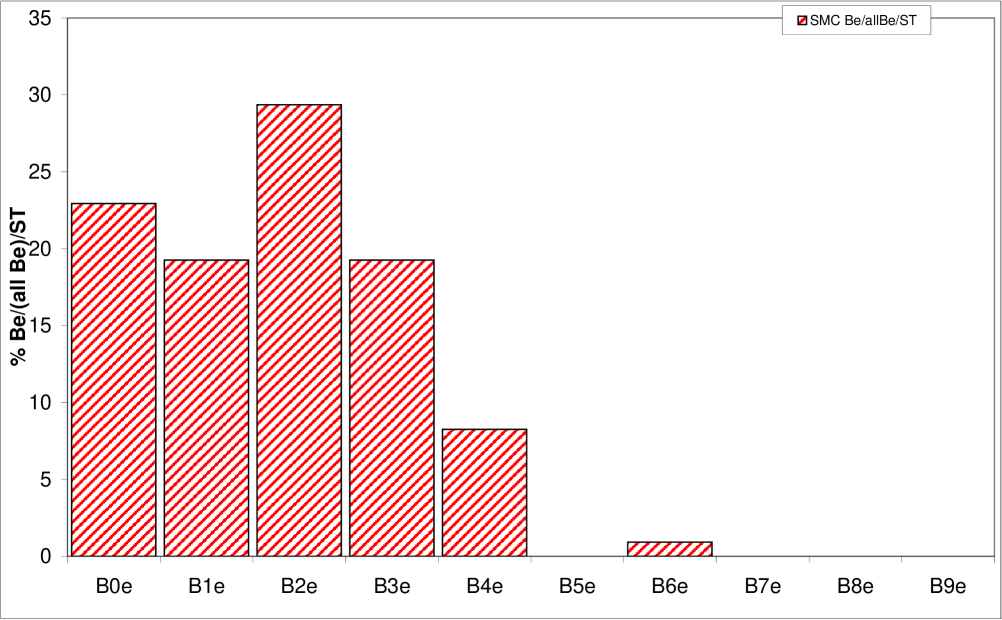
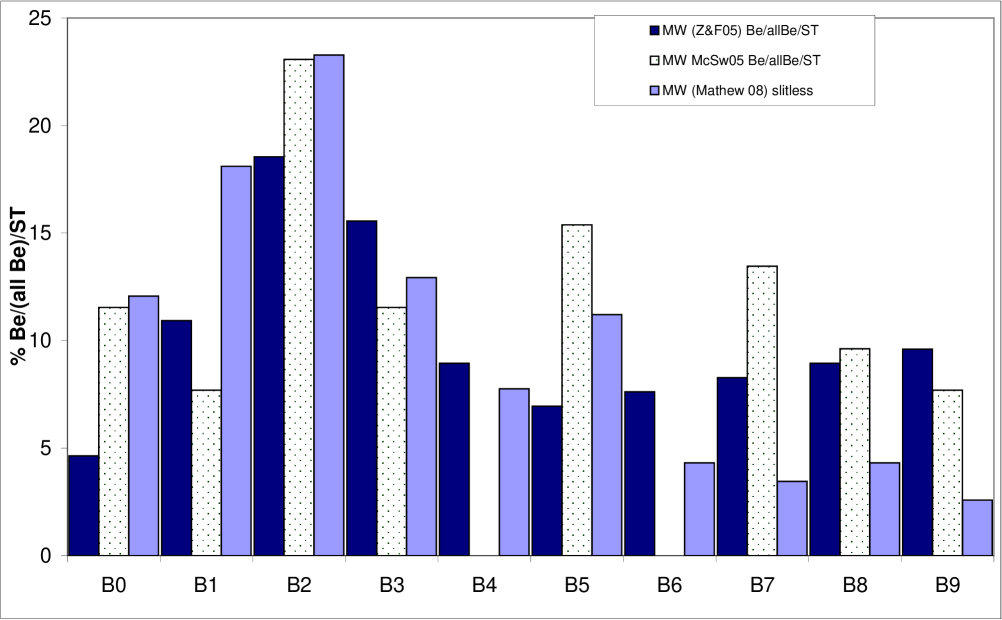
Fig. 12 presents the percentages per spectral sub-class, referred to the total sample of Be stars, but separately for SMC and Galaxy. The Galactic data are from Zorec & Frémat (2005), McSwain & Gies (2005), and Mathew et al. (2008). The distributions for the two galaxies are similar but the inclompleteness of the SMC data becomes rather apparent beyond B2 (cf. Sect. 3.3) and prevents a more detailed comparison. The highest number of Be stars is encountered at spectral type B2 in both SMC and Galaxy. Because this coincides with the maximum of the H emission-line strength (Zorec et al. 2007) while for lower line strengths the statistics are increasingly incomplete, it is questionable whether Fig. 12 reveals the real dependency of the Be phenomenon on effective temperature. At late spectral sub-classes, the more complete Galactic data level off to a plateau as already shown by Kogure & Hirata (1982). As lined out by Zorec & Frémat (2005) and Zorec et al. (2007), this may be due to the combination of the decreasing relative frequency of Be stars and the absolute increase in the number of late B stars with the initial mass function.
Unlike in Fig. 11, the distribution in Fig. 12 does not drop very quickly with spectral type because the total number of Be stars per spectral bin is crudely constant to within a factor of 2-3. This is not true for B-type stars at large because the IMF lets their numbers increase rapidly towards lower temperatures.
5.6 Evolution and age
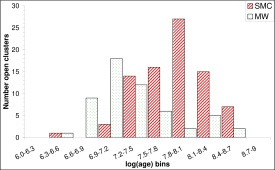
Fig. 13 shows the distributions in age of open clusters of the SMC (Pietrzynski & Udalski 1999) and Galactic samples. In the SMC sample, there are more old open clusters than in the Galactic one although the stellar population of the Galaxy at large is older than the one of the SMC.
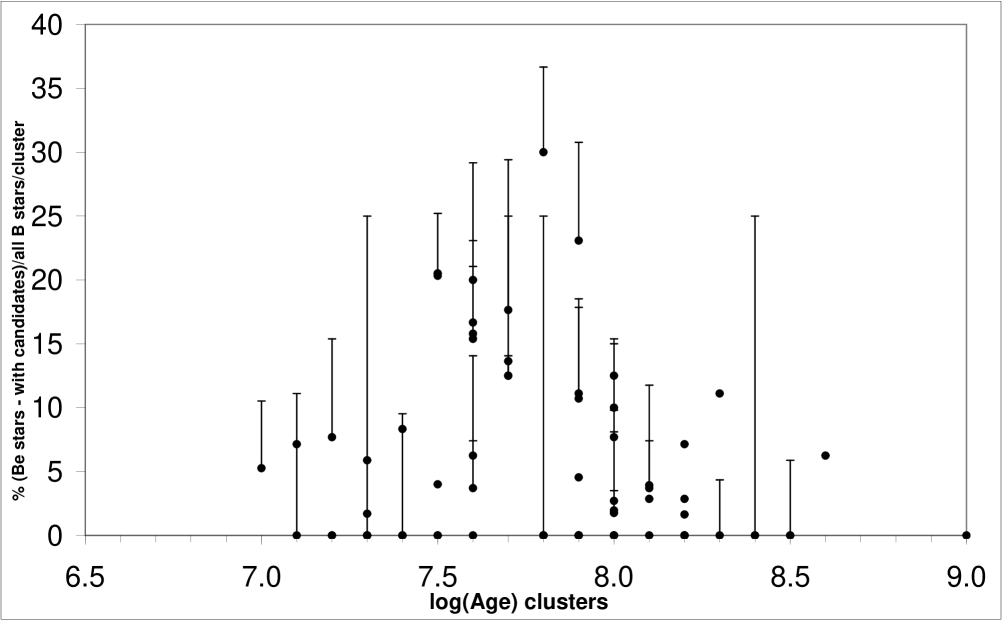
The number ratios of Be to B stars as a function of the age of open clusters in the SMC are shown in Fig. 14. For the Galaxy, see Fig. 4 of McSwain & Gies (2005). There is a maximum at log(age)7.6 in the SMC, while in the Galaxy no clear trend is seen. If taken at face value, there may be a small evolutionary enhancement of Be stars in the SMC. But a similar distribution may result already if the Be phenomenon peaks at a particular spectral sub-type.
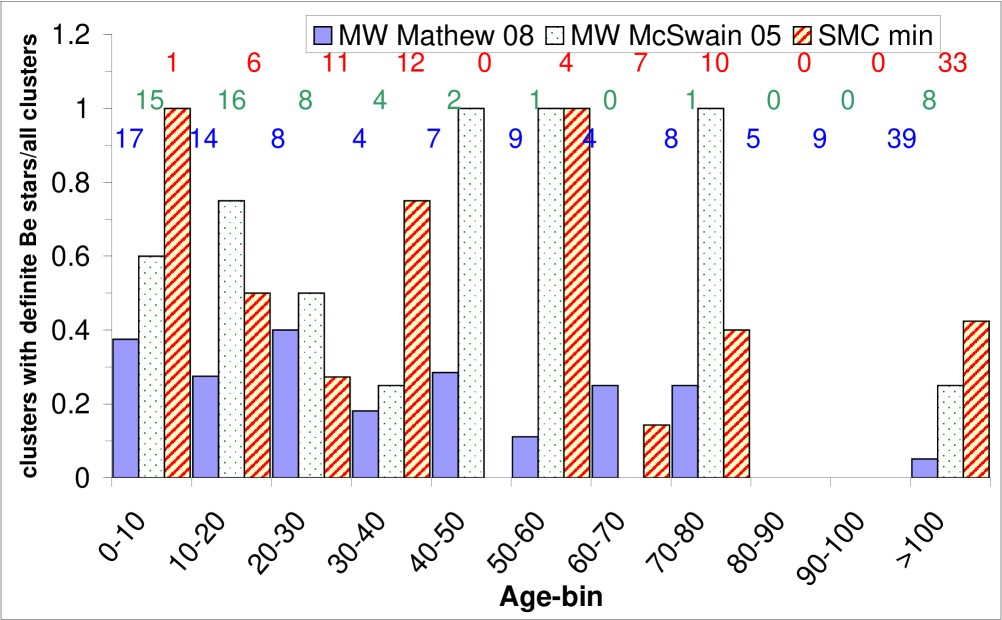
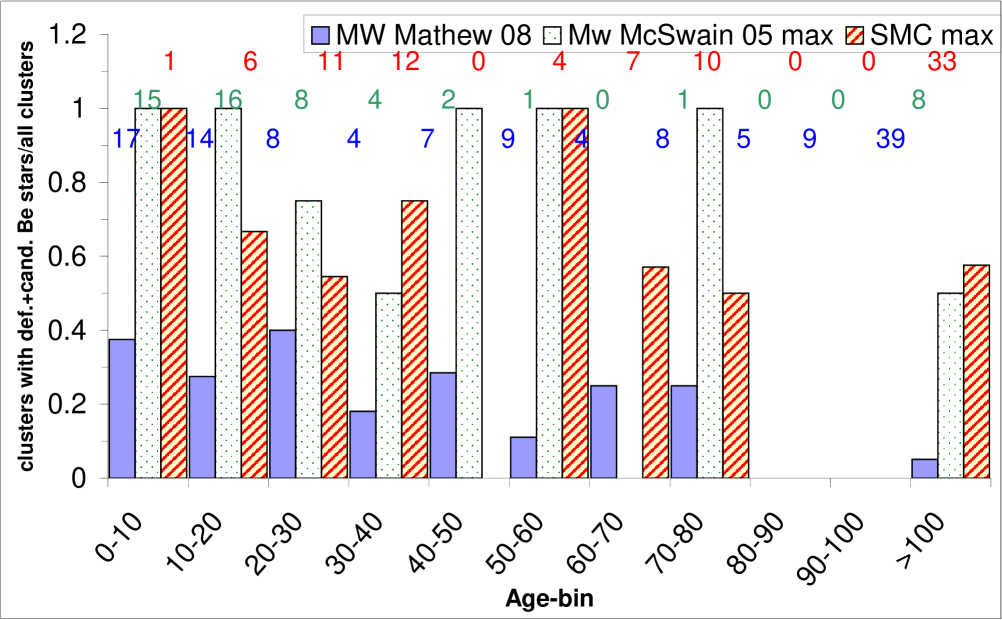
Similarly, Fig. 15 presents the ratios of open clusters with Be stars to all open clusters by age bins as defined by Mathew et al. (2008, their Fig. 8); the top panel is for definite Be stars, and the bottom panel combines definite and candidate Be stars. The comparison is made with data in the Galaxy from Mathew et al. (2008) and McSwain & Gies (2005). As noticed in the Galaxy by Mathew et al. (2008), there seems to be a first decrease of the number of open clusters with Be stars towards 30-40 Myears (log(age)=7.5-7.6). Thereafter there is an increase during the evolution, and another decrease after 50-60 Myears (log(age)=7.7-7.8). These 2 Figures (13 and 14) indicate that some Be stars could be born as Be stars (Wisniewski et al. 2007b), while others only assume Be characteristics during the evolution as mentioned by Fabregat & Torrejón (2000). The first decrease, if real (the differences between the studies are large), could be caused by Be stars reaching the terminal-age main sequence or by an evolutionary change of the angular velocities so that not every initial Be star can sustain a high enough surface rotation rate to remain a Be star throughout its entire main sequence life (Martayan et al. 2007b).
Moreover, for the Galaxy as well as low metallicity, respespectively, Meynet & Maeder (2000) and Maeder & Meynet (2001) showed that, while the linear rotational velocity decreases with time, the fractional critical angular velocity () increases. This holds for both medium and low-mass B-type stars over the range in metallicity studied and for massive B-O stars of low metallicity. But in massive Galactic-metallicity stars actually decreases with age due to the larger losses in mass and angular momentum.
From observations of Galactic Be stars with 70 %, Martayan et al. (2007b, Fig. 11) reckon that massive Be stars lose their emission-line characteristics after few million years, while late-type Be stars begin to appear at 40% of their main sequence lifetime or nearly 40 million years. This is the age, at which (Fig. 15) the fraction of open clusters with Be stars begins to rise again. For SMC-like metallicity, Martayan et al. (2007b, Fig. 11) predict that massive and intermediate-mass Be stars appear between 3 and 5 million years. At intermediate cluster ages, the fraction of clusters hosting Be stars decreases because this massive population disappears when it reaches the TAMS. Finally, at an age of about 35-45 million years and SMC metallicity, late-type Be stars start to occur. This expectation, based on the evolution of as a function of metallicity and mass, is qualitatively matched by the distribution in Fig. 15.
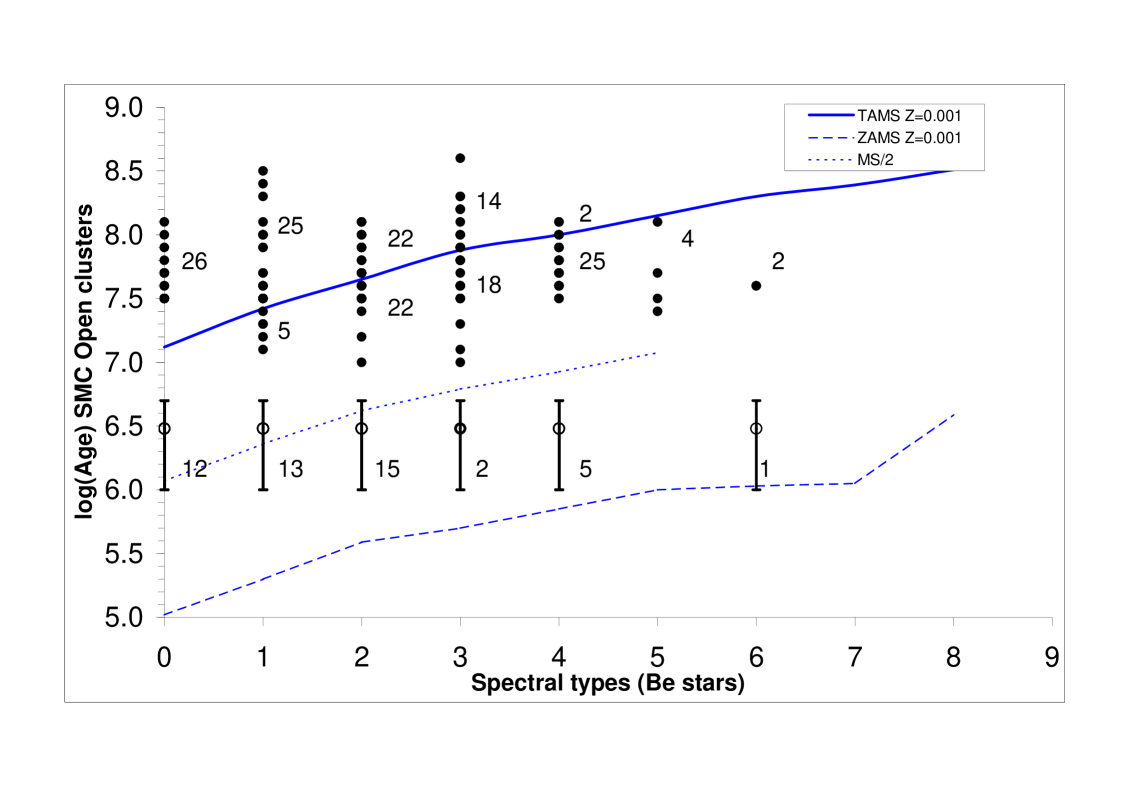
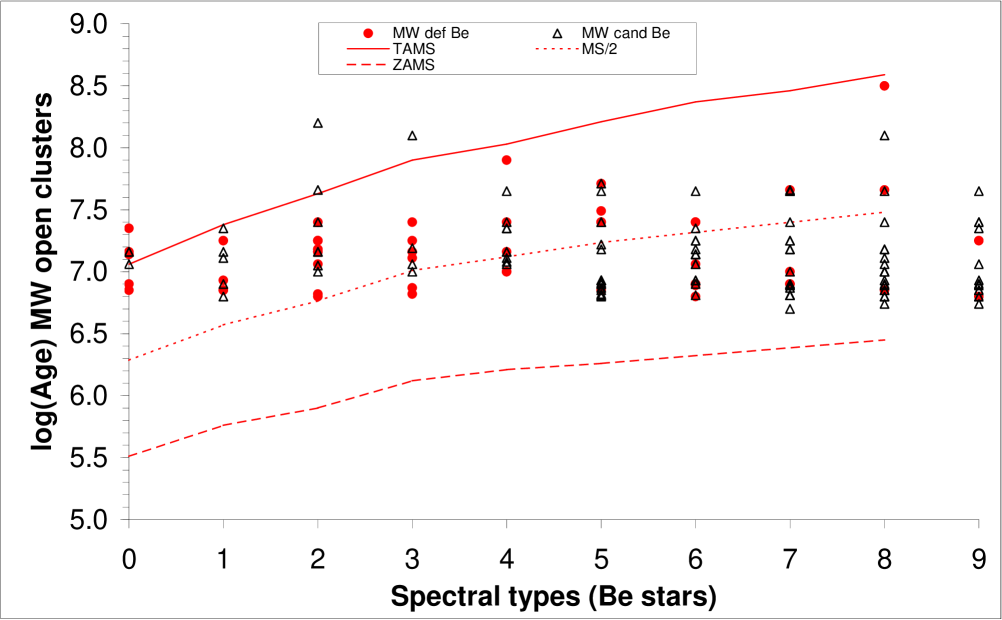
To investigate age dependencies further, Fig. 16 presents the range in log(age) of the host clusters as a function of spectral type (data from McSwain & Gies (2005); recall that the Be stars in the SMC were “selected as main sequence stars”). In the Galaxy, early-type Be stars are found close to the terminal-age main-sequence stars, intermediate-mass Be stars are mainly evolved, and definite late-Be stars are also evolved. The late-type candidate Be stars could be unevolved but there is a potential risk of confusion with pre-main sequence objects. Be stars seem to follow the evolutionary scheme described in Fabregat & Torrejón (2000), Zorec et al. (2005), and Martayan et al. (2007b), depending on their mass.
In the SMC, the OGLE ages (Pietrzynski & Udalski 1999) of some clusters are not really in agreement with their having very early-type stars (O-B0) as members. One example is Ogle-SMC72 with log(age)=7.6 0.2 and containing 3 B0e stars although B0 stars reach the terminal-age main-sequence already at log(t)=7.
On the other hand, Chiosi et al. (2006) derive log(age)=6.60.5 for this cluster, which is fully consistent with B0e member stars. There are differences between the ages from Pietrzynski & Udalski (1999) and from Chiosi et al. (2006) also for other open clusters in the WFI sample, which could explain some of the discrepancies between individual spectral types and parent-cluster ages. Even though in some specific clusters the ages published by Chiosi et al. (2006) are in better agreement with the presence of Be stars, this is not generally the case.
If all OGLE ages from Pietrzynski & Udalski (1999) are taken at face value, 55% of the Be stars, which were selected as main sequence stars, could be younger than their host clusters. With the ages from Chiosi et al. (2006), this value reaches 62%. As the published error estimates are lower for Pietrzynski & Udalski (1999), their estimates were adopted. If the problem is not due to the assigned ages or to the TAMS calibration, all possible explanations for blue stragglers (e.g., multi-epoch or continuous star formation, mass-transfer binaries, etc.) are potential candidates. This hypothesis could be reinforced by the finding that Be/X-ray binaries are more abundant in the SMC than in the Galaxy according to Haberl & Sasaki (2000), who explain this result by different star-formation histories of the two galaxies.
On the other hand, the color-magnitude diagrams in Sect. D and the location of blue stragglers as delineated by Ahumada & Lapasset (2007) suggest that at most few Be stars lie in the blue-straggler zone while most Be stars are actually on the red side of the cluster main sequences. As discussed in Sect. 5.2, this is probably unrelated to their age.
The other main sequence Be stars, located below the TAMS, are found evolved to the second part of the main sequence in agreement with the evolutionary picture sketched by Fabregat (2003) and Martayan et al. (2007b) for intermediate-mass Be stars in the SMC. The emission-line stars in NGC 346 could be classical Be stars but also pre-main sequence stars like Herbig Ae/Be stars. This would mostly affect the late spectral subtypes but at B0 some pre-main sequence stars are found as well (Nota et al. 2006).
Both in SMC and Galaxy, diagrams like Fig. 16 but for non-emission line B stars show a uniform distribution with age of the open clusters.
In the SMC, Be stars are mostly located in the region corresponding to the second half of the main sequence (except for some late-type stars in NGC 346 but they could be pre-main sequence stars), in agreement with the results of Fabregat & Torrejón (2000) and Martayan et al. (2007b). But the lack of open clusters with ages corresponding to the first half of the main sequence evolution of B-type stars makes it impossible to conclude that the Be phenomenon is restricted to the second half of the main-sequence evolution.
In the Galaxy, definite Be stars (red circles in Fig. 16, bottom panel) have mostly evolved to the second half of the main-sequence band as reported before by Fabregat & Torrejón (2000). The earliest (B0e) have alreached the TAMS. The locations of candidate and definite Be stars with early spectral types largely overlap. Towards later spectral sub-types, candidate Be stars could be less or even unevolved. But there is a risk of confusion with pre-main sequence objects. This uncertainty is smaller for definite Be stars.
To confirm the nature and better determine the evolutionary status of these Be stars, spectra with higher resolution and spectral coverage are required of both young and medium-aged open clusters in the SMC as well as the Galaxy.
A new result suggested by the present study is that in the SMC the Be phenomenon appears particularly enhanced towards hotter and more massive stars (O stars) than in the Galaxy. Because the losses of mass and angular momentum are lower in the SMC than in the Galaxy, this result is plausible and qualitatively consistent with the theoretical prediction from Maeder & Meynet (2001). However, these authors did not quantify the expected fractions of Oe or Be stars as a function of metallicity.
An important parameter to consider is , the fractional critical angular rotation rate. If low-metallicity stars form with about the same initial angular momentum as more metal-rich stars of equal mass but have smaller radii on the main sequence, their values must be higher.
Since the, then, expected higher relative frequency of Be stars is, in fact, higher in the SMC than in the Galaxy, may be the parameter dominating the formation of rapidly rotating B stars. They may become Be stars just on account of their rapid rotation. Alternatively, the outbreak of the Be phenomenon may be helped by pulsation-assisted outbursts, which are triggered by the beating of two or more nonradial pulsations modes. In the Galaxy, only one such case has been found so far ($μ$ Cen, Rivinius et al. 1998). But several photometrically multiperiodic candidates were recently identified by Martayan et al. (2007a) and Diago et al. (2008) in the SMC. Moreover, the latter authors report an order of magnitude larger incidence of pulsations among Be stars than in B stars without emission lines.
In summary, the results of this work indicate that, at least for single stars, the Be phenomenon is coupled to (initial) mass, evolutionary stage, and metallicity. But it is not evident that these 3 parameters are primary quantities determining the prevalence of the Be phenomenon. A more physical description, in accordance with the above, is the one by Martayan et al. (2007b), who submit that the Be phenomenon depends primarily on the evolution of . is governed by evolutionary stage and metallicity but the dependencies are different in different mass domains, which leads to the confusing apparent lack of consistency or uniqueness of empirical studies of the Be phenomenon at large (the larger the area “imaged”, the more single trees seem to stand out).
6 Summary and conclusions
A slitless spectroscopic survey for emission-line objects in the SMC was performed. Fourteen fields covered most of the SMC. From 3 million spectra, about 8,120 spectra of 4,437 stars in 84 clusters and 14 nearby comparison fields were automatically selected. The final database comprises 122 definite main-sequence Oe/Be/Ae stars and 54 candidate emission-line stars, 1,659 main-sequence O/B/A stars, 2,408 other normal stars, and 90 emission-line stars not near the main sequence. Fifty-five emission-line stars in NGC 346 were also found and classified; but their nature - main sequence or pre-main sequence stars - is not clear so that they were not included in the statistics and analysis.
Cross-correlation with the OGLE database permitted these emission-line objects to be associated with homogeneous photometric data. For 49 additional emission-line stars photometric data could not be derived. While the survey is spatially homogeneous, it is starting to become incomplete around B3 (on the main sequence). For comparison, similar Galactic (but photometric) data from the work of McSwain & Gies (2005) were converted to the same scales in absolute luminosity and effective temperature.
Careful analysis led to the following conclusions:
-
–
An intercomparison of clusters did not furnish any dependency of the relative frequency of emission-line stars on spatial density.
-
–
In the SMC, the Be phenomenon is more strongly enhanced towards early-type stars (O stars) than in the Galaxy. Among early spectral sub-types, the fraction of Be stars in the SMC exceeds the one in the Galaxy by a factor of 3-5.
-
–
The largest number of Be stars is found at spectral type B2 both in SMC and Galaxy. Since also the emission-line strength is largest near B2, this result is difficult to interpret in the presence of low sensitivity to weak emission lines.
-
–
In color-magnitude diagrams, most Be stars are found off the zero-age main sequence, with many of them defining a separate red “sequence”.
-
–
The age distribution of clusters hosting Be stars shows that the Be phenomenon does cover the second half of the main-sequence evolution. Some Be stars may have formed as Be stars while others may have acquired their Be nature only during the course of their evolution. There are not enough young clusters in the SMC sample to say anything about the Be phenomenon during the first half of the main-sequence evolution of SMC stars.
-
–
The observations are consistent with being one of the main quantities governing the statistics of emission-line stars in all sub-samples of single stars. rises slowly with time for intermediate and late B stars of all metallicities for massive B and O stars. The same holds for early-type B stars with SMC metallicity. Only massive Galactic OB stars are different in that their decreases with time. When also evolution, initial mass, and metallicity are considered, the relative abundance of Be stars takes on a multi-parametric appearance. But still dominates.
The above trends only stand out significantly in sufficiently large samples. Seemingly very similar, if not identical, small samples (e.g., single open star clusters) can differ drastically in their number of Be stars. To date, there is not even a speculative explanation for this. Maybe, a large variation in the initial distribution of rotation rates combined with a threshold in plays a role.
In forthcoming articles, we shall present results of WFI slitless H spectroscopy in the SMC field (outside clusters) and in open clusters and the field of the LMC. The nature of emission-line stars far from the main sequence will also be expanded on in a future paper.
Acknowledgements.
The authors acknowledge the referee for valuable comments that helped to present the essence of the paper more clearly. C.M. thanks Drs A.-M. Hubert, M. Floquet, and Y. Frémat for sharing useful information during the preliminary analysis of our data. Dr E. Bertin’s adaptation of his SExtractor package proved most helpful for the mass reduction of the observations. This research has made use of the Simbad and Vizier databases maintained at CDS, Strasbourg, France, of NASA’s Astrophysics Data System Bibliographic Services, and of the NASA/IPAC Infrared Science Archive, which is operated by the Jet Propulsion Laboratory, California Institute of Technology, under contract with the U.S. National Aeronautics and Space Administration. This publication makes use of data products from the Two Micron All Sky Survey, which is a joint project of the University of Massachusetts and the Infrared Processing and Analysis Center/California Institute of Technology, funded by the U.S. National Aeronautics and Space Administration and the U.S. National Science Foundation. C.M. is grateful for support from ESO’s DGDF in 2006.References
- Ahumada & Lapasset (2007) Ahumada, J. A. & Lapasset, E. 2007, A&A, 463, 789
- Baade et al. (1999) Baade, D., Meisenheimer, K., Iwert, O., et al. 1999, The Messenger, 95, 15
- Bertin & Arnouts (1996) Bertin, E. & Arnouts, S. 1996, A&AS, 117, 393
- Bouret et al. (2003) Bouret, J.-C., Lanz, T., Hillier, D. J., et al. 2003, ApJ, 595, 1182
- Chiosi et al. (2006) Chiosi, E., Vallenari, A., Held, E. V., Rizzi, L., & Moretti, A. 2006, A&A, 452, 179
- Cioni et al. (2006) Cioni, M.-R. L., Girardi, L., Marigo, P., & Habing, H. J. 2006, A&A, 452, 195
- Cousins (1987) Cousins, A. W. J. 1987, South African Astronomical Observatory Circular, 11, 93
- Cousins & Caldwell (1985) Cousins, A. W. J. & Caldwell, J. A. R. 1985, The Observatory, 105, 134
- Dachs et al. (1988) Dachs, J., Kiehling, R., & Engels, D. 1988, A&A, 194, 167
- Diago et al. (2008) Diago, P. D., Gutiérrez-Soto, J., Fabregat, J., & Martayan, C. 2008, A&A, 480, 179
- Epchtein et al. (1994) Epchtein, N., de Batz, B., Copet, E., et al. 1994, Ap&SS, 217, 3
- Evans et al. (2008) Evans, C., Hunter, I., Smartt, S., et al. 2008, The Messenger, 131, 25
- Fabregat (2003) Fabregat, J. 2003, in Astronomical Society of the Pacific Conference Series, Vol. 292, Interplay of Periodic, Cyclic and Stochastic Variability in Selected Areas of the H-R Diagram, ed. C. Sterken, 65–70
- Fabregat & Torrejón (2000) Fabregat, J. & Torrejón, J. M. 2000, A&A, 357, 451
- Frémat et al. (2005) Frémat, Y., Zorec, J., Hubert, A.-M., & Floquet, M. 2005, A&A, 440, 305
- Haberl & Sasaki (2000) Haberl, F. & Sasaki, M. 2000, A&A, 359, 573
- Hennekemper et al. (2008) Hennekemper, E., Gouliermis, D. A., Henning, T., Brandner, W., & Dolphin, A. E. 2008, ApJ, 672, 914
- Huang & Gies (2006) Huang, W. & Gies, D. R. 2006, ApJ, 648, 580
- Hummel et al. (2001) Hummel, W., Gässler, W., Muschielok, B., et al. 2001, A&A, 371, 932
- Hummel et al. (1999) Hummel, W., Szeifert, T., Gässler, W., et al. 1999, A&A, 352, L31
- Hunter et al. (2008) Hunter, I., Lennon, D. J., Dufton, P. L., et al. 2008, A&A, 479, 541
- Keller (2004) Keller, S. C. 2004, Publications of the Astronomical Society of Australia, 21, 310
- Keller et al. (1999) Keller, S. C., Wood, P. R., & Bessell, M. S. 1999, A&AS, 134, 489
- Kogure & Hirata (1982) Kogure, T. & Hirata, R. 1982, Bulletin of the Astronomical Society of India, 10, 281
- Lang (1992) Lang, K. R. 1992, Astrophysical data, Planets and Stars, New York, Springer Verlag Eds
- Maeder et al. (1999) Maeder, A., Grebel, E. K., & Mermilliod, J.-C. 1999, A&A, 346, 459
- Maeder & Meynet (2001) Maeder, A. & Meynet, G. 2001, A&A, 373, 555
- Martayan et al. (2007a) Martayan, C., Floquet, M., Hubert, A. M., et al. 2007a, A&A, 472, 577
- Martayan et al. (2008) Martayan, C., Floquet, M., Hubert, A. M., et al. 2008, A&A, 489, 459
- Martayan et al. (2006) Martayan, C., Frémat, Y., Hubert, A.-M., et al. 2006, A&A, 452, 273
- Martayan et al. (2007b) Martayan, C., Frémat, Y., Hubert, A.-M., et al. 2007b, A&A, 462, 683
- Mathew et al. (2008) Mathew, B., Subramaniam, A., & Bhatt, B. C. 2008, MNRAS, 388, 1879
- McSwain & Gies (2005) McSwain, M. V. & Gies, D. R. 2005, ApJS, 161, 118
- McSwain et al. (2008) McSwain, M. V., Huang, W., Gies, D. R., Grundstrom, E. D., & Townsend, R. H. D. 2008, ApJ, 672, 590
- Meynet & Maeder (2000) Meynet, G. & Maeder, A. 2000, A&A, 361, 101
- Meyssonnier & Azzopardi (1993) Meyssonnier, N. & Azzopardi, M. 1993, A&AS, 102, 451
- Momany et al. (2001) Momany, Y., Vandame, B., Zaggia, S., et al. 2001, A&A, 379, 436
- Nota et al. (2006) Nota, A., Sirianni, M., Sabbi, E., et al. 2006, ApJ, 640, L29
- Pietrzynski & Udalski (1999) Pietrzynski, G. & Udalski, A. 1999, Acta Astronomica, 49, 157
- Porter & Rivinius (2003) Porter, J. M. & Rivinius, T. 2003, PASP, 115, 1153
- Rivinius et al. (1998) Rivinius, T., Baade, D., Stefl, S., et al. 1998, A&A, 336, 177
- Schaller et al. (1992) Schaller, G., Schaerer, D., Meynet, G., & Maeder, A. 1992, A&AS, 96, 269
- Skrutskie et al. (2006) Skrutskie, M. F., Cutri, R. M., Stiening, R., et al. 2006, AJ, 131, 1163
- Trundle et al. (2007) Trundle, C., Dufton, P. L., Hunter, I., et al. 2007, A&A, 471, 625
- Udalski (2000) Udalski, A. 2000, Acta Astronomica, 50, 279
- Udalski et al. (1998) Udalski, A., Szymanski, M., Kubiak, M., et al. 1998, Acta Astronomica, 48, 147
- Wallace & Gray (2003) Wallace, P. T. & Gray, N. 2003, User’s guide of ASTROM
- Warren & Hesser (1977) Warren, Jr., W. H. & Hesser, J. E. 1977, ApJS, 34, 207
- Wisniewski & Bjorkman (2006) Wisniewski, J. P. & Bjorkman, K. S. 2006, ApJ, 652, 458
- Wisniewski et al. (2007a) Wisniewski, J. P., Bjorkman, K. S., Bjorkman, J. E., & Clampin, M. 2007a, ApJ, 670, 1331
- Wisniewski et al. (2007b) Wisniewski, J. P., Bjorkman, K. S., Magalhães, A. M., et al. 2007b, ApJ, 671, 2040
- Wolff et al. (2007) Wolff, S. C., Strom, S. E., Dror, D., & Venn, K. 2007, AJ, 133, 1092
- Zorec & Frémat (2005) Zorec, J. & Frémat, Y. 2005, in SF2A-2005: Semaine de l’Astrophysique Francaise, ed. F. Casoli, T. Contini, J. M. Hameury, & L. Pagani, 361–362
- Zorec et al. (2005) Zorec, J., Frémat, Y., & Cidale, L. 2005, A&A, 441, 235
- Zorec et al. (2007) Zorec, J., Frémat, Y., Martayan, C., Cidale, L. S., & Torres, A. F. 2007, in Astronomical Society of the Pacific Conference Series, Vol. 361, Active OB-Stars: Laboratories for Stellare and Circumstellar Physics, ed. A. T. Okazaki, S. P. Owocki, & S. Stefl, 539–541
Appendix A Comments on individual open clusters
A.1 NGC 330 (Ogle-SMC107)
NGC 330 is a well-studied open cluster known for its high content of Be stars (see for example Keller et al. 1999). The area covered by NGC 330 is the largest one of all clusters in this paper. A total of 400 spectra was examinded and 55 emission-line stars were identified. Cross-matching with OGLE photometry provided indications that the majority of the latter are actually Be stars.
A.2 Bruck 60 (Ogle-SMC72)
Bruck 60 is one of the six SMC open clusters observed by Wisniewski & Bjorkman (2006). They found 26 Be stars, among them 6 candidates, within a radius of 1.5′ while the present study extended over a radius of 35″ centered on the cluster. The two areas have 17 stars in common, of which Album rejected 8 highly blended sources. The detection rate of 9/17 stars is consistent with the estimated general extraction efficiency of 60% in the region of Bruch 60. Of the 9 detected stars (WBBe5, WBBe6, WBBe7, WBBe10, WBBe17, WBBe20, WBBe21, WBBe23, WBBe25), 2 (WBBe23 and WBBe25) are not properly separated and were also eliminated. Of the 7 remaining emission-line stars, 4 (WBBe5, WBBe10, WBBe17, WBBe20) are in common to both studies. One star (WBBe7), for which Wisniewski et al. (2007b) did not publish polarimetry, is found without emission. The two others (WBBe6 and WBBe21) are faint and have a too low S/N to provide a reliable conclusion about the presence of emission in their spectra. The stars poorly separated and/or with low S/N have V magnitudes of 17.4, 17.6, 18, and 18. Finally, the present study finds one candidate emission-line star not identified by Wisniewski & Bjorkman (2006).
A.3 NGC 346
This open cluster is highly complex with various sub-aggregates. Bouret et al. (2003) published an age of 3 Myears and a metallicity of 0.004. However, Nota et al. (2006) found several populations with different ages: 4.5 Gyears for stars in the field, a young population with ages ranging from 3 to 5 Myears, in which stars with a mass less than 3 M⊙ are still pre-main sequence stars, and a population with an intermediate age of 150 Myears.
In this open cluster and in its vicinity, we found 55 emission line stars. Dereddening with a global value of 0.008 mag for massive stars from Hennekemper et al. (2008) suggests that most of them are on the main sequence. The spectral classification obtained differs on average by 1 spectral sub-type for the 12 stars shared with spectral classifications by other authors.
Table 5 provides basic parameters for the 55 emission-line stars in NGC 346 along with magnitudes from the EIS pre-flames survey (Momany et al. 2001), from DENIS (Epchtein et al. 1994), and from 2MASS (Skrutskie et al. 2006). In Table 6, other parameters are given as well as spectral classifications from WFI and other sources. Owing to the large spread in age of the stars in this cluster, some of them could be pre-main sequence stars. Where possible, cross-references to the studies by Hennekemper et al. (2008), Wisniewski & Bjorkman (2006), Wisniewski et al. (2007b), and Hunter et al. (2008) and to the Simbad database are, therefore, also included.
Because the distinction between pre-main sequence (Herbig Ae/Be or T Tauri stars), main-sequence (mostly classical Be stars), and post-main sequence emission-line stars (e.g., WR) requires more spectroscopic data with higher spectral resolution and coverage, but also membership in the different sub-clusters, the stars from NGC 346 were not included in the overall analyses of this paper. Their large number could have introduced biases.
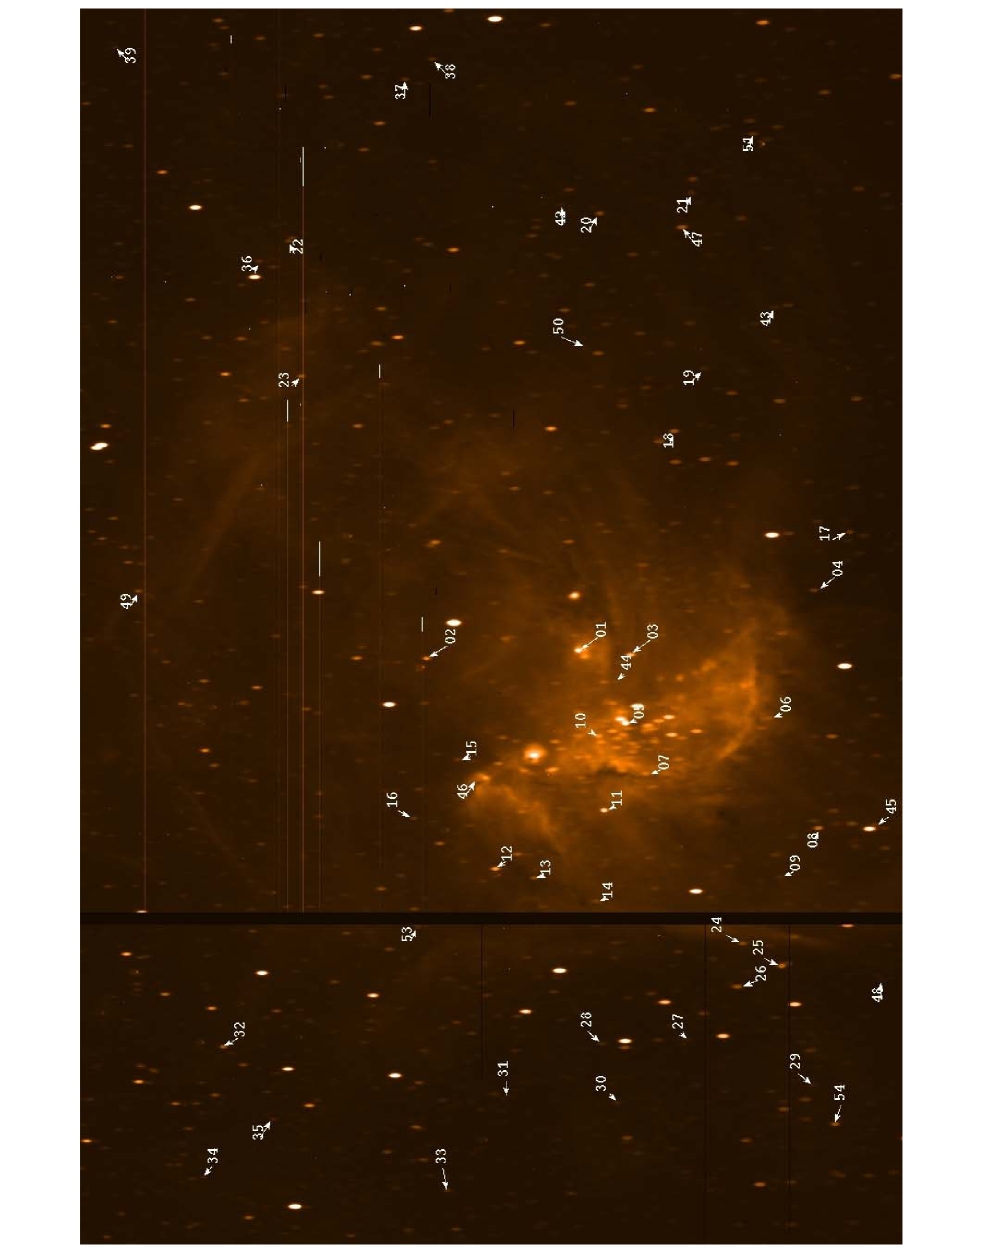
Fig. 17 shows part of a WFI image with NGC 346. Most of the emission-line stars are identified. For the central parts of the cluster(s) Hennekemper et al. (2008) report numerous pre-main sequence T Tauri stars, which are unfortunately too faint (see Fig. 4) to be detected by the present study. Fig. 17 also illustrates the ability of the WFI slitless spectroscopy to distinguish true circumstellar line emission from diffuse nebular emission. In low-resolution short-slit spectra, the difference can be marginal.
| ID WFI | RA(2000) | DEC(2000) | RA(2000) | DEC(2000) | RA(2000) | DEC(2000) | BEIS | VEIS | IDenis | J2M | H2M | K2M |
|---|---|---|---|---|---|---|---|---|---|---|---|---|
| WFI | WFI | 2MASS | 2MASS | EIS | EIS | |||||||
| WFI[S11] NGC 346-01 | 0 59 12.284 | -72 9 58.45 | 0 59 12.23 | -72 9 58.5 | 0 59 11.615 | -72 9 57.52 | 14.818 | 15.072 | _ | 14.152 | 14.381 | 13.046 |
| WFI[S11] NGC 346-02 | 0 59 28.866 | -72 10 16.68 | 0 59 28.76 | -72 10 16.7 | 0 59 28.750 | -72 10 16.55 | 15.041 | 15.122 | 15.035 | 14.958 | 14.879 | 14.651 |
| WFI[S11] NGC 346-03 | 0 59 06.430 | -72 9 56.35 | 0 59 06.33 | -72 9 56.1 | 0 59 6.337 | -72 9 56.06 | 14.131 | 14.281 | 14.496 | 14.551 | 14.525 | 14.283 |
| WFI[S11] NGC 346-04 | 0 58 47.641 | -72 9 03.11 | 0 58 47.47 | -72 9 03.0 | 0 58 47.525 | -72 9 2.70 | 15.580 | 15.729 | 15.722 | 15.773 | 15.946 | 15.815 |
| WFI[S11] NGC 346-05 | 0 59 05.547 | -72 10 35.68 | 0 59 05.43 | -72 10 35.5 | _ _ _ | _ _ _ | 15.381 | 15.281 | _ | 13.013 | 13.262 | 11.949 |
| WFI[S11] NGC 346-06 | 0 58 49.709 | -72 10 19.86 | 0 58 49.55 | -72 10 19.6 | 0 58 49.609 | -72 10 19.52 | 15.780 | 15.889 | 16.098 | 15.498 | 15.368 | 15.327 |
| WFI[S11] NGC 346-07 | 0 59 02.093 | -72 11 02.55 | 0 59 02.03 | -72 11 02.5 | 0 59 2.056 | -72 11 2.37 | 15.778 | 15.803 | 15.730 | 15.578 | 15.600 | 14.824 |
| WFI[S11] NGC 346-08 | 0 58 41.925 | -72 11 18.16 | 0 58 41.80 | -72 11 17.9 | 0 58 41.861 | -72 11 17.55 | 14.849 | 14.919 | 14.982 | 14.891 | 14.593 | 14.707 |
| WFI[S11] NGC 346-09 | 0 58 45.074 | -72 11 49.46 | _ _ _ | _ _ _ | 0 58 45.043 | -72 11 48.98 | 16.684 | 16.806 | _ | _ | _ | _ |
| WFI[S11] NGC 346-10 | 0 59 08.214 | -72 10 45.57 | 0 59 08.13 | -72 10 45.4 | 0 59 8.141 | -72 10 45.25 | 15.619 | 15.652 | 15.257 | 15.226 | 14.713 | 14.407 |
| WFI[S11] NGC 346-11 | 0 59 05.972 | -72 11 27.42 | 0 59 05.88 | -72 11 27.0 | 0 59 5.873 | -72 11 26.98 | 16.125 | 15.863 | 15.107 | 14.557 | 13.892 | 12.808 |
| WFI[S11] NGC 346-12 | 0 59 16.683 | -72 12 10.36 | 0 59 16.65 | -72 12 10.2 | 0 59 16.613 | -72 12 10.04 | 14.687 | 16.638 | 14.480 | 14.273 | 14.280 | 14.059 |
| WFI[S11] NGC 346-13 | 0 59 12.198 | -72 12 12.03 | 0 59 12.14 | -72 12 11.9 | 0 59 12.119 | -72 12 11.69 | 15.926 | 15.874 | 15.659 | 15.631 | 15.249 | 15.300 |
| WFI[S11] NGC 346-14 | 0 59 04.794 | -72 12 19.78 | 0 59 04.65 | -72 12 19.7 | 0 59 4.613 | -72 12 19.46 | 16.352 | 16.471 | 16.141 | 16.339 | 16.175 | 15.551 |
| WFI[S11] NGC 346-15 | 0 59 23.150 | -72 11 11.41 | 0 59 23.08 | -72 11 11.3 | 0 59 23.091 | -72 11 11.32 | 16.313 | 16.554 | _ | 16.416 | 16.339 | 14.471 |
| WFI[S11] NGC 346-16 | 0 59 26.818 | -72 11 48.86 | 0 59 26.77 | -72 11 48.8 | 0 59 26.718 | -72 11 48.56 | 16.415 | 16.567 | 16.680 | 16.628 | 16.695 | 15.369 |
| WFI[S11] NGC 346-17 | 0 58 45.003 | -72 8 26.92 | 0 58 44.86 | -72 8 26.6 | 0 58 44.912 | -72 8 26.41 | 16.136 | 16.158 | 15.994 | 15.967 | 15.644 | 15.411 |
| WFI[S11] NGC 346-18 | 0 59 06.540 | -72 7 45.18 | 0 59 06.39 | -72 7 45.2 | 0 59 6.382 | -72 7 44.97 | 14.748 | 14.919 | 14.962 | 15.097 | 15.073 | 14.899 |
| WFI[S11] NGC 346-19 | 0 59 04.612 | -72 7 06.70 | 0 59 04.46 | -72 7 07.0 | 0 59 4.419 | -72 7 6.52 | 16.423 | 16.584 | 16.645 | 16.654 | 17.039 | 16.875 |
| WFI[S11] NGC 346-20 | 0 59 19.462 | -72 5 47.83 | 0 59 19.33 | -72 5 48.0 | 0 59 19.283 | -72 5 47.80 | 15.559 | 15.684 | 15.617 | 15.571 | 15.544 | 15.128 |
| WFI[S11] NGC 346-21 | 0 59 09.813 | -72 5 27.92 | 0 59 09.78 | -72 5 28.2 | 0 59 9.673 | -72 5 27.78 | 16.483 | 16.589 | 16.480 | 16.386 | 16.142 | 15.439 |
| WFI[S11] NGC 346-22 | 0 59 53.038 | -72 6 31.07 | 0 59 52.90 | -72 6 31.1 | 0 59 52.925 | -72 6 31.06 | 16.404 | 16.458 | _ | 15.518 | 15.638 | 15.158 |
| WFI[S11] NGC 346-23 | 0 59 48.814 | -72 7 47.02 | 0 59 48.69 | -72 7 47.3 | 0 59 48.680 | -72 7 46.97 | 15.864 | 15.866 | 15.575 | 15.730 | 15.527 | 15.328 |
| WFI[S11] NGC 346-24 | 0 58 47.609 | -72 12 36.66 | 0 58 47.43 | -72 12 36.8 | 0 58 47.499 | -72 12 36.57 | 15.263 | 15.471 | 15.735 | 15.393 | 15.193 | 14.938 |
| WFI[S11] NGC 346-25 | 0 58 42.821 | -72 12 46.02 | _ _ _ | _ _ _ | 0 58 42.719 | -72 12 45.83 | 14.840 | 14.961 | 14.617 | _ | _ | _ |
| WFI[S11] NGC 346-26 | 0 58 47.215 | -72 13 01.68 | _ _ _ | _ _ _ | 0 58 47.104 | -72 13 1.57 | 14.662 | 14.781 | 14.562 | _ | _ | _ |
| WFI[S11] NGC 346-27 | 0 58 51.670 | -72 13 36.21 | _ _ _ | _ _ _ | 0 58 51.518 | -72 13 36.01 | 16.993 | 17.069 | 17.143 | _ | _ | _ |
| WFI[S11] NGC 346-28 | 0 59 00.971 | -72 13 46.43 | 0 59 00.87 | -72 13 46.5 | 0 59 0.873 | -72 13 46.39 | 16.960 | 16.873 | 16.578 | 16.241 | 15.895 | 15.066 |
| WFI[S11] NGC 346-29 | 0 58 36.753 | -72 13 51.03 | _ _ _ | _ _ _ | 0 58 36.599 | -72 13 50.79 | 16.673 | 16.903 | 16.952 | _ | _ | _ |
| WFI[S11] NGC 346-30 | 0 58 58.031 | -72 14 18.79 | _ _ _ | _ _ _ | 0 58 57.922 | -72 14 18.69 | 17.116 | 17.201 | _ | _ | _ | _ |
| ID WFI | RA(2000) | DEC(2000) | RA(2000) | DEC(2000) | RA(2000) | DEC(2000) | BEIS | VEIS | IDenis | J2M | H2M | K2M |
|---|---|---|---|---|---|---|---|---|---|---|---|---|
| WFI | WFI | 2MASS | 2MASS | EIS | EIS | |||||||
| WFI[S11] NGC 346-31 | 0 59 10.243 | -72 14 24.83 | _ _ _ | _ _ _ | 0 59 10.147 | -72 14 24.68 | 17.571 | 17.700 | 17.526 | _ | _ | _ |
| WFI[S11] NGC 346-32 | 0 59 42.773 | -72 14 22.03 | 0 59 42.73 | -72 14 22.2 | 0 59 42.713 | -72 14 21.88 | 15.370 | 15.526 | 15.205 | 15.193 | 15.041 | 14.753 |
| WFI[S11] NGC 346-33 | 0 59 14.828 | -72 15 23.78 | 0 59 14.72 | -72 15 23.8 | 0 59 14.723 | -72 15 23.59 | 16.542 | 16.623 | 16.442 | 16.201 | 16.435 | 16.007 |
| WFI[S11] NGC 346-34 | 0 59 42.097 | -72 15 37.94 | _ _ _ | _ _ _ | 0 59 42.048 | -72 15 37.68 | 17.300 | 17.412 | 17.315 | _ | _ | _ |
| WFI[S11] NGC 346-35 | 0 59 35.677 | -72 14 58.81 | _ _ _ | _ _ _ | 0 59 35.597 | -72 14 58.63 | 16.869 | 17.030 | 17.042 | _ | _ | _ |
| WFI[S11] NGC 346-36 | 0 59 55.900 | -72 6 45.42 | 0 59 55.79 | -72 6 45.5 | _ _ _ | _ _ _ | 14.611 | 14.391 | 15.934 | 15.969 | 15.938 | 15.183 |
| WFI[S11] NGC 346-37 | 0 59 43.714 | -72 4 48.81 | 0 59 43.56 | -72 4 49.2 | 0 59 43.564 | -72 4 48.75 | 16.143 | 16.299 | 16.185 | 16.402 | 15.668 | 15.082 |
| WFI[S11] NGC 346-38 | 0 59 41.155 | -72 4 34.93 | 0 59 41.12 | -72 4 34.9 | 0 59 41.004 | -72 4 34.88 | 16.290 | 16.402 | 16.138 | 16.324 | 15.714 | 15.806 |
| WFI[S11] NGC 346-39 | 1 00 16.196 | -72 04 56.22 | _ _ _ | _ _ _ | 1 0 16.125 | -72 4 55.81 | 16.966 | 17.151 | _ | _ | _ | _ |
| WFI[S11] NGC 346-40 | 0 59 58.161 | -72 04 04.95 | _ _ _ | _ _ _ | 0 59 58.015 | -72 4 4.83 | 16.925 | 17.047 | 17.040 | _ | _ | _ |
| WFI[S11] NGC 346-41 | 0 59 33.396 | -72 02 21.80 | _ _ _ | _ _ _ | 0 59 33.203 | -72 2 21.50 | 16.616 | 16.786 | 16.888 | _ | _ | _ |
| WFI[S11] NGC 346-42 | 0 59 23.963 | -72 05 46.42 | _ _ _ | _ _ _ | 0 59 23.787 | -72 5 46.37 | _ | 17.625 | 17.689 | _ | _ | _ |
| WFI[S11] NGC 346-43 | 0 58 58.183 | -72 06 25.49 | _ _ _ | _ _ _ | 0 58 58.002 | -72 6 25.13 | 16.571 | 16.723 | 16.556 | _ | _ | _ |
| WFI[S11] NGC 346-44 | 0 59 07.577 | -72 10 12.96 | _ _ _ | _ _ _ | 0 59 7.413 | -72 10 12.82 | 17.623 | 17.749 | _ | _ | _ | _ |
| WFI[S11] NGC 346-45 | 0 58 35.686 | -72 11 10.86 | _ _ _ | _ _ _ | _ _ _ | _ _ _ | 16.201 | 16.291 | _ | _ | _ | _ |
| WFI[S11] NGC 346-46 | 0 59 20.713 | -72 11 21.51 | _ _ _ | _ _ _ | _ _ _ | _ _ _ | 18.371 | 18.631 | _ | _ | _ | _ |
| WFI[S11] NGC 346-47 | 0 59 10.076 | -72 5 48.40 | 0 59 09.98 | -72 5 48.5 | 0 59 9.933 | -72 5 48.21 | 14.184 | 14.479 | 14.593 | 14.933 | 14.978 | 15.031 |
| WFI[S11] NGC 346-48 | 0 58 31.435 | -72 12 44.87 | _ _ _ | _ _ _ | 0 58 31.241 | -72 12 44.81 | 17.640 | 17.746 | _ | _ | _ | _ |
| WFI[S11] NGC 346-49 | 1 0 02.121 | -72 10 03.75 | 1 0 02.09 | -72 10 03.8 | 1 0 2.062 | -72 10 3.59 | 15.784 | 15.947 | 15.821 | 16.003 | 15.697 | 15.115 |
| WFI[S11] NGC 346-50 | 0 59 18.221 | -72 07 04.26 | _ _ _ | _ _ _ | 0 59 18.103 | -72 7 4.32 | 17.843 | 17.973 | _ | _ | _ | _ |
| WFI[S11] NGC 346-51 | 0 59 4.141 | -72 4 48.72 | 0 59 4.2 | -72 4 48.8 | 0 59 4.141 | -72 4 48.72 | 15.601 | 15.772 | 16.077 | 16.2 | 15.882 | 15.332 |
| WFI[S11] NGC 346-52 | 0 59 6.487 | -72 2 37.27 | 0 59 6.51 | -72 2 37.5 | 0 59 6.487 | -72 2 37.27 | 14.987 | 14.415 | 13.674 | 13.234 | 12.92 | 12.824 |
| WFI[S11] NGC 346-53 | 0 59 26.460 | -72 13 11.78 | 0 59 26.51 | -72 13 11.9 | 0 59 26.460 | -72 13 11.78 | 15.262 | 15.382 | 15.713 | 15.883 | 15.947 | 16.793 |
| WFI[S11] NGC 346-54 | 0 58 33.256 | -72 14 10.95 | 0 58 33.21 | -72 14 11.2 | 0 58 33.253 | -72 14 10.92 | 15.627 | 15.281 | 15.266 | 15.233 | 15.26 | 14.834 |
| WFI[S11] NGC 346-55 | 0 59 26.523 | -72 9 54.06 | 0 59 26.57 | -72 9 54.1 | 0 59 26.513 | -72 9 53.84 | 11.619 | 11.51 | 11.029 | 11.111 | 11.006 | 10.769 |
1: from Simbad
| Id WFI | Id EIS | Id Simbad | (B-V) | E[B-V] | (B-V)0 | V0 | Mv | ST | class Simbad | class VFS | class WB07 | class | class H08 |
|---|---|---|---|---|---|---|---|---|---|---|---|---|---|
| from H08 | WFI | Spitzer | |||||||||||
| NGC 346-01 | SMC5_089286 | KWBBe448 | -0.254 | 0.08 | -0.334 | 14.82 | -3.93 | B0: | _ | N28, class I | |||
| NGC 346-02 | SMC5_056563 | KWBBe248 | -0.081 | 0.22 | -0.301 | 14.44 | -4.31 | O9: | B0V | Be(2) | B0V (19) | ||
| NGC 346-03 | SMC5_030226 | MPG482 | -0.150 | 0.18 | -0.330 | 13.72 | -5.03 | O7: | B0.5V: | B0.5V (14) | |||
| NGC 346-04 | SMC5_083005 | KWBBe379 | -0.149 | 0.08 | -0.229 | 15.48 | -3.27 | B0: | _ | B3e | not Be(3) | N69, class III | |
| NGC 346-05 | _ | MPG454 | 0.100 | 0.08 | 0.020 | 15.03 | -3.72 | B0: | _ | ||||
| NGC 346-06 | SMC5_029906 | NMC47 | -0.109 | 0.08 | -0.189 | 15.64 | -3.11 | B1: | B1V | B1Ve | N6, class III | ||
| NGC 346-07 | SMC5_029282 | KWBBe191 | -0.025 | 0.08 | -0.105 | 15.56 | -3.20 | B1: | _ | Be(1.5) | |||
| NGC 346-08 | SMC5_029130 | NMC45 | -0.070 | 0.08 | -0.150 | 14.67 | -4.08 | B0: | B0.2e | B0.2e | Be(2) | ||
| NGC 346-09 | SMC5_028674 | MPG208 | -0.122 | 0.08 | -0.202 | 16.56 | -2.19 | B2: | _ | ||||
| NGC 346-10 | SMC5_029509 | KWBBe212 | -0.033 | 0.08 | -0.113 | 15.40 | -3.35 | B0: | _ | N90?, class II | |||
| NGC 346-11 | SMC5_081533 | KWBBe200 | 0.262 | 0.08 | 0.182 | 15.62 | -3.14 | B1: | Be | notBe, B[e] | |||
| NGC 346-12 | SMC5_055483 | KWBBe93 | -1.951 | 0.08 | -2.031 | 16.39 | -2.36 | B21: | _ | Be(1) | |||
| NGC 346-13 | SMC5_055468 | KWBBe445 | 0.052 | 0.08 | -0.028 | 15.63 | -3.12 | B1: | B2e | B2e | Be(1.5) | ||
| NGC 346-14 | SMC5_078460 | KWBBe807 | -0.119 | 0.08 | -0.199 | 16.22 | -2.53 | B1: | _ | Be(2) | |||
| NGC 346-15 | SMC5_188572 | KWBBe908 | -0.241 | 0.08 | -0.321 | 16.31 | -2.44 | B2: | _ | Be(2) | |||
| NGC 346-16 | SMC5_028654 | KWBBe921 | -0.152 | 0.08 | -0.232 | 16.32 | -2.43 | B2: | _ | ||||
| NGC 346-17 | SMC5_006366 | KWBBe374 | -0.022 | 0.08 | -0.102 | 15.91 | -2.84 | B1: | _ | Be(1.5) | |||
| NGC 346-18 | SMC5_078074 | KWBBe205 | -0.171 | 0.08 | -0.251 | 14.67 | -4.08 | B0: | _ | B2esh | Be(2) | ||
| NGC 346-19 | SMC5_006627 | KWBBe814 | -0.161 | 0.08 | -0.241 | 16.34 | -2.41 | B2: | _ | Be(2) | |||
| NGC 346-20 | SMC5_033513 | KWBBe236 | -0.125 | 0.08 | -0.205 | 15.44 | -3.31 | B0: | B0.5esh | B0.5esh | Be(1) | ||
| NGC 346-21 | SMC5_006934 | KWBBe856 | -0.106 | 0.08 | -0.186 | 16.34 | -2.41 | B2: | _ | Be(2) | |||
| NGC 346-22 | SMC5_032946 | _ | -0.054 | 0.08 | -0.134 | 16.21 | -2.54 | B1: | _ | ||||
| NGC 346-23 | SMC5_031915 | KWBBe266 | -0.002 | 0.08 | -0.082 | 15.62 | -3.13 | B1: | _ | Be(2) | |||
| NGC 346-24 | SMC5_028019 | KWBBe377 | -0.208 | 0.08 | -0.288 | 15.22 | -3.53 | B0: | Be | B3esh | Be(2) | ||
| NGC 346-25 | SMC5_079464 | KWBBe171 | -0.121 | 0.08 | -0.201 | 14.71 | -4.04 | B0: | Em | Be(2) | |||
| NGC 346-26 | SMC5_038701 | MPG217 | -0.119 | 0.08 | -0.199 | 14.53 | -4.22 | O9: | O9.5IIIe | 09.5IIIe | |||
| NGC 346-27 | SMC5_054519 | _ | -0.076 | 0.08 | -0.156 | 16.82 | -1.93 | B2: | _ | ||||
| NGC 346-28 | SMC5_054474 | KWBBe778 | 0.087 | 0.08 | 0.007 | 16.63 | -2.13 | B2: | _ | ||||
| NGC 346-29 | SMC5_092842 | _ | -0.230 | 0.08 | -0.310 | 16.66 | -2.10 | B2: | _ | ||||
| NGC 346-30 | SMC5_026531 | _ | -0.085 | 0.08 | -0.165 | 16.95 | -1.80 | B3: | _ |
| Id WFI | Id EIS | Id Simbad | (B-V) | E[B-V] | (B-V)0 | V0 | Mv | ST | class Simbad | class VFS | class WB07 | class | class H08 |
|---|---|---|---|---|---|---|---|---|---|---|---|---|---|
| from H08 | WFI | Spitzer | |||||||||||
| NGC 346-31 | SMC5_061961 | _ | -0.129 | 0.08 | -0.209 | 17.45 | -1.30 | B4: | _ | ||||
| NGC 346-32 | SMC5_005173 | KWBBe259 | -0.156 | 0.08 | -0.236 | 15.28 | -3.47 | B0: | Be | Be(2) | |||
| NGC 346-33 | SMC5_068413 | _ | -0.081 | 0.08 | -0.161 | 16.38 | -2.38 | B2: | _ | ||||
| NGC 346-34 | SMC5_068336 | _ | -0.112 | 0.08 | -0.192 | 17.16 | -1.59 | B3: | _ | ||||
| NGC 346-35 | SMC5_053538 | _ | -0.161 | 0.08 | -0.241 | 16.78 | -1.97 | B2: | _ | ||||
| NGC 346-36 | _ | SMC47551 | 0.220 | 0.08 | 0.140 | 14.14 | -4.61 | O8: | _ | ||||
| NGC 346-37 | SMC5_007036 | [MA93]1161 | -0.156 | 0.08 | -0.236 | 16.05 | -2.70 | B1: | _ | ||||
| NGC 346-38 | SMC5_081044 | [MA93]1160 | -0.112 | 0.08 | -0.192 | 16.15 | -2.60 | B1: | _ | ||||
| NGC 346-39 | SMC5_034165 | _ | -0.185 | 0.08 | -0.265 | 16.90 | -1.85 | B2: | _ | ||||
| NGC 346-40 | SMC5_034799 | _ | -0.122 | 0.08 | -0.202 | 16.80 | -1.95 | B2: | _ | ||||
| NGC 346-41 | SMC5_007493 | [MA93]1154 | -0.170 | 0.08 | -0.250 | 16.54 | -2.21 | B2: | _ | ||||
| NGC 346-42 | SMC5_228705 | _ | _ | 0.08 | _ | 17.38 | -1.37 | B4:? | _ | ||||
| NGC 346-43 | SMC5_033051 | _ | -0.152 | 0.08 | -0.232 | 16.48 | -2.28 | B2: | _ | ||||
| NGC 346-44 | SMC5_069688 | MPG498 | -0.126 | 0.08 | -0.206 | 17.50 | -1.25 | B4: | _ | ||||
| NGC 346-45 | _ | KWBBe350 | -0.090 | 0.08 | -0.170 | 16.04 | -2.71 | B1: | _ | Be(2) | |||
| NGC 346-46 | _ | MPG698 | -0.260 | 0.08 | -0.340 | 18.38 | -0.37 | B6: | _ | HBe?(12) | |||
| NGC 346-47 | SMC5_033514 | KWBBe89 | -0.295 | 0.08 | -0.375 | 14.23 | -4.52 | O8: | O7Iab | Be(2) | |||
| NGC 346-48 | SMC5_055109 | MPG108 | -0.106 | 0.08 | -0.186 | 17.50 | -1.25 | B4: | _ | ||||
| NGC 346-49 | SMC5_030040 | KWBBe543 | -0.163 | 0.08 | -0.243 | 15.70 | -3.05 | B1: | Em | ||||
| NGC 346-50 | SMC5_058373 | _ | -0.130 | 0.08 | -0.210 | 17.73 | -1.03 | B4: | _ | ||||
| NGC 346-51 | SMC5_076404 | _ | -0.171 | 0.08 | -0.251 | 15.52 | -3.23 | B1: | _ | B0Ve-bin | |||
| NGC 346-52 | SMC5_035903 | _ | 0.572 | 0.08 | 0.492 | 14.17 | -4.58 | O81: | _ | ||||
| NGC 346-53 | SMC5_081656 | MPG753 | -0.120 | 0.08 | -0.200 | 15.13 | -3.62 | B0: | B1II | B1II | |||
| NGC 346-54 | SMC5_179751 | KWBBe152 | 0.347 | 0.08 | 0.267 | 15.03 | -3.72 | B0: | Em | Be(2) | |||
| NGC 346-55 | SMC5_207758 | HD5980 | 0.119 | 0.08 | 0.039 | 11.25 | -7.50 | WR | WR, EB, WNp | notBe |
1: not main sequence
Appendix B Open clusters: tables
Table 7 lists all open SMC clusters with their basic properties as well as the WFI field(s) covering it. Also shown are the numbers and types of emission-line stars found in each WFI image. The results after merger of multiple observations are contained in Table 8.
| Cluster | Image | RA(2000) | DEC(2000) | r | log(t) | Z | aN* | c | d | b | b/a | Ntot | NELS | NELS? | comments | N* | ELS |
|---|---|---|---|---|---|---|---|---|---|---|---|---|---|---|---|---|---|
| WFI | ″ | NELS | NELS? | c+d | % | ogle | ogle | ogle | ogle/wfi | ogle/wfi | |||||||
| SMC002 | 2 | 0 37 33.1 | -73 36 42.6 | 58 | 8.4 | 0.003-0.006 | 26 | 0 | 1 | 1 | 3.8 | 26 | 0 | 1 | 100.0 | 100.0 | |
| SMC008 | 2 | 0 40 30.54 | -73 24 10.4 | 53 | 8.0 | 0.003-0.006 | 103 | 3 | 3 | 6 | 5.8 | 102 | 3 | 3 | 99.0 | 100.0 | |
| SMC008 | 4 | 0 40 30.54 | -73 24 10.4 | 53 | 8.0 | 0.003-0.006 | 59 | 1 | 1 | 2 | 3.4 | 59 | 1 | 1 | 100.0 | 100.0 | |
| SMC009 | 2 | 0 40 44.11 | -73 23 0.2 | 45 | 8.0 | 0.003-0.006 | 73 | 2 | 2 | 4 | 5.5 | 64 | 1 | 2 | 87.7 | 75.0 | |
| SMC011 | 1 | 0 41 6.16 | -73 21 7.1 | 45 | 7.9 | 0.003-0.006 | 36 | 0 | 2 | 2 | 5.6 | 33 | 0 | 2 | 91.7 | 100.0 | |
| SMC011 | 2 | 0 41 6.16 | -73 21 7.1 | 45 | 7.9 | 0.003-0.006 | 65 | 3 | 2 | 5 | 7.7 | 64 | 3 | 2 | 98.5 | 100.0 | |
| SMC012 | 1 | 0 41 23.78 | -72 53 27.1 | 76 | 9 | 0.006-0.009 | 151 | 0 | 2 | 2 | 1.3 | 65 | 0 | 0 | very old | 43.0 | 0.0 |
| SMC015 | 1 | 0 42 54.13 | -73 17 37 | 37 | 8.1 | 0.003-0.006 | 88 | 1 | 3 | 4 | 4.5 | 78 | 1 | 3 | 88.6 | 100.0 | |
| SMC015 | 2 | 0 42 54.13 | -73 17 37 | 38 | 8.1 | 0.003-0.006 | 79 | 1 | 1 | 2 | 2.5 | 52 | 1 | 1 | 65.8 | 100.0 | |
| SMC016 | 1 | 0 42 58.46 | -73 10 7.2 | 53 | 8.3 | 0.003-0.006 | 119 | 0 | 1 | 1 | 0.8 | 115 | 0 | 1 | 96.6 | 100.0 | |
| SMC017 | 2 | 0 43 32.74 | -73 26 25.4 | 32 | 7.9 | 0.003-0.006 | 74 | 1 | 0 | 1 | 1.4 | 64 | 1 | 0 | 1 | 86.5 | 100.0 |
| SMC018 | 2 | 0 43 37.57 | -73 26 37.9 | 32 | 7.9 | 0.003-0.006 | 64 | 1 | 0 | 1 | 1.6 | 57 | 1 | 0 | 1 | 89.1 | 100.0 |
| SMC019 | 1 | 0 43 37.59 | -72 57 30.9 | 15 | 8.6 | 0.003-0.006 | 10 | 0 | 0 | 0 | 0.0 | 9 | 0 | 0 | 90.0 | _ | |
| SMC020 | 1 | 0 43 37.89 | -72 58 48.3 | 12 | 8.6 | 0.003-0.006 | 7 | 0 | 0 | 0 | 0.0 | 7 | 0 | 0 | 100.0 | _ | |
| SMC025 | 4 | 0 45 13.88 | -73 13 9.2 | 19 | 8.0 | 0.003-0.006 | 30 | 0 | 0 | 0 | 0.0 | 29 | 0 | 0 | 96.7 | _ | |
| SMC032 | 4 | 0 45 54.33 | -73 30 24.2 | 37 | 8.0 | 0.003-0.006 | 41 | 0 | 0 | 0 | 0.0 | 41 | 0 | 0 | 100.0 | _ | |
| SMC033 | 4 | 0 46 12.26 | -73 23 34 | 23 | 7.2 | 0.003-0.006 | 10 | 0 | 1 | 1 | 10.0 | 9 | 0 | 1 | 90.0 | 100.0 | |
| SMC038 | 4 | 0 47 6.15 | -73 15 24.9 | 26 | 8.1 | 0.003-0.006 | 64 | 0 | 0 | 0 | 0.0 | 64 | 0 | 0 | 100.0 | _ | |
| SMC039 | 4 | 0 47 11.61 | -73 28 38.1 | 61 | 8.0 | 0.003-0.006 | 197 | 3 | 1 | 4 | 2.0 | 176 | 3 | 1 | 89.3 | 100.0 | |
| SMC039 | 6 | 0 47 11.61 | -73 28 38.1 | 61 | 8.0 | 0.003-0.006 | 93 | 4 | 6 | 10 | 10.8 | 93 | 4 | 6 | 100.0 | 100.0 | |
| SMC043 | 4 | 0 47 52.38 | -73 13 20.3 | 27 | 8.5 | 0.003-0.006 | 63 | 1 | 1 | 2 | 3.2 | 55 | 1 | 1 | 87.3 | 100.0 | |
| SMC047 | 5 | 0 48 28.14 | -72 59 0.3 | 45 | 7.8 | 0.003-0.006 | 24 | 1 | 2 | 3 | 12.5 | 19 | 0 | 2 | 79.2 | 66.7 | |
| SMC049 | 6 | 0 48 37.47 | -73 24 53.2 | 47 | 7.0 | 0.003-0.006 | 88 | 2 | 5 | 7 | 8.0 | 62 | 2 | 4 | 70.5 | 85.7 | |
| SMC054 | 6 | 0 49 17.6 | -73 22 19.8 | 34 | 8.0 | 0.003-0.006 | 46 | 3 | 2 | 5 | 10.9 | 43 | 3 | 2 | 93.5 | 100.0 | |
| SMC059 | 5 | 0 50 16.06 | -73 1 59.6 | 31 | 7.8 | 0.003-0.006 | 25 | 0 | 0 | 0 | 0.0 | 25 | 0 | 0 | 100.0 | _ | |
| SMC061 | 6 | 0 50 0.26 | -73 15 17.7 | 26 | 7.4 | 0.003-0.006 | 44 | 1 | 4 | 5 | 11.4 | 42 | 1 | 4 | 95.5 | 100.0 | |
| SMC064 | 5 | 0 50 39.55 | -72 57 54.8 | 45 | 8.1 | 0.003-0.006 | 117 | 4 | 4 | 8 | 6.8 | 112 | 3 | 4 | 95.7 | 87.5 | |
| SMC066 | 6 | 0 50 55.39 | -73 12 11 | 21 | 7.8 | 0.003-0.006 | 3 | 0 | 1 | 1 | 33.3 | 3 | 0 | 1 | 100.0 | 100.0 | |
| SMC067 | 5 | 0 50 55.54 | -72 43 39.7 | 53 | 8.2 | 0.003-0.006 | 107 | 1 | 2 | 3 | 2.8 | 97 | 1 | 2 | 90.7 | 100.0 | |
| SMC068 | 6 | 0 50 56.26 | -73 17 21.1 | 70 | 7.7 | 0.003-0.006 | 134 | 9 | 3 | 12 | 9.0 | 133 | 9 | 3 | 99.3 | 100.0 | |
| SMC068 | 8 | 0 50 56.26 | -73 17 21.1 | 70 | 7.7 | 0.003-0.006 | 121 | 4 | 0 | 4 | 3.3 | 106 | 4 | 0 | 87.6 | 100.0 | |
| SMC069 | 5 | 0 51 14.13 | -73 9 41.5 | 45 | 7.6 | 0.003-0.006 | 139 | 1 | 5 | 6 | 4.3 | 114 | 1 | 4 | 82.0 | 83.3 | |
| SMC069 | 6 | 0 51 14.13 | -73 9 41.5 | 45 | 7.6 | 0.003-0.006 | 108 | 5 | 4 | 9 | 8.3 | 102 | 5 | 4 | 94.4 | 100.0 | |
| SMC069 | 8 | 0 51 14.13 | -73 9 41.5 | 45 | 7.6 | 0.003-0.006 | 65 | 1 | 0 | 1 | 1.5 | 47 | 1 | 0 | 72.3 | 100.0 | |
| SMC070 | 6 | 0 51 26.15 | -73 16 59.8 | 18 | 7.8 | 0.003 | 23 | 1 | 0 | 1 | 4.3 | 22 | 1 | 0 | 95.7 | 100.0 | |
| SMC070 | 8 | 0 51 26.15 | -73 16 59.8 | 18 | 7.8 | 0.003 | 16 | 0 | 0 | 0 | 0.0 | 15 | 0 | 0 | 93.8 | _ |
| Cluster | Image | RA(2000) | DEC(2000) | r | log(t) | Z | aN* | c | d | b | b/a | Ntot | NELS | NELS? | comments | N* | ELS |
|---|---|---|---|---|---|---|---|---|---|---|---|---|---|---|---|---|---|
| WFI | ″ | NELS | NELS? | c+d | % | ogle | ogle | ogle | ogle/wfi | ogle/wfi | |||||||
| SMC071 | 5 | 0 51 31.78 | -73 0 38.3 | 40 | 7.5 | 0.003-0.006 | 96 | 2 | 1 | 3 | 3.1 | 79 | 2 | 1 | 82.3 | 100.0 | |
| SMC071 | 8 | 0 51 31.78 | -73 0 38.3 | 40 | 7.5 | 0.003-0.006 | 24 | 1 | 0 | 1 | 4.2 | 5 | 0 | 0 | 20.8 | 0.0 | |
| SMC072 | 6 | 0 51 41.69 | -73 13 46.8 | 35 | 7.6 | 0.003 | 58 | 4 | 2 | 6 | 10.3 | 57 | 4 | 2 | 98.3 | 100.0 | |
| SMC072 | 8 | 0 51 41.69 | -73 13 46.8 | 35 | 7.6 | 0.003 | 44 | 1 | 2 | 3 | 6.8 | 41 | 1 | 2 | 93.2 | 100.0 | |
| SMC073 | 5 | 0 51 44.03 | -72 50 25.1 | 53 | 8.2 | 0.003 | 162 | 1 | 1 | 2 | 1.2 | 138 | 1 | 1 | 85.2 | 100.0 | |
| SMC073 | 7 | 0 51 44.03 | -72 50 25.1 | 53 | 8.2 | 0.003 | 97 | 0 | 0 | 0 | 0.0 | 39 | 0 | 0 | 40.2 | _ | |
| SMC074 | 5 | 0 51 52.91 | -72 57 13.9 | 53 | 8.1 | 0.003 | 155 | 1 | 1 | 2 | 1.3 | 130 | 1 | 1 | 83.9 | 100.0 | |
| SMC074 | 7 | 0 51 52.91 | -72 57 13.9 | 53 | 8.1 | 0.003 | 85 | 2 | 0 | 2 | 2.4 | 79 | 2 | 0 | 92.9 | 100.0 | |
| SMC074 | 8 | 0 51 52.91 | -72 57 13.9 | 53 | 8.1 | 0.003 | 90 | 1 | 0 | 1 | 1.1 | 37 | 0 | 0 | 41.1 | 0.0 | |
| SMC075 | 8 | 0 51 54.32 | -73 5 52.9 | 19 | 8.4 | 0.003 | 18 | 0 | 0 | 0 | 0.0 | 10 | 0 | 0 | 55.6 | _ | |
| SMC076 | 7 | 0 52 12.47 | -72 31 51.2 | 36 | 7.4 | 0.003 | 19 | 1 | 0 | 1 | 5.3 | 5 | 1 | 0 | 26.3 | 100.0 | |
| SMC077 | 5 | 0 52 13.34 | -73 0 12.2 | 23 | 7.9 | 0.003 | 21 | 0 | 0 | 0 | 0.0 | 19 | 0 | 0 | 90.5 | _ | |
| SMC077 | 8 | 0 52 13.34 | -73 0 12.2 | 23 | 7.9 | 0.003 | 19 | 0 | 0 | 0 | 0.0 | 6 | 0 | 0 | 31.6 | _ | |
| SMC078 | 5 | 0 52 16.56 | -73 1 4 | 45 | 7.9 | 0.003 | 33 | 0 | 0 | 0 | 0.0 | 29 | 0 | 0 | 87.9 | _ | |
| SMC078 | 8 | 0 52 16.56 | -73 1 4 | 45 | 7.9 | 0.003 | 52 | 1 | 0 | 1 | 1.9 | 23 | 0 | 0 | 44.2 | 0.0 | |
| SMC081 | 5 | 0 52 33.65 | -72 40 53.6 | 39 | 7.4 | 0.003 | 55 | 0 | 0 | 0 | 0.0 | 16 | 0 | 0 | 29.1 | _ | |
| SMC081 | 7 | 0 52 33.65 | -72 40 53.6 | 39 | 7.4 | 0.003 | 55 | 0 | 1 | 1 | 1.8 | 23 | 0 | 0 | 41.8 | 0.0 | |
| SMC082 | 7 | 0 52 42.12 | -72 55 31.6 | 45 | 7.8 | 0.003 | 35 | 0 | 1 | 1 | 2.9 | 30 | 0 | 1 | 85.7 | 100.0 | |
| SMC082 | 8 | 0 52 42.12 | -72 55 31.6 | 45 | 7.8 | 0.003 | 54 | 1 | 1 | 2 | 3.7 | 20 | 0 | 0 | 37.0 | 0.0 | |
| SMC083 | 8 | 0 52 44.27 | -72 58 47.8 | 36 | 7.8 | 0.003 | 40 | 2 | 0 | 2 | 5.0 | 15 | 0 | 0 | 37.5 | 0.0 | |
| SMC089 | 7 | 0 53 5.28 | -72 37 27.8 | 143 | 7.3 | 0.003 | 478 | 11 | 9 | 20 | 4.2 | 106 | 2 | 2 | 22.2 | 20.0 | |
| SMC090 | 8 | 0 53 5.59 | -73 22 49.4 | 47 | 8.5 | 0.003 | 100 | 1 | 1 | 2 | 2.0 | 98 | 1 | 1 | 98.0 | 100.0 | |
| SMC092 | 7 | 0 53 17.9 | -72 45 59.5 | 42 | 7.4 | 0.003 | 48 | 0 | 1 | 1 | 2.1 | 18 | 0 | 0 | 37.5 | 0.0 | |
| SMC098 | 8 | 0 54 46.73 | -73 13 24.5 | 45 | 8.0 | 0.003 | 36 | 1 | 3 | 4 | 11.1 | 36 | 1 | 3 | 100.0 | 100.0 | |
| SMC099 | 7 | 0 54 48.24 | -72 27 57.8 | 45 | 7.6 | 0.003 | 64 | 2 | 3 | 5 | 7.8 | 54 | 2 | 3 | 84.4 | 100.0 | |
| SMC104 | 7 | 0 55 32.98 | -72 49 58.1 | 46 | 8.6 | 0.003 | 129 | 2 | 0 | 2 | 1.6 | 120 | 2 | 0 | 93.0 | 100.0 | |
| SMC105 | 7 | 0 55 42.99 | -72 52 48.4 | 55 | 8.0 | 0.003 | 66 | 3 | 2 | 5 | 7.6 | 61 | 3 | 2 | 92.4 | 100.0 | |
| SMC107 | 9 | 0 56 18.68 | -72 27 50.4 | 115 | 7.5 | 0.003 | 404 | 36 | 7 | 43 | 10.6 | 242 | 33 | 7 | 59.9 | 93.0 | |
| SMC109 | 9 | 0 57 29.8 | -72 15 51.9 | 24 | 7.7 | 0.003 | 32 | 2 | 4 | 6 | 18.8 | 28 | 2 | 3 | 87.5 | 83.3 | |
| SMC112 | 9 | 0 57 57.14 | -72 26 42 | 29 | 7.5 | 0.003 | 16 | 0 | 0 | 0 | 0.0 | 8 | 0 | 0 | 50.0 | _ | |
| SMC115 | 9 | 0 58 33.64 | -72 16 51.6 | 15 | 7.3 | 0.003 | 10 | 0 | 1 | 1 | 10.0 | 5 | 0 | 1 | 50.0 | 100.0 | |
| SMC115 | 11 | 0 58 33.64 | -72 16 51.6 | 15 | 7.3 | 0.003 | 13 | 0 | 1 | 1 | 7.7 | 9 | 0 | 1 | 69.2 | 100.0 | |
| SMC117 | 9 | 0 59 13.86 | -72 36 29.3 | 45 | 8.3 | 0.003 | 46 | 1 | 4 | 5 | 10.9 | 40 | 1 | 4 | 87.0 | 100.0 | |
| SMC117 | 12 | 0 59 13.86 | -72 36 29.3 | 45 | 8.3 | 0.003 | 56 | 1 | 0 | 1 | 1.8 | 45 | 1 | 0 | 80.4 | 100.0 | |
| SMC120 | 9 | 1 0 1.33 | -72 22 8.7 | 27 | 7.7 | 0.003 | 34 | 3 | 5 | 8 | 23.5 | 31 | 2 | 3 | 91.2 | 62.5 | |
| SMC120 | 11 | 1 0 1.33 | -72 22 8.7 | 27 | 7.7 | 0.003 | 33 | 4 | 1 | 5 | 15.2 | 14 | 4 | 0 | 42.4 | 80.0 | |
| SMC121 | 9 | 1 0 13.03 | -72 27 43.8 | 30 | 7.9 | 0.003 | 22 | 2 | 1 | 3 | 13.6 | 15 | 2 | 1 | 68.2 | 100.0 | |
| SMC121 | 11 | 1 0 13.03 | -72 27 43.8 | 30 | 7.9 | 0.003 | 23 | 4 | 1 | 5 | 21.7 | 19 | 4 | 1 | 82.6 | 100.0 | |
| SMC121 | 12 | 1 0 13.03 | -72 27 43.8 | 30 | 7.9 | 0.003 | 24 | 4 | 0 | 4 | 16.7 | 19 | 4 | 0 | 79.2 | 100.0 | |
| SMC124 | 9 | 1 0 34.41 | -72 21 55.8 | 34 | 7.6 | 0.003 | 44 | 4 | 4 | 8 | 18.2 | 41 | 4 | 4 | 93.2 | 100.0 | |
| SMC124 | 11 | 1 0 34.41 | -72 21 55.8 | 34 | 7.6 | 0.003 | 35 | 1 | 3 | 4 | 11.4 | 12 | 1 | 1 | 34.3 | 50.0 | |
| SMC126 | 12 | 1 1 2.01 | -72 45 5.2 | 50 | 8.0 | 0.003 | 37 | 2 | 1 | 3 | 8.1 | 34 | 1 | 1 | 91.9 | 66.7 |
| Cluster | Image | RA(2000) | DEC(2000) | r | log(t) | Z | aN* | c | d | b | b/a | Ntot | NELS | NELS? | comments | N* | ELS |
|---|---|---|---|---|---|---|---|---|---|---|---|---|---|---|---|---|---|
| WFI | ″ | NELS | NELS? | c+d | % | ogle | ogle | ogle | ogle/wfi | ogle/wfi | |||||||
| SMC128 | 11 | 1 1 37.15 | -72 24 24.7 | 45 | 7.1 | 0.003-0.006 | 33 | 2 | 1 | 3 | 9.1 | 9 | 1 | 0 | 27.3 | 33.3 | |
| SMC128 | 12 | 1 1 37.15 | -72 24 24.7 | 45 | 7.1 | 0.003-0.006 | 23 | 0 | 0 | 0 | 0.0 | 21 | 0 | 0 | 91.3 | _ | |
| SMC129 | 12 | 1 1 45.08 | -72 33 51.8 | 36 | 7.3 | 0.003-0.006 | 38 | 0 | 2 | 2 | 5.3 | 35 | 0 | 2 | 92.1 | 100.0 | |
| SMC134 | 11 | 1 3 11.52 | -72 16 21 | 35 | 7.8 | 0.003-0.006 | 41 | 9 | 3 | 12 | 29.3 | 39 | 9 | 2 | 95.1 | 91.7 | |
| SMC134 | 13 | 1 3 11.52 | -72 16 21 | 35 | 7.8 | 0.003-0.006 | 26 | 1 | 2 | 3 | 11.5 | 21 | 1 | 2 | 80.8 | 100.0 | |
| SMC137 | 12 | 1 3 22.67 | -72 39 5.6 | 45 | 7.6 | 0.003-0.006 | 48 | 6 | 3 | 9 | 18.8 | 37 | 4 | 2 | 77.1 | 66.7 | |
| SMC138 | 13 | 1 3 53.02 | -72 6 10.5 | 23 | 7.4 | 0.003-0.006 | 21 | 1 | 0 | 1 | 4.8 | 17 | 1 | 0 | 81.0 | 100.0 | |
| SMC139 | 12 | 1 3 53.44 | -72 49 34.2 | 25 | 7.5 | 0.003-0.006 | 78 | 10 | 3 | 13 | 16.7 | 67 | 8 | 2 | 85.9 | 76.9 | |
| SMC140 | 12 | 1 4 14.1 | -72 38 49.1 | 31 | 7.2 | 0.003-0.006 | 26 | 2 | 1 | 3 | 11.5 | 22 | 1 | 1 | 84.6 | 66.7 | |
| SMC140 | 14 | 1 4 14.1 | -72 38 49.1 | 31 | 7.2 | 0.003-0.006 | 18 | 0 | 0 | 0 | 0.0 | 4 | 0 | 0 | 22.2 | _ | |
| SMC141 | 12 | 1 4 30.18 | -72 37 9.4 | 43 | 8.2 | 0.003-0.006 | 46 | 2 | 0 | 2 | 4.3 | 42 | 2 | 0 | 91.3 | 100.0 | |
| SMC141 | 14 | 1 4 30.18 | -72 37 9.4 | 43 | 8.2 | 0.003-0.006 | 7 | 0 | 0 | 0 | 0.0 | 2 | 0 | 0 | 28.6 | _ | |
| SMC142 | 11 | 1 4 36.21 | -72 9 38.5 | 51 | 7.3 | 0.003-0.006 | 108 | 4 | 1 | 5 | 4.6 | 91 | 1 | 1 | 2 | 84.3 | 40.0 |
| SMC142 | 13 | 1 4 36.21 | -72 9 38.5 | 51 | 7.3 | 0.003-0.006 | 26 | 0 | 1 | 1 | 3.8 | 7 | 0 | 0 | 26.9 | 0.0 | |
| SMC143 | 11 | 1 4 39.61 | -72 32 59.7 | 34 | 8.2 | 0.003-0.006 | 15 | 0 | 0 | 0 | 0.0 | 3 | 0 | 0 | 20.0 | _ | |
| SMC143 | 12 | 1 4 39.61 | -72 32 59.7 | 34 | 8.2 | 0.003-0.006 | 28 | 1 | 0 | 1 | 3.6 | 26 | 1 | 0 | 92.9 | 100.0 | |
| SMC144 | 11 | 1 4 5.23 | -72 7 14.6 | 23 | 7.6 | 0.003-0.006 | 15 | 2 | 0 | 2 | 13.3 | 12 | 2 | 0 | 80.0 | 100.0 | |
| SMC144 | 13 | 1 4 5.23 | -72 7 14.6 | 23 | 7.6 | 0.003-0.006 | 12 | 0 | 0 | 0 | 0.0 | 2 | 0 | 0 | 16.7 | _ | |
| SMC145 | 13 | 1 5 4.3 | -71 59 24.8 | 23 | 7.9 | 0.003-0.006 | 9 | 1 | 0 | 1 | 11.1 | 4 | 1 | 0 | 44.4 | 100.0 | |
| SMC146 | 13 | 1 5 13.4 | -71 59 41.8 | 18 | 7.3 | 0.003-0.006 | 7 | 0 | 0 | 0 | 0.0 | 5 | 0 | 0 | 71.4 | _ | |
| SMC147 | 13 | 1 5 7.95 | -71 59 45.1 | 27 | 7.1 | 0.003-0.006 | 13 | 0 | 1 | 1 | 7.7 | 11 | 0 | 1 | 84.6 | 100.0 | |
| SMC149 | 11 | 1 5 21.51 | -72 2 34.7 | 45 | 8.2 | 0.003-0.006 | 162 | 3 | 1 | 4 | 2.5 | 20 | 1 | 0 | 12.3 | 25.0 | |
| SMC149 | 13 | 1 5 21.51 | -72 2 34.7 | 45 | 8.2 | 0.003-0.006 | 144 | 1 | 1 | 2 | 1.4 | 112 | 1 | 1 | 77.8 | 100.0 | |
| SMC153 | 13 | 1 6 47.74 | -72 16 24.5 | 34 | 7.2 | 0.003-0.006 | 37 | 2 | 1 | 3 | 8.1 | 12 | 0 | 0 | 32.4 | 0.0 | |
| SMC154 | 14 | 1 7 2.27 | -72 37 18.2 | 41 | 8.2 | 0.003-0.006 | 14 | 0 | 0 | 0 | 0.0 | 2 | 0 | 0 | 14.3 | _ | |
| SMC155 | 14 | 1 7 27.83 | -72 29 35.5 | 51 | 7.7 | 0.003-0.006 | 41 | 3 | 0 | 3 | 7.3 | 38 | 3 | 0 | 92.7 | 100.0 | |
| SMC156 | 14 | 1 7 28.47 | -72 46 9.5 | 51 | 8.2 | 0.003-0.006 | 51 | 0 | 2 | 2 | 3.9 | 48 | 0 | 2 | 94.1 | 100.0 | |
| SMC160 | 13 | 1 8 37.48 | -72 26 20.9 | 25 | 7.6 | 0.003-0.006 | 16 | 0 | 1 | 1 | 6.3 | 7 | 0 | 0 | 43.8 | 0.0 | |
| SMC160 | 14 | 1 8 37.48 | -72 26 20.9 | 25 | 7.6 | 0.003-0.006 | 7 | 0 | 1 | 1 | 14.3 | 4 | 0 | 0 | 57.1 | 0.0 | |
| SMC177 | 4 | 0 44 55.05 | -73 10 27.4 | 11 | 7.9 | 0.003-0.006 | 14 | 0 | 0 | 0 | 0.0 | 13 | 0 | 0 | 92.9 | _ | |
| SMC187 | 4 | 0 47 5.87 | -73 22 16.6 | 17 | 8.2 | 0.003-0.006 | 12 | 1 | 0 | 1 | 8.3 | 12 | 1 | 0 | 100.0 | 100.0 | |
| SMC187 | 6 | 0 47 5.87 | -73 22 16.6 | 18 | 8.2 | 0.003-0.006 | 9 | 1 | 0 | 1 | 11.1 | 9 | 1 | 0 | 100.0 | 100.0 |
| Cluster | Image | RA(2000) | DEC(2000) | r | log(t) | Z | aN* | c | d | b | b/a | Ntot | NELS | NELS? | comments | N* | ELS |
|---|---|---|---|---|---|---|---|---|---|---|---|---|---|---|---|---|---|
| WFI | ″ | NELS | NELS? | c+d | % | ogle | ogle | ogle | ogle/wfi | ogle/wfi | |||||||
| SMC194 | 6 | 0 49 5.58 | -73 21 9.8 | 19 | 7.9 | 0.003-0.006 | 14 | 0 | 1 | 1 | 7.1 | 10 | 0 | 1 | 71.4 | 100.0 | |
| SMC195 | 6 | 0 49 16.45 | -73 14 56.8 | 15 | 7.3 | 0.003-0.006 | 17 | 0 | 0 | 0 | 0.0 | 12 | 0 | 0 | 70.6 | _ | |
| SMC198 | 5 | 0 50 7.51 | -73 11 25.9 | 30 | 7.9 | 0.003-0.006 | 51 | 0 | 2 | 2 | 3.9 | 49 | 0 | 2 | 96.1 | 100.0 | |
| SMC198 | 6 | 0 50 7.51 | -73 11 25.9 | 30 | 7.9 | 0.003-0.006 | 45 | 3 | 1 | 4 | 8.9 | 45 | 3 | 1 | 100.0 | 100.0 | |
| SMC200 | 5 | 0 50 38.98 | -72 58 43.6 | 9 | 8.0 | 0.003-0.006 | 10 | 0 | 0 | 0 | 0.0 | 10 | 0 | 0 | 100.0 | _ | |
| SMC210 | 8 | 0 52 30.3 | -73 2 59 | 15 | 8.2 | 0.003 | 10 | 0 | 0 | 0 | 0.0 | 2 | 0 | 0 | 20.0 | _ | |
| SMC230 | 11 | 1 0 33.15 | -72 15 30.5 | 9 | 7.5 | 0.003 | 5 | 0 | 0 | 0 | 0.0 | 1 | 0 | 0 | 20.0 | _ |
1: SMC17 & SMC18 have common stars since it appears to be a binary-cluster.
2: The extracted spectrum of the candidate emission-line star is a blend of 2 emission-line stars spectra.
a:N*: This column correspond to the total number of stars/spectra extracted.
c:NELS: This column gives the number of definite emission-line stars found.
d:NELS?: this column gives the number of candidate emission-line stars found.
b:c+d: This column gives the total number of (definite+candidate) emission line stars.
b/a %: This column gives the proportion in % of emission-line stars to the whole sample by open cluster.
| Cluster | Nabs | NELS | NELS? | NELS | Be | Be? | B | Oe | O | Ae | A | OeBeAe | OBA | ELS main sequence | ||||||
|---|---|---|---|---|---|---|---|---|---|---|---|---|---|---|---|---|---|---|---|---|
| ogle | ogle | ogle | no ogle | % | % | % | not OBA | |||||||||||||
| SMC002 | 25 | 0 | 1 | 0 | 3.8 | 0 | 1 | 3 | 0.00 | 25.00 | 3 | 0.00 | 1 | 6 | 14.29 | |||||
| SMC008 | 110 | 4 | 2 | 0 | 5.2 | 1 | 1 | 55 | 1.75 | 3.51 | 1 | 0.00 | 9 | 0.00 | 2 | 65 | 2.99 | 4 | ||
| SMC009 | 60 | 1 | 2 | 0 | 4.8 | 1 | 2 | 34 | 2.70 | 8.11 | 2 | 0.00 | 3 | 36 | 7.69 | |||||
| SMC011 | 64 | 3 | 3 | 0 | 8.6 | 3 | 2 | 22 | 11.11 | 18.52 | 1 | 0.00 | 1 | 4 | 20.00 | 6 | 27 | 18.18 | ||
| SMC012 | 65 | 0 | 0 | 2 | 3.0 | 0 | 3 | 0.00 | 0.00 | 2 | 0.00 | 0 | 5 | 0.00 | ||||||
| SMC015 | 94 | 3 | 2 | 0 | 5.1 | 1 | 1 | 25 | 3.70 | 7.41 | 15 | 0.00 | 2 | 40 | 4.76 | 3 | ||||
| SMC016 | 111 | 0 | 1 | 0 | 0.9 | 0 | 1 | 22 | 0.00 | 4.35 | 1 | 0.00 | 11 | 0.00 | 1 | 34 | 2.86 | |||
| SMC017 | 62 | 1 | 0 | 0 | 1.6 | 0 | 23 | 0.00 | 0.00 | 1 | 1 | 50.00 | 6 | 0.00 | 1 | 30 | 3.23 | |||
| SMC018 | 55 | 1 | 0 | 0 | 1.8 | 1 | 21 | 4.55 | 4.55 | 2 | 0.00 | 1 | 23 | 4.17 | 1 | |||||
| SMC019 | 7 | 0 | 0 | 0 | 0.0 | _ | 0 | 0 | 2 | |||||||||||
| SMC020 | 7 | 0 | 0 | 0 | 0.0 | _ | 1 | 0.00 | 0 | 1 | 0.00 | |||||||||
| SMC025 | 29 | 0 | 0 | 0 | 0.0 | 15 | 0.00 | 0.00 | 0 | 15 | 0.00 | |||||||||
| SMC032 | 39 | 0 | 0 | 0 | 0.0 | 11 | 0.00 | 0.00 | 1 | 0.00 | 0 | 12 | 0.00 | |||||||
| SMC033 | 8 | 0 | 1 | 0 | 11.1 | 6 | 0.00 | 0.00 | 1 | 100.00 | 1 | 6 | 14.29 | |||||||
| SMC038 | 64 | 0 | 0 | 0 | 0.0 | 17 | 0.00 | 0.00 | 4 | 0.00 | 0 | 21 | 0.00 | |||||||
| SMC039 | 182 | 4 | 7 | 0 | 5.7 | 1 | 4 | 46 | 1.96 | 9.80 | 2 | 15 | 11.76 | 7 | 61 | 10.29 | 4 | |||
| SMC043 | 53 | 1 | 1 | 0 | 3.6 | 1 | 16 | 0.00 | 5.88 | 6 | 0.00 | 1 | 22 | 4.35 | 1 | |||||
| SMC047 | 17 | 0 | 2 | 1 | 15.0 | 1 | 3 | 0.00 | 25.00 | 1 | 3 | 25.00 | 1 | |||||||
| SMC049 | 55 | 2 | 4 | 1 | 11.3 | 1 | 1 | 17 | 5.26 | 10.53 | 1 | 5 | 16.67 | 3 | 22 | 12.00 | 3 | |||
| SMC054 | 38 | 3 | 2 | 0 | 11.6 | 2 | 1 | 17 | 10.00 | 15.00 | 1 | 0.00 | 4 | 0.00 | 3 | 22 | 12.00 | 2 | ||
| SMC059 | 25 | 0 | 0 | 0 | 0.0 | 9 | 0.00 | 0.00 | 0 | 9 | 0.00 | |||||||||
| SMC061 | 37 | 1 | 4 | 0 | 11.9 | 2 | 19 | 0.00 | 9.52 | 2 | 0.00 | 2 | 21 | 8.70 | 3 | |||||
| SMC064 | 105 | 3 | 4 | 1 | 7.1 | 2 | 4 | 45 | 3.92 | 11.76 | 1 | 0.00 | 6 | 46 | 11.54 | 1 | ||||
| SMC066 | 2 | 0 | 1 | 0 | 33.3 | 1 | 0.00 | 100.00 | 1 | 0.00 | 1 | 1 | ||||||||
| SMC067 | 94 | 1 | 2 | 0 | 3.1 | 1 | 34 | 2.86 | 2.86 | 1 | 0.00 | 1 | 35 | 2.78 | 2 | |||||
| SMC068 | 142 | 11 | 3 | 0 | 9.0 | 8 | 1 | 55 | 12.50 | 14.06 | 1 | 0.00 | 4 | 0.00 | 9 | 60 | 13.04 | 5 | ||
| SMC069 | 164 | 5 | 7 | 0 | 6.8 | 4 | 5 | 55 | 6.25 | 14.06 | 2 | 0.00 | 13 | 0.00 | 9 | 70 | 11.39 | 3 | ||
| SMC070 | 24 | 1 | 0 | 0 | 4.0 | 9 | 0.00 | 0.00 | 1 | 0.00 | 0 | 10 | 0.00 | 1 | ||||||
| SMC071 | 81 | 2 | 1 | 0 | 3.6 | 1 | 24 | 4.00 | 4.00 | 1 | 1 | 50.00 | 2 | 25 | 7.41 | 1 | ||||
| SMC072 | 60 | 4 | 2 | 0 | 9.1 | 3 | 1 | 15 | 15.79 | 21.05 | 4 | 0.00 | 4 | 19 | 17.39 | 2 | ||||
| SMC073 | 161 | 1 | 1 | 0 | 1.2 | 1 | 60 | 1.64 | 1.64 | 10 | 0.00 | 1 | 70 | 1.41 | 1 | |||||
| SMC074 | 183 | 1 | 2 | 0 | 1.6 | 1 | 34 | 2.86 | 2.86 | 1 | 0.00 | 17 | 0.00 | 1 | 52 | 1.89 | 2 | |||
| SMC075 | 10 | 0 | 0 | 0 | 0.0 | 5 | 0.00 | 0.00 | 2 | 0.00 | 0 | 7 | 0.00 | |||||||
| SMC076 | 4 | 1 | 0 | 0 | 20.0 | 1 | 0.00 | 0.00 | 0 | 1 | 0.00 | 1 | ||||||||
| SMC077 | 24 | 0 | 0 | 0 | 0.0 | 8 | 0.00 | 0.00 | 1 | 0.00 | 0 | 9 | 0.00 | |||||||
| SMC078 | 52 | 0 | 0 | 1 | 1.9 | 17 | 0.00 | 0.00 | 7 | 0.00 | 0 | 24 | 0.00 | |||||||
| SMC081 | 38 | 0 | 0 | 1 | 2.6 | 4 | 0.00 | 0.00 | 7 | 0.00 | 0 | 11 | 0.00 | |||||||
| SMC082 | 45 | 0 | 2 | 1 | 6.3 | 9 | 0.00 | 0.00 | 4 | 0.00 | 0 | 13 | 0.00 | 2 |
| Cluster | Nabs | NELS | NELS? | NELS | Be | Be? | B | Oe | O | Ae | A | OeBeAe | OBA | ELS main sequence | ||||||
|---|---|---|---|---|---|---|---|---|---|---|---|---|---|---|---|---|---|---|---|---|
| ogle | ogle | ogle | no ogle | % | % | % | not OBA | |||||||||||||
| SMC083 | 15 | 0 | 0 | 2 | 11.8 | 3 | 0.00 | 0.00 | 4 | 0.00 | 0 | 7 | 0.00 | |||||||
| SMC089 | 102 | 2 | 2 | 16 | 16.4 | 1 | 16 | 5.88 | 5.88 | 1 | 6 | 14.29 | 2 | 22 | 8.33 | 2 | ||||
| SMC090 | 96 | 1 | 1 | 0 | 2.0 | 9 | 0.00 | 0.00 | 1 | 0.00 | 0 | 10 | 0.00 | 2 | ||||||
| SMC092 | 18 | 0 | 0 | 1 | 5.3 | 7 | 0.00 | 0.00 | 1 | 0.00 | 0 | 8 | 0.00 | |||||||
| SMC098 | 32 | 1 | 3 | 0 | 11.1 | 6 | 0.00 | 0.00 | 2 | 0.00 | 0 | 8 | 0.00 | 4 | ||||||
| SMC099 | 49 | 2 | 3 | 0 | 9.3 | 1 | 1 | 25 | 3.70 | 7.41 | 1 | 0.00 | 2 | 26 | 7.14 | 3 | ||||
| SMC104 | 118 | 2 | 0 | 0 | 1.7 | 1 | 15 | 6.25 | 6.25 | 6 | 0.00 | 1 | 21 | 4.55 | 1 | |||||
| SMC105 | 56 | 3 | 2 | 0 | 8.2 | 1 | 7 | 12.50 | 12.50 | 1 | 1 | 50.00 | 2 | 0.00 | 2 | 10 | 16.67 | 3 | ||
| SMC107 | 202 | 33 | 7 | 3 | 17.6 | 25 | 6 | 92 | 20.33 | 25.20 | 1 | 100.00 | 16 | 0.00 | 32 | 108 | 22.86 | 8 | ||
| SMC109 | 23 | 2 | 3 | 0 | 17.9 | 1 | 1 | 6 | 12.50 | 25.00 | 2 | 6 | 25.00 | 3 | ||||||
| SMC112 | 8 | 0 | 0 | 0 | 0.0 | 4 | 0.00 | 0.00 | 1 | 0.00 | 0 | 5 | 0.00 | |||||||
| SMC115 | 11 | 0 | 1 | 0 | 8.3 | 1 | 3 | 0.00 | 25.00 | 1 | 0.00 | 1 | 4 | 20.00 | ||||||
| SMC117 | 60 | 2 | 4 | 0 | 9.1 | 2 | 16 | 11.11 | 11.11 | 4 | 0.00 | 2 | 20 | 9.09 | 4 | |||||
| SMC120 | 30 | 3 | 3 | 0 | 16.7 | 3 | 2 | 12 | 17.65 | 29.41 | 2 | 0.00 | 5 | 14 | 26.32 | 1 | ||||
| SMC121 | 23 | 5 | 2 | 0 | 23.3 | 3 | 1 | 9 | 23.08 | 30.77 | 4 | 0.00 | 4 | 13 | 23.53 | 3 | ||||
| SMC124 | 36 | 4 | 5 | 0 | 20.0 | 4 | 3 | 17 | 16.67 | 29.17 | 2 | 0.00 | 1 | 0.00 | 7 | 20 | 25.93 | 2 | ||
| SMC126 | 32 | 1 | 1 | 1 | 8.6 | 1 | 1 | 11 | 7.69 | 15.38 | 1 | 0.00 | 1 | 0.00 | 2 | 13 | 13.33 | |||
| SMC128 | 27 | 1 | 0 | 2 | 10.0 | 1 | 13 | 7.14 | 7.14 | 1 | 13 | 7.14 | ||||||||
| SMC129 | 33 | 0 | 2 | 0 | 5.7 | 17 | 0.00 | 0.00 | 2 | 0.00 | 0 | 19 | 0.00 | 2 | ||||||
| SMC134 | 30 | 9 | 2 | 1 | 28.6 | 9 | 2 | 19 | 30.00 | 36.67 | 2 | 0.00 | 11 | 21 | 34.38 | |||||
| SMC137 | 31 | 4 | 2 | 3 | 22.5 | 4 | 2 | 20 | 15.38 | 23.08 | 6 | 20 | 23.08 | |||||||
| SMC138 | 16 | 1 | 0 | 0 | 5.9 | 1 | 11 | 8.33 | 8.33 | 1 | 11 | 8.33 | ||||||||
| SMC139 | 57 | 8 | 2 | 3 | 18.6 | 8 | 31 | 20.51 | 20.51 | 1 | 0.00 | 8 | 32 | 20.00 | 2 | |||||
| SMC140 | 22 | 1 | 1 | 1 | 12.0 | 1 | 1 | 11 | 7.69 | 15.38 | 1 | 0.00 | 2 | 12 | 14.29 | |||||
| SMC141 | 42 | 2 | 0 | 0 | 4.5 | 18 | 0.00 | 0.00 | 1 | 100.00 | 1 | 18 | 5.26 | 1 | ||||||
| SMC142 | 90 | 1 | 1 | 3 | 5.3 | 1 | 58 | 1.69 | 1.69 | 1 | 0.00 | 3 | 0.00 | 1 | 62 | 1.59 | 1 | |||
| SMC143 | 28 | 1 | 0 | 0 | 3.4 | 1 | 13 | 7.14 | 7.14 | 2 | 0.00 | 1 | 15 | 6.25 | ||||||
| SMC144 | 10 | 2 | 0 | 0 | 16.7 | 2 | 8 | 20.00 | 20.00 | 2 | 8 | 20.00 | ||||||||
| SMC145 | 3 | 1 | 0 | 0 | 25.0 | 3 | 0.00 | 0.00 | 0 | 3 | 0.00 | 1 | ||||||||
| SMC146 | 5 | 0 | 0 | 0 | 0.0 | 4 | 0.00 | 0.00 | 0 | 4 | 0.00 | |||||||||
| SMC147 | 10 | 0 | 1 | 0 | 9.1 | 1 | 8 | 0.00 | 11.11 | 1 | 8 | 11.11 | ||||||||
| SMC149 | 127 | 2 | 1 | 0 | 2.3 | 48 | 0.00 | 0.00 | 1 | 15 | 6.25 | 1 | 63 | 1.56 | 2 | |||||
| SMC153 | 12 | 0 | 0 | 3 | 20.0 | 3 | 0.00 | 0.00 | 2 | 0.00 | 0 | 5 | 0.00 | |||||||
| SMC154 | 2 | 0 | 0 | 0 | 0.0 | _ | 0 | 0 | ||||||||||||
| SMC155 | 35 | 3 | 0 | 0 | 7.9 | 3 | 19 | 13.64 | 13.64 | 3 | 19 | 13.64 | ||||||||
| SMC156 | 46 | 0 | 2 | 0 | 4.2 | 13 | 0.00 | 0.00 | 1 | 0.00 | 0 | 14 | 0.00 | 2 |
| Cluster | Nabs | NELS | NELS? | NELS | Be | Be? | B | Oe | O | Ae | A | OeBeAe | OBA | ELS main sequence | ||||||
|---|---|---|---|---|---|---|---|---|---|---|---|---|---|---|---|---|---|---|---|---|
| ogle | ogle | ogle | no ogle | % | % | % | not OBA | |||||||||||||
| SMC160 | 11 | 0 | 0 | 2 | 15.4 | 6 | 0.00 | 0.00 | 0 | 6 | 0.00 | |||||||||
| SMC177 | 13 | 0 | 0 | 0 | 0.0 | 5 | 0.00 | 0.00 | 1 | 0.00 | 0 | 6 | 0.00 | |||||||
| SMC187 | 13 | 1 | 0 | 0 | 7.1 | 3 | 0.00 | 0.00 | 1 | 100.00 | 1 | 3 | 25.00 | 2 | ||||||
| SMC194 | 9 | 0 | 1 | 0 | 10.0 | 5 | 0.00 | 0.00 | 1 | 0.00 | 0 | 6 | 0.00 | 1 | ||||||
| SMC195 | 12 | 0 | 0 | 0 | 0.0 | 4 | 0.00 | 0.00 | 2 | 0.00 | 0 | 6 | 0.00 | |||||||
| SMC198 | 64 | 3 | 2 | 0 | 7.2 | 3 | 2 | 23 | 10.71 | 17.86 | 1 | 0.00 | 3 | 0.00 | 5 | 27 | 15.63 | |||
| SMC200 | 10 | 0 | 0 | 0 | 0.0 | 2 | 0.00 | 0.00 | 0 | 2 | 0.00 | |||||||||
| SMC210 | 2 | 0 | 0 | 0 | 0.0 | 1 | 0.00 | 0.00 | 0 | 1 | 0.00 | |||||||||
| SMC230 | 1 | 0 | 0 | 0 | 0.0 | 1 | 0.00 | 0.00 | 0 | 1 | 0.00 |
Appendix C Tables of Oe/Be/Ae stars, and other emission-line star
The following tables include information (astrometry, apparent and dereddened photometry, classification, etc.) for each emission-line star found.
| Cluster | Image | Image | ID | ID | r | RA(2000) | DEC(2000) | RA(2000) | DEC(2000) | V | B | I | B-V | V-I | E[B-V] | log(t) | Mult |
|---|---|---|---|---|---|---|---|---|---|---|---|---|---|---|---|---|---|
| WFI | Ogle | WFI | Ogle | ″ | WFI | WFI | Ogle | Ogle | |||||||||
| SMC8 | 2 | sc2 | 34940 | 35350 | 0.7 | 0 40 36.853 | -73 23 42.137 | 0 40 36.950 | -73 23 41.900 | 16.978 | 16.857 | 16.911 | -0.120 | 0.067 | 0.070 | 8 | 2 |
| SMC9 | 2 | sc2 | 35267 | 35310 | 0.7 | 0 40 48.606 | -73 23 39.151 | 0 40 48.700 | -73 23 38.900 | 16.420 | 16.360 | 16.226 | -0.060 | 0.194 | 0.070 | 8 | 1 |
| SMC11 | 2 | sc2 | 39854 | 61751 | 0.7 | 0 41 6.708 | -73 21 10.595 | 0 41 6.770 | -73 21 10.300 | 16.566 | 16.529 | 16.464 | -0.037 | 0.102 | 0.080 | 7.9 | 1 |
| SMC11 | 2 | sc2 | 40737 | 64032 | 0.7 | 0 41 8.835 | -73 20 43.105 | 0 41 8.910 | -73 20 42.800 | 17.113 | 17.053 | 17.046 | -0.060 | 0.067 | 0.080 | 7.9 | 2 |
| SMC11 | 2 | sc2 | 40443 | 64100 | 0.8 | 0 40 57.870 | -73 20 45.337 | 0 40 57.960 | -73 20 45.000 | 17.436 | 17.385 | 17.387 | -0.051 | 0.049 | 0.080 | 7.9 | 1 |
| SMC15 | 1 | sc3 | 8873 | 19972 | 1.0 | 0 42 54.158 | -73 17 47.769 | 0 42 54.110 | -73 17 47.200 | 16.104 | 16.222 | 15.864 | 0.118 | 0.240 | 0.100 | 8.1 | 2 |
| SMC18 | 2 | sc3 | 33376 | 63443 | 1.2 | 0 43 43.301 | -73 26 37.750 | 0 43 43.280 | -73 26 36.900 | 16.372 | 16.325 | 16.211 | -0.047 | 0.161 | 0.100 | 7.9 | 1 |
| SMC39 | 4 | sc4 | 17655 | 101253 | 0.9 | 0 47 23.027 | -73 28 54.319 | 0 47 23.200 | -73 28 54.200 | 16.426 | 16.345 | 16.387 | -0.080 | 0.038 | 0.110 | 8 | 2 |
| SMC49 | 6 | sc5 | 18899 | 11574 | 1.3 | 0 48 33.723 | -73 25 18.021 | 0 48 33.930 | -73 25 17.600 | 17.238 | 17.053 | 17.373 | -0.184 | -0.135 | 0.060 | 7 | 1 |
| SMC54 | 6 | sc5 | 26334 | 95248 | 1.0 | 0 49 12.561 | -73 21 56.704 | 0 49 12.710 | -73 21 56.500 | 15.794 | 15.783 | 15.619 | -0.012 | 0.175 | 0.100 | 8 | 1 |
| SMC54 | 6 | sc5 | 26058 | 95331 | 1.1 | 0 49 23.815 | -73 22 12.458 | 0 49 24.000 | -73 22 12.400 | 17.526 | 17.665 | 17.333 | 0.138 | 0.193 | 0.100 | 8 | 1 |
| SMC64 | 5 | sc5 | 30728 | 208058 | 0.8 | 0 50 36.928 | -72 58 17.085 | 0 50 36.880 | -72 58 17.300 | 16.510 | 16.445 | 16.362 | -0.064 | 0.148 | 0.100 | 8.1 | 1 |
| SMC64 | 5 | sc5 | 30064 | 208208 | 0.6 | 0 50 36.668 | -72 58 37.235 | 0 50 36.640 | -72 58 37.400 | 17.217 | 17.316 | 17.022 | 0.099 | 0.194 | 0.100 | 8.1 | 1 |
| SMC67 | 5 | sc5 | 57461 | 235272 | 0.7 | 0 50 44.547 | -72 43 22.924 | 0 50 44.520 | -72 43 23.000 | 17.515 | 17.479 | 17.469 | -0.036 | 0.046 | 0.080 | 8.2 | 1 |
| SMC68 | 6 | sc5 | 35590 | 180008 | 0.7 | 0 50 47.928 | -73 18 17.873 | 0 50 47.990 | -73 18 17.600 | 15.303 | 15.353 | 15.087 | 0.049 | 0.216 | 0.090 | 7.7 | 1 |
| SMC68 | 6 | sc5 | 35764 | 180009 | 0.7 | 0 50 47.697 | -73 18 12.931 | 0 50 47.760 | -73 18 12.600 | 15.769 | 15.787 | 15.527 | 0.018 | 0.242 | 0.090 | 7.7 | 1 |
| SMC68 | 6 | sc5 | 38010 | 260813 | 0.6 | 0 50 59.652 | -73 17 20.172 | 0 50 59.670 | -73 17 19.900 | 15.169 | 15.188 | 14.860 | 0.019 | 0.309 | 0.090 | 7.7 | 2 |
| SMC68 | 6 | sc5 | 36917 | 260959 | 0.8 | 0 50 51.930 | -73 17 42.433 | 0 50 52.010 | -73 17 42.100 | 16.485 | 16.345 | 16.569 | -0.139 | -0.084 | 0.090 | 7.7 | 1 |
| SMC68 | 6 | sc5 | 37293 | 260859 | 0.6 | 0 51 3.689 | -73 17 40.805 | 0 51 3.690 | -73 17 40.500 | 16.522 | 16.500 | 16.286 | -0.023 | 0.236 | 0.090 | 7.7 | 2 |
| SMC68 | 8 | sc5 | 14944 | 180226 | 0.6 | 0 50 43.369 | -73 16 47.113 | 0 50 43.420 | -73 16 46.900 | 16.513 | 16.420 | 16.463 | -0.094 | 0.051 | 0.090 | 7.7 | 1 |
| SMC68 | 6 | sc5 | 38765 | 260985 | 0.7 | 0 50 59.102 | -73 17 0.754 | 0 50 59.160 | -73 17 0.400 | 16.895 | 16.819 | 16.821 | -0.076 | 0.074 | 0.090 | 7.7 | 1 |
| SMC68 | 6 | sc5 | 39644 | 260998 | 0.6 | 0 50 58.294 | -73 16 36.576 | 0 50 58.310 | -73 16 36.300 | 17.386 | 17.312 | 17.288 | -0.074 | 0.098 | 0.090 | 7.7 | 1 |
| SMC69 | 5 | sc5 | 7935 | 271170 | 1.1 | 0 51 20.675 | -73 9 18.808 | 0 51 20.580 | -73 9 19.200 | 15.987 | 15.957 | 15.761 | -0.030 | 0.226 | 0.080 | 7.6 | 2 |
| SMC69 | 5 | sc5 | 6201 | 271315 | 1.1 | 0 51 7.163 | -73 9 56.045 | 0 51 7.060 | -73 9 56.400 | 17.032 | 17.035 | 16.919 | 0.003 | 0.112 | 0.080 | 7.6 | 1 |
| SMC69 | 5 | sc5 | 5670 | 271299 | 1.2 | 0 51 12.127 | -73 10 15.705 | 0 51 12.020 | -73 10 16.000 | 17.324 | 17.251 | 17.283 | -0.073 | 0.041 | 0.080 | 7.6 | 1 |
| SMC69 | 5 | sc5 | 6818 | 271325 | 0.4 | 0 51 12.511 | -73 9 43.791 | 0 51 12.490 | -73 9 44.000 | 16.937 | 16.877 | 16.870 | -0.060 | 0.068 | 0.080 | 7.6 | 1 |
| SMC71 | 5 | sc5 | 27502 | 289148 | 0.9 | 0 51 26.709 | -73 0 23.158 | 0 51 26.650 | -73 0 23.400 | 17.811 | 17.705 | 17.646 | -0.107 | 0.166 | 0.070 | 7.5 | 1 |
| SMC72 | 6 | sc6 | 46694 | 17275 | 0.7 | 0 51 43.176 | -73 13 52.670 | 0 51 43.190 | -73 13 52.300 | 14.856 | 14.817 | 14.769 | -0.040 | 0.088 | 0.080 | 7.6 | 2 |
| SMC72 | 6 | sc6 | 46921 | 17305 | 0.9 | 0 51 44.584 | -73 13 45.327 | 0 51 44.540 | -73 13 44.900 | 15.620 | 15.552 | 15.470 | -0.068 | 0.149 | 0.080 | 7.6 | 2 |
| SMC72 | 6 | sc6 | 47659 | 17307 | 1.0 | 0 51 43.688 | -73 13 40.586 | 0 51 43.640 | -73 13 40.100 | 15.617 | 15.373 | 15.689 | -0.244 | -0.072 | 0.080 | 7.6 | 1 |
| SMC73 | 5 | sc6 | 46610 | 61571 | 0.3 | 0 51 40.553 | -72 50 9.130 | 0 51 40.560 | -72 50 9.200 | 17.363 | 17.301 | 17.271 | -0.064 | 0.093 | 0.110 | 8.2 | 1 |
| SMC74 | 5 | sc6 | 35145 | 49150 | 0.7 | 0 51 55.844 | -72 56 57.122 | 0 51 55.800 | -72 56 57.500 | 15.703 | 15.672 | 15.430 | -0.030 | 0.272 | 0.090 | 8.1 | 3 |
| SMC89 | 7 | sc6 | 40369 | 242010 | 1.5 | 0 53 2.839 | -72 38 49.031 | 0 53 2.950 | -72 38 48.600 | 16.412 | 16.261 | 16.437 | -0.150 | -0.025 | 0.090 | 7.3 | 1 |
| SMC99 | 7 | sc7 | 58735 | 70868 | 1.4 | 0 54 40.620 | -72 27 52.424 | 0 54 40.730 | -72 27 52.300 | 16.012 | 15.972 | 15.897 | -0.040 | 0.115 | 0.080 | 7.6 | 1 |
| SMC104 | 7 | sc7 | 22294 | 110315 | 0.8 | 0 55 33.234 | -72 50 13.211 | 0 55 33.290 | -72 50 12.900 | 17.521 | 17.579 | 17.424 | 0.058 | 0.096 | 0.120 | 8.6 | 1 |
| SMC105 | 7 | sc7 | 16723 | 110195 | 0.6 | 0 55 44.220 | -72 53 4.162 | 0 55 44.260 | -72 53 3.900 | 17.206 | 17.167 | 17.155 | -0.039 | 0.051 | 0.110 | 8 | 1 |
| Cluster | Image | Image | ID | ID | r | RA(2000) | DEC(2000) | RA(2000) | DEC(2000) | V | B | I | B-V | V-I | E[B-V] | log(t) | Mult |
|---|---|---|---|---|---|---|---|---|---|---|---|---|---|---|---|---|---|
| WFI | Ogle | WFI | Ogle | ″ | WFI | WFI | Ogle | Ogle | |||||||||
| SMC107 | 9 | sc7 | 36804 | 205918 | 1.4 | 0 56 14.797 | -72 28 47.857 | 0 56 14.900 | -72 28 47.400 | 15.350 | 15.296 | 15.221 | -0.054 | 0.129 | 0.100 | 7.5 | 1 |
| SMC107 | 9 | sc7 | 37317 | 205923 | 1.6 | 0 56 17.606 | -72 28 32.697 | 0 56 17.720 | -72 28 32.200 | 15.682 | 15.635 | 15.551 | -0.047 | 0.131 | 0.100 | 7.5 | 1 |
| SMC107 | 9 | sc7 | 38203 | 205925 | 1.3 | 0 56 26.511 | -72 28 9.711 | 0 56 26.600 | -72 28 9.200 | 15.702 | 15.652 | 15.561 | -0.050 | 0.140 | 0.100 | 7.5 | 1 |
| SMC107 | 9 | sc7 | 38679 | 205930 | 1.6 | 0 56 31.034 | -72 27 58.173 | 0 56 31.150 | -72 27 57.700 | 15.527 | 15.484 | 15.407 | -0.043 | 0.120 | 0.100 | 7.5 | 1 |
| SMC107 | 9 | sc7 | 38683 | 205931 | 1.1 | 0 56 22.946 | -72 27 54.233 | 0 56 23.020 | -72 27 53.800 | 15.263 | 15.175 | 15.189 | -0.088 | 0.074 | 0.100 | 7.5 | 1 |
| SMC107 | 9 | sc7 | 38865 | 206011 | 0.9 | 0 56 13.394 | -72 27 44.887 | 0 56 13.370 | -72 27 44.500 | 15.808 | 15.707 | 15.731 | -0.101 | 0.076 | 0.100 | 7.5 | 1 |
| SMC107 | 9 | sc7 | 38965 | 205936 | 1.9 | 0 56 32.132 | -72 27 50.396 | 0 56 32.270 | -72 27 50.000 | 15.506 | 15.546 | 15.248 | 0.039 | 0.258 | 0.100 | 7.5 | 1 |
| SMC107 | 9 | sc7 | 39104 | 205944 | 1.8 | 0 56 19.734 | -72 27 36.169 | 0 56 19.870 | -72 27 35.800 | 15.351 | 15.227 | 15.357 | -0.123 | -0.006 | 0.100 | 7.5 | 1 |
| SMC107 | 9 | sc7 | 39541 | 205946 | 1.8 | 0 56 11.996 | -72 27 17.149 | 0 56 12.130 | -72 27 16.800 | 15.276 | 15.188 | 15.254 | -0.088 | 0.022 | 0.100 | 7.5 | 1 |
| SMC107 | 9 | sc7 | 40094 | 205949 | 1.6 | 0 56 25.333 | -72 27 7.245 | 0 56 25.450 | -72 27 6.800 | 15.398 | 15.329 | 15.336 | -0.069 | 0.062 | 0.100 | 7.5 | 1 |
| SMC107 | 9 | sc7 | 36907 | 205968 | 1.4 | 0 56 11.550 | -72 28 42.186 | 0 56 11.650 | -72 28 41.700 | 16.260 | 16.190 | 16.200 | -0.071 | 0.060 | 0.100 | 7.5 | 1 |
| SMC107 | 9 | sc7 | 37301 | 205974 | 1.3 | 0 56 14.154 | -72 28 30.447 | 0 56 14.250 | -72 28 30.000 | 15.918 | 15.872 | 15.785 | -0.046 | 0.132 | 0.100 | 7.5 | 1 |
| SMC107 | 9 | sc7 | 38467 | 205987 | 0.4 | 0 56 20.634 | -72 28 1.428 | 0 56 20.670 | -72 28 2.100 | 16.058 | 15.823 | 16.260 | -0.235 | -0.201 | 0.100 | 7.5 | 1 |
| SMC107 | 9 | sc7 | 39179 | 206025 | 1.2 | 0 56 23.056 | -72 27 35.996 | 0 56 23.140 | -72 27 35.600 | 16.515 | 16.447 | 16.577 | -0.068 | -0.061 | 0.100 | 7.5 | 1 |
| SMC107 | 9 | sc7 | 39366 | 206032 | 0.8 | 0 56 20.226 | -72 27 29.089 | 0 56 20.260 | -72 27 28.600 | 16.049 | 16.032 | 15.984 | -0.016 | 0.064 | 0.100 | 7.5 | 1 |
| SMC107 | 9 | sc7 | 39478 | 206034 | 1.3 | 0 56 18.896 | -72 27 23.423 | 0 56 18.990 | -72 27 23.000 | 16.565 | 16.521 | 16.453 | -0.044 | 0.111 | 0.100 | 7.5 | 1 |
| SMC107 | 9 | sc7 | 40319 | 206040 | 1.9 | 0 56 32.982 | -72 27 5.178 | 0 56 33.120 | -72 27 4.800 | 16.025 | 15.966 | 15.987 | -0.059 | 0.038 | 0.100 | 7.5 | 1 |
| SMC107 | 9 | sc7 | 41361 | 206053 | 2.0 | 0 56 26.461 | -72 26 23.197 | 0 56 26.610 | -72 26 22.900 | 16.167 | 16.059 | 16.266 | -0.107 | -0.099 | 0.100 | 7.5 | 1 |
| SMC107 | 9 | sc7 | 37894 | 205982 | 1.5 | 0 56 22.302 | -72 28 15.990 | 0 56 22.410 | -72 28 15.500 | 16.646 | 16.609 | 16.534 | -0.037 | 0.112 | 0.100 | 7.5 | 1 |
| SMC107 | 9 | sc7 | 38300 | 206133 | 1.6 | 0 56 10.183 | -72 27 53.434 | 0 56 10.300 | -72 27 53.100 | 17.375 | 17.347 | 17.377 | -0.028 | -0.002 | 0.100 | 7.5 | 1 |
| SMC107 | 9 | sc7 | 38540 | 206160 | 1.6 | 0 56 7.383 | -72 27 44.010 | 0 56 7.500 | -72 27 43.600 | 16.747 | 16.711 | 16.591 | -0.036 | 0.156 | 0.100 | 7.5 | 1 |
| SMC107 | 9 | sc7 | 39354 | 206185 | 1.3 | 0 56 17.086 | -72 27 29.979 | 0 56 17.190 | -72 27 30.700 | 17.267 | 17.161 | 17.339 | -0.106 | -0.072 | 0.100 | 7.5 | 1 |
| SMC107 | 9 | sc7 | 39384 | 206188 | 0.7 | 0 56 21.403 | -72 27 28.062 | 0 56 21.400 | -72 27 27.700 | 17.157 | 17.047 | 17.037 | -0.110 | 0.119 | 0.100 | 7.5 | 1 |
| SMC107 | 9 | sc7 | 41254 | 206236 | 1.5 | 0 56 24.517 | -72 26 24.960 | 0 56 24.630 | -72 26 24.600 | 16.874 | 16.837 | 16.761 | -0.038 | 0.113 | 0.100 | 7.5 | 1 |
| SMC107 | 9 | sc7 | 38559 | 206145 | 0.8 | 0 56 10.304 | -72 27 48.981 | 0 56 10.330 | -72 27 48.500 | 17.537 | 17.449 | 17.481 | -0.088 | 0.056 | 0.100 | 7.5 | 1 |
| SMC109 | 9 | sc7? | 61137 | 53213 | 1.6 | 0 57 31.767 | -72 15 37.342 | 0 57 31.870 | -72 15 37.100 | 17.688 | 17.581 | 17.574 | -0.107 | 0.114 | 0.040 | 7.7 | 1 |
| SMC117 | 9 | sc8 | 28212 | 142833 | 1.9 | 0 59 17.075 | -72 35 51.333 | 0 59 17.210 | -72 35 51.100 | 17.412 | 17.293 | 17.460 | -0.119 | -0.048 | 0.130 | 8.3 | 1 |
| SMC117 | 12 | sc8 | 36065 | 139543 | 0.7 | 0 59 25.758 | -72 36 24.578 | 0 59 25.760 | -72 36 24.200 | 17.417 | 17.325 | 17.271 | -0.092 | 0.145 | 0.130 | 8.3 | 1 |
| SMC120 | 9 | sc8 | 52820 | 201621 | 0.7 | 0 59 58.720 | -72 22 2.376 | 0 59 58.760 | -72 22 2.100 | 16.845 | 16.791 | 16.752 | -0.054 | 0.091 | 0.070 | 7.7 | 2 |
| SMC120 | 9 | sc8 | 52849 | 201539 | 0.9 | 1 0 4.226 | -72 22 5.509 | 1 0 4.280 | -72 22 5.200 | 16.528 | 16.484 | 16.421 | -0.044 | 0.107 | 0.070 | 7.7 | 2 |
| SMC120 | 11 | sc8 | 11026 | 201772 | 1.2 | 1 0 2.364 | -72 22 40.243 | 1 0 2.440 | -72 22 39.700 | 17.750 | 17.681 | 17.661 | -0.069 | 0.089 | 0.070 | 7.7 | 1 |
| SMC121 | 11 | sc8 | 2977 | 198549 | 0.9 | 1 0 7.836 | -72 28 4.451 | 1 0 7.880 | -72 28 3.900 | 15.135 | 15.074 | 14.963 | -0.062 | 0.172 | 0.080 | 7.9 | 2 |
| SMC121 | 11 | sc8 | 3894 | 198574 | 1.1 | 1 0 19.505 | -72 27 36.775 | 1 0 19.570 | -72 27 36.200 | 16.361 | 16.311 | 16.296 | -0.050 | 0.064 | 0.080 | 7.9 | 2 |
| SMC121 | 11 | sc8 | 3329 | 198617 | 1.0 | 1 0 11.706 | -72 27 53.716 | 1 0 11.760 | -72 27 53.200 | 16.964 | 16.859 | 16.929 | -0.105 | 0.035 | 0.080 | 7.9 | 2 |
| SMC124 | 9 | sc8 | 53638 | 33009 | 0.9 | 1 0 33.639 | -72 21 57.151 | 1 0 33.690 | -72 21 56.600 | 16.332 | 16.245 | 16.303 | -0.086 | 0.028 | 0.060 | 7.6 | 1 |
| SMC124 | 9 | sc8 | 53423 | 33008 | 0.5 | 1 0 33.359 | -72 22 3.541 | 1 0 33.380 | -72 22 3.100 | 16.715 | 16.701 | 16.653 | -0.013 | 0.062 | 0.060 | 7.6 | 1 |
| SMC124 | 9 | sc8 | 53877 | 36040 | 0.4 | 1 0 35.118 | -72 21 50.073 | 1 0 35.120 | -72 21 49.700 | 16.985 | 16.827 | 16.964 | -0.157 | 0.021 | 0.060 | 7.6 | 1 |
| SMC124 | 9 | sc8 | 54376 | 36013 | 0.5 | 1 0 30.158 | -72 21 30.018 | 1 0 30.170 | -72 21 29.600 | 16.674 | 16.652 | 16.526 | -0.023 | 0.149 | 0.060 | 7.6 | 2 |
| Cluster | Image | Image | ID | ID | r | RA(2000) | DEC(2000) | RA(2000) | DEC(2000) | V | B | I | B-V | V-I | E[B-V] | log(t) | Mult |
|---|---|---|---|---|---|---|---|---|---|---|---|---|---|---|---|---|---|
| WFI | Ogle | WFI | Ogle | ″ | WFI | WFI | Ogle | Ogle | |||||||||
| SMC126 | 12 | sc9 | 22724 | 13435 | 0.8 | 1 0 55.826 | -72 44 50.848 | 1 0 55.890 | -72 44 50.600 | 16.887 | 16.806 | 16.904 | -0.082 | -0.017 | 0.070 | 8 | 1 |
| SMC128 | 11 | sc9 | 10309 | 78904 | 1.3 | 1 1 36.265 | -72 24 17.857 | 1 1 36.360 | -72 24 17.500 | 17.361 | 17.256 | 17.485 | -0.105 | -0.124 | 0.090 | 7.1 | 1 |
| SMC134 | 11 | sc9 | 23627 | 168332 | 0.6 | 1 3 9.526 | -72 16 22.771 | 1 3 9.570 | -72 16 22.600 | 14.997 | 14.976 | 14.981 | -0.022 | 0.016 | 0.050 | 7.8 | 2 |
| SMC134 | 11 | sc9 | 23610 | 168408 | 0.5 | 1 3 11.782 | -72 16 24.363 | 1 3 11.790 | -72 16 24.200 | 16.924 | 16.839 | 16.853 | -0.086 | 0.071 | 0.050 | 7.8 | 2 |
| SMC134 | 11 | sc9 | 23713 | 168413 | 0.8 | 1 3 11.483 | -72 16 20.708 | 1 3 11.460 | -72 16 20.500 | 17.162 | 17.149 | 17.091 | -0.013 | 0.071 | 0.050 | 7.8 | 1 |
| SMC134 | 11 | sc9 | 23901 | 168419 | 0.5 | 1 3 11.254 | -72 16 18.228 | 1 3 11.260 | -72 16 18.100 | 17.244 | 17.202 | 17.154 | -0.042 | 0.088 | 0.050 | 7.8 | 1 |
| SMC134 | 11 | sc9 | 23926 | 168536 | 0.6 | 1 3 11.709 | -72 16 13.310 | 1 3 11.760 | -72 16 13.200 | 17.299 | 17.246 | 17.223 | -0.054 | 0.076 | 0.050 | 7.8 | 2 |
| SMC134 | 11 | sc9 | 24123 | 168424 | 0.5 | 1 3 11.339 | -72 16 5.568 | 1 3 11.370 | -72 16 5.400 | 16.860 | 16.925 | 16.769 | 0.064 | 0.091 | 0.050 | 7.8 | 1 |
| SMC134 | 11 | sc9 | 23667 | 168523 | 0.9 | 1 3 13.064 | -72 16 23.072 | 1 3 13.040 | -72 16 22.800 | 17.633 | 17.599 | 17.536 | -0.034 | 0.098 | 0.050 | 7.8 | 1 |
| SMC134 | 11 | sc9 | 23886 | 168420 | 0.6 | 1 3 13.634 | -72 16 16.436 | 1 3 13.630 | -72 16 16.200 | 17.310 | 17.102 | 17.191 | -0.208 | 0.118 | 0.050 | 7.8 | 1 |
| SMC134 | 11 | sc9 | 23344 | 168515 | 0.5 | 1 3 9.484 | -72 16 32.749 | 1 3 9.500 | -72 16 32.600 | 17.758 | 17.625 | 17.717 | -0.133 | 0.042 | 0.050 | 7.8 | 1 |
| SMC137 | 12 | sc9 | 36860 | 152653 | 0.5 | 1 3 24.801 | -72 38 55.451 | 1 3 24.800 | -72 38 55.300 | 16.191 | 16.118 | 16.070 | -0.072 | 0.121 | 0.060 | 7.6 | 1 |
| SMC137 | 12 | sc9 | 37291 | 152708 | 0.5 | 1 3 21.729 | -72 38 39.068 | 1 3 21.740 | -72 38 38.900 | 17.012 | 16.928 | 16.987 | -0.084 | 0.025 | 0.060 | 7.6 | 1 |
| SMC137 | 12 | sc9 | 36179 | 152694 | 0.6 | 1 3 14.967 | -72 39 11.515 | 1 3 14.960 | -72 39 11.300 | 17.340 | 17.264 | 17.244 | -0.076 | 0.096 | 0.060 | 7.6 | 1 |
| SMC137 | 12 | sc9 | 36574 | 152806 | 1.0 | 1 3 24.745 | -72 39 4.998 | 1 3 24.700 | -72 39 4.800 | 17.635 | 17.593 | 17.621 | -0.042 | 0.013 | 0.060 | 7.6 | 1 |
| SMC138 | 13 | sc10 | 26557 | 33961 | 0.9 | 1 3 53.991 | -72 6 8.706 | 1 3 54.060 | -72 6 8.500 | 15.890 | 15.867 | 15.734 | -0.023 | 0.155 | 0.040 | 7.4 | 1 |
| SMC139 | 12 | sc10 | 17338 | 31 | 1.2 | 1 3 53.109 | -72 49 39.577 | 1 3 53.050 | -72 49 39.200 | 15.092 | 14.981 | 15.053 | -0.111 | 0.039 | 0.070 | 7.5 | 1 |
| SMC139 | 12 | sc10 | 17471 | 71 | 0.9 | 1 3 51.050 | -72 49 34.960 | 1 3 51.020 | -72 49 34.600 | 15.709 | 15.703 | 15.561 | -0.006 | 0.148 | 0.070 | 7.5 | 1 |
| SMC139 | 12 | sc10 | 17654 | 33 | 0.7 | 1 3 53.103 | -72 49 30.365 | 1 3 53.130 | -72 49 30.000 | 15.268 | 15.317 | 15.327 | 0.049 | -0.060 | 0.070 | 7.5 | 1 |
| SMC139 | 12 | sc10 | 17893 | 3038 | 0.9 | 1 3 56.776 | -72 49 26.526 | 1 3 56.740 | -72 49 26.200 | 15.366 | 15.238 | 15.320 | -0.128 | 0.045 | 0.070 | 7.5 | 1 |
| SMC139 | 12 | sc10 | 17719 | 73 | 1.2 | 1 3 56.137 | -72 49 32.603 | 1 3 56.070 | -72 49 32.300 | 16.186 | 15.940 | 16.283 | -0.247 | -0.097 | 0.070 | 7.5 | 1 |
| SMC139 | 12 | sc10 | 17952 | 3065 | 1.0 | 1 3 53.184 | -72 49 22.705 | 1 3 53.270 | -72 49 22.400 | 16.036 | 15.926 | 15.960 | -0.110 | 0.076 | 0.070 | 7.5 | 1 |
| SMC139 | 12 | sc10 | 17092 | 123 | 1.4 | 1 3 55.037 | -72 49 49.265 | 1 3 54.960 | -72 49 48.800 | 16.765 | 16.618 | 16.742 | -0.148 | 0.023 | 0.070 | 7.5 | 1 |
| SMC139 | 12 | sc10 | 17132 | 125 | 1.2 | 1 3 51.115 | -72 49 44.440 | 1 3 51.060 | -72 49 44.000 | 16.795 | 16.690 | 16.671 | -0.105 | 0.123 | 0.070 | 7.5 | 1 |
| SMC140 | 12 | sc10 | 38008 | 52236 | 1.3 | 1 4 13.305 | -72 38 49.732 | 1 4 13.240 | -72 38 49.400 | 17.034 | 16.965 | 16.999 | -0.069 | 0.035 | 0.090 | 7.2 | 1 |
| SMC142 | 11 | sc10 | 34166 | 70458 | 1.5 | 1 4 36.329 | -72 9 41.518 | 1 4 36.260 | -72 9 41.200 | 15.766 | 15.632 | 15.756 | -0.134 | 0.011 | 0.060 | 7.3 | 1 |
| SMC143 | 12 | sc10 | 48420 | 54983 | 1.1 | 1 4 44.687 | -72 33 23.019 | 1 4 44.640 | -72 33 22.800 | 17.550 | 17.375 | 17.662 | -0.174 | -0.112 | 0.090 | 8.2 | 1 |
| SMC144 | 11 | sc10 | 37686 | 34152 | 0.7 | 1 4 2.606 | -72 6 58.708 | 1 4 2.580 | -72 6 58.700 | 17.844 | 17.745 | 17.976 | -0.099 | -0.132 | 0.050 | 7.6 | 1 |
| SMC144 | 11 | sc10 | 37554 | 71041 | 0.6 | 1 4 6.146 | -72 7 8.434 | 1 4 6.130 | -72 7 8.400 | 18.433 | 18.312 | 18.494 | -0.120 | -0.062 | 0.050 | 7.6 | 1 |
| SMC155 | 14 | sc11 | 29777 | 50950 | 0.3 | 1 7 30.789 | -72 30 7.614 | 1 7 30.800 | -72 30 7.600 | 15.807 | 15.726 | 15.642 | -0.081 | 0.165 | 0.090 | 7.7 | 1 |
| SMC155 | 14 | sc11 | 30041 | 50952 | 0.3 | 1 7 31.021 | -72 29 55.249 | 1 7 31.050 | -72 29 55.300 | 15.598 | 15.510 | 15.514 | -0.088 | 0.084 | 0.090 | 7.7 | 1 |
| SMC155 | 14 | sc11 | 29773 | 50977 | 0.5 | 1 7 27.808 | -72 30 5.242 | 1 7 27.860 | -72 30 5.300 | 16.203 | 16.064 | 16.201 | -0.139 | 0.002 | 0.090 | 7.7 | 1 |
| SMC198 | 6 | sc5 | 49187 | 190611 | 1.1 | 0 50 5.525 | -73 11 36.586 | 0 50 5.660 | -73 11 36.500 | 17.203 | 17.175 | 17.015 | -0.028 | 0.187 | 0.060 | 7.9 | 2 |
| SMC198 | 6 | sc5 | 50118 | 190637 | 0.7 | 0 50 9.830 | -73 11 9.199 | 0 50 9.910 | -73 11 9.100 | 17.589 | 17.574 | 17.442 | -0.016 | 0.147 | 0.060 | 7.9 | 1 |
| SMC198 | 6 | sc5 | 50141 | 190640 | 0.7 | 0 50 8.177 | -73 11 7.617 | 0 50 8.260 | -73 11 7.500 | 17.755 | 17.708 | 17.539 | -0.047 | 0.216 | 0.060 | 7.9 | 1 |
| Cluster | Image | ID | (B-V)0 | V0 | Mv | (V-I)0 | ST | ID Simbad | ST Simbad |
|---|---|---|---|---|---|---|---|---|---|
| WFI | WFI | ||||||||
| SMC8 | 2 | 34940 | -0.190 | 16.761 | -1.989 | -0.034 | B2 | ||
| SMC9 | 2 | 35267 | -0.130 | 16.203 | -2.547 | 0.093 | B2 | [MA93] 20 | Em* |
| SMC11 | 2 | 39854 | -0.117 | 16.318 | -2.432 | -0.013 | B2 | ||
| SMC11 | 2 | 40737 | -0.140 | 16.865 | -1.885 | -0.048 | B2 | ||
| SMC11 | 2 | 40443 | -0.131 | 17.188 | -1.562 | -0.066 | B3 | ||
| SMC15 | 1 | 8873 | 0.018 | 15.794 | -2.956 | 0.096 | B1 | ||
| SMC18 | 2 | 33376 | -0.147 | 16.062 | -2.688 | 0.017 | B1 | [MA93] 59 | Em* |
| SMC39 | 4 | 17655 | -0.190 | 16.085 | -2.665 | -0.120 | B1 | ||
| SMC49 | 6 | 18899 | -0.244 | 17.052 | -1.698 | -0.221 | B3 | ||
| SMC54 | 6 | 26334 | -0.112 | 15.484 | -3.266 | 0.031 | B0 | [MA93] 284 | Em* |
| SMC54 | 6 | 26058 | 0.038 | 17.216 | -1.534 | 0.049 | B3 | ||
| SMC64 | 5 | 30064 | -0.001 | 16.907 | -1.843 | 0.050 | B2 | 2MASS J00503686-7258174 | Em* |
| SMC64 | 5 | 30728 | -0.164 | 16.200 | -2.550 | 0.004 | B2 | ||
| SMC67 | 5 | 57461 | -0.116 | 17.267 | -1.483 | -0.069 | B3 | ||
| SMC68 | 6 | 35590 | -0.041 | 15.024 | -3.726 | 0.086 | B0 | [M2002] SMC 17703 ? | Em* |
| SMC68 | 6 | 35764 | -0.072 | 15.490 | -3.260 | 0.112 | B0 | [SG2005] SMC 32 | HXB |
| SMC68 | 6 | 38010 | -0.071 | 14.890 | -3.860 | 0.179 | B0 | [M2002] SMC 18341 | Em* |
| SMC68 | 6 | 36917 | -0.229 | 16.206 | -2.544 | -0.214 | B2 | ||
| SMC68 | 6 | 37293 | -0.113 | 16.243 | -2.507 | 0.106 | B2 | [MA93] 426 | Em* |
| SMC68 | 6 | 38765 | -0.166 | 16.616 | -2.134 | -0.056 | B2 | ||
| SMC68 | 8 | 14944 | -0.184 | 16.234 | -2.516 | -0.079 | B2 | ||
| SMC68 | 6 | 39644 | -0.164 | 17.107 | -1.643 | -0.032 | B3 | ||
| SMC69 | 5 | 7935 | -0.110 | 15.739 | -3.011 | 0.111 | B1 | ||
| SMC69 | 5 | 6201 | -0.077 | 16.784 | -1.966 | -0.003 | B2 | ||
| SMC69 | 5 | 6818 | -0.140 | 16.689 | -2.061 | -0.047 | B2 | ||
| SMC69 | 5 | 5670 | -0.153 | 17.076 | -1.674 | -0.074 | B3 | ||
| SMC71 | 5 | 27502 | -0.177 | 17.594 | -1.156 | 0.065 | B4 | ||
| SMC72 | 6 | 46694 | -0.120 | 14.608 | -4.142 | -0.027 | B0 | ||
| SMC72 | 6 | 46921 | -0.148 | 15.372 | -3.378 | 0.034 | B0 | [MA93] 492 | Em* |
| SMC72 | 6 | 47659 | -0.324 | 15.369 | -3.381 | -0.187 | B0 | [M2002] SMC 20976 ? | star |
| SMC73 | 5 | 46610 | -0.174 | 17.022 | -1.728 | -0.065 | B3 | ||
| SMC74 | 5 | 35145 | -0.120 | 15.424 | -3.326 | 0.142 | B0 | [MA93] 509 | Em* |
| SMC89 | 7 | 40369 | -0.240 | 16.133 | -2.617 | -0.155 | B1 | ||
| SMC99 | 7 | 58735 | -0.120 | 15.764 | -2.986 | 0.000 | B1 | [MFH2007] SMC5-37162 | B2IIIe |
| SMC104 | 7 | 22294 | -0.062 | 17.149 | -1.601 | -0.077 | B3 | ||
| SMC105 | 7 | 16723 | -0.149 | 16.865 | -1.885 | -0.107 | B2 |
| Cluster | Image | ID | (B-V)0 | V0 | Mv | (V-I)0 | ST | ID Simbad | ST Simbad |
|---|---|---|---|---|---|---|---|---|---|
| WFI | WFI | ||||||||
| SMC107 | 9 | 36804 | -0.154 | 15.040 | -3.710 | -0.015 | B0 | [MFH2007] SMC5-64327 | B3II-IIIe |
| SMC107 | 9 | 37317 | -0.147 | 15.372 | -3.378 | -0.013 | B0 | Cl* NGC 330 ROB B36 | Em* |
| SMC107 | 9 | 38203 | -0.150 | 15.392 | -3.358 | -0.004 | B0 | [MFH2007] SMC5-37137 | B2IIIe |
| SMC107 | 9 | 38679 | -0.143 | 15.217 | -3.533 | -0.024 | B0 | [MFH2007] SMC5-13978 | B3IIIe |
| SMC107 | 9 | 38683 | -0.188 | 14.953 | -3.797 | -0.070 | B0 | Cl* NGC 330 ROB A15 | Em* |
| SMC107 | 9 | 38865 | -0.201 | 15.498 | -3.252 | -0.068 | B0 | ||
| SMC107 | 9 | 38965 | -0.061 | 15.196 | -3.554 | 0.114 | B0 | Cl* NGC 330 ROB B6 | B2IIIe |
| SMC107 | 9 | 39104 | -0.223 | 15.041 | -3.709 | -0.150 | B0 | Cl* NGC 330 ROB A22 | *iC |
| SMC107 | 9 | 39541 | -0.188 | 14.966 | -3.784 | -0.122 | B0 | Cl* NGC 330 ROB B17 | *iC |
| SMC107 | 9 | 40094 | -0.169 | 15.088 | -3.662 | -0.082 | B0 | Cl* NGC 330 ROB B12 | B2IIIe |
| SMC107 | 9 | 36907 | -0.171 | 15.950 | -2.800 | -0.084 | B1 | Cl* NGC 330 KWBBE 471 | *iC |
| SMC107 | 9 | 37301 | -0.146 | 15.608 | -3.142 | -0.012 | B1 | Cl* NGC 330 ROB B34 | *iC |
| SMC107 | 9 | 38467 | -0.335 | 15.748 | -3.002 | -0.345 | B1 | Cl* NGC 330 KWBBE 219 | Be* |
| SMC107 | 9 | 39366 | -0.116 | 15.739 | -3.011 | -0.080 | B1 | Cl* NGC 330 KWBBE 439 | *iC |
| SMC107 | 9 | 40319 | -0.159 | 15.715 | -3.035 | -0.106 | B1 | Cl* NGC 330 KWBBE 442 | *iC |
| SMC107 | 9 | 41361 | -0.207 | 15.857 | -2.893 | -0.243 | B1 | Cl* NGC 330 KWBBE 448 | *iC |
| SMC107 | 9 | 37894 | -0.137 | 16.336 | -2.414 | -0.032 | B2 | Cl* NGC 330 ROB B9 | *iC |
| SMC107 | 9 | 38540 | -0.136 | 16.437 | -2.313 | 0.012 | B2 | [MFH2007] SMC5-73581 | B3IIIe |
| SMC107 | 9 | 39179 | -0.168 | 16.205 | -2.545 | -0.205 | B2 | Cl* NGC 330 KWBBE 875 | *iC |
| SMC107 | 9 | 39384 | -0.210 | 16.847 | -1.903 | -0.025 | B2 | ||
| SMC107 | 9 | 39478 | -0.144 | 16.255 | -2.495 | -0.033 | B2 | [MFH2007] SMC5-44898 | B2III-IVe |
| SMC107 | 9 | 41254 | -0.138 | 16.564 | -2.186 | -0.031 | B2 | Cl* NGC 330 KWBBE 459 | *iC |
| SMC107 | 9 | 38300 | -0.128 | 17.065 | -1.685 | -0.146 | B3 | Cl* NGC 330 KWBBE 882 | *iC |
| SMC107 | 9 | 38559 | -0.188 | 17.227 | -1.523 | -0.088 | B3 | Cl* NGC 330 KWBBE 857 | *iC |
| SMC107 | 9 | 39354 | -0.206 | 16.957 | -1.793 | -0.216 | B3 | ||
| SMC109 | 9 | 61137 | -0.147 | 17.564 | -1.186 | 0.056 | B4 | ||
| SMC117 | 9 | 28212 | -0.249 | 17.009 | -1.741 | -0.235 | B3 | ||
| SMC117 | 12 | 36065 | -0.222 | 17.014 | -1.736 | -0.042 | B3 | ||
| SMC120 | 9 | 52820 | -0.124 | 16.628 | -2.122 | -0.010 | B2 | [MA93] 1173 | Em* |
| SMC120 | 9 | 52849 | -0.114 | 16.311 | -2.439 | 0.006 | B2 | ||
| SMC120 | 11 | 11026 | -0.139 | 17.533 | -1.217 | -0.012 | B4 | ||
| SMC121 | 11 | 2977 | -0.142 | 14.887 | -3.863 | 0.057 | B0 | [M2002] SMC 48057 | Em* |
| SMC121 | 11 | 3894 | -0.130 | 16.113 | -2.637 | -0.051 | B1 | [MA93] 1200 | Em* |
| SMC121 | 11 | 3329 | -0.185 | 16.716 | -2.034 | -0.080 | B2 | ||
| SMC124 | 9 | 53638 | -0.146 | 16.146 | -2.604 | -0.058 | B1 | ||
| SMC124 | 9 | 53423 | -0.073 | 16.529 | -2.221 | -0.024 | B2 | ||
| SMC124 | 9 | 53877 | -0.217 | 16.799 | -1.951 | -0.065 | B2 | ||
| SMC124 | 9 | 54376 | -0.083 | 16.488 | -2.262 | 0.063 | B2 | 2MASS J01003020-7221299 | Em* |
| SMC126 | 12 | 22724 | -0.152 | 16.670 | -2.080 | -0.118 | B2 |
| Cluster | Image | ID | (B-V)0 | V0 | Mv | (V-I)0 | ST | ID Simbad | ST Simbad |
|---|---|---|---|---|---|---|---|---|---|
| WFI | WFI | ||||||||
| SMC128 | 11 | 10309 | -0.195 | 17.082 | -1.668 | -0.254 | B3 | ||
| SMC134 | 11 | 23627 | -0.072 | 14.842 | -3.908 | -0.056 | B0 | [MA93] 1364 | Em* |
| SMC134 | 11 | 23610 | -0.136 | 16.769 | -1.981 | -0.001 | B2 | ||
| SMC134 | 11 | 24123 | 0.014 | 16.705 | -2.045 | 0.019 | B2 | [MB2000] 224 | Em* |
| SMC134 | 11 | 23713 | -0.063 | 17.007 | -1.743 | -0.001 | B3 | ||
| SMC134 | 11 | 23886 | -0.258 | 17.155 | -1.595 | 0.046 | B3 | ||
| SMC134 | 11 | 23901 | -0.092 | 17.089 | -1.661 | 0.016 | B3 | ||
| SMC134 | 11 | 23926 | -0.104 | 17.144 | -1.606 | 0.004 | B3 | ||
| SMC134 | 11 | 23344 | -0.183 | 17.603 | -1.147 | -0.030 | B4 | ||
| SMC134 | 11 | 23667 | -0.084 | 17.478 | -1.272 | 0.026 | B4 | ||
| SMC137 | 12 | 36860 | -0.132 | 16.005 | -2.745 | 0.035 | B1 | ||
| SMC137 | 12 | 37291 | -0.144 | 16.826 | -1.924 | -0.061 | B2 | ||
| SMC137 | 12 | 36179 | -0.136 | 17.154 | -1.596 | 0.010 | B3 | ||
| SMC137 | 12 | 36574 | -0.102 | 17.449 | -1.301 | -0.073 | B4 | ||
| SMC138 | 13 | 26557 | -0.063 | 15.766 | -2.984 | 0.097 | B1 | 2MASS J01035409-7206083 | Em* |
| SMC139 | 12 | 17338 | -0.181 | 14.875 | -3.875 | -0.062 | B0 | ||
| SMC139 | 12 | 17471 | -0.076 | 15.492 | -3.258 | 0.047 | B0 | [MA93] 1415 | Em* |
| SMC139 | 12 | 17654 | -0.021 | 15.051 | -3.699 | -0.161 | B0 | [MA93] 1420 | Em* |
| SMC139 | 12 | 17893 | -0.198 | 15.149 | -3.601 | -0.056 | B0 | [MA93] 1426 | Em* |
| SMC139 | 12 | 17719 | -0.317 | 15.969 | -2.781 | -0.198 | B1 | ||
| SMC139 | 12 | 17952 | -0.180 | 15.819 | -2.931 | -0.025 | B1 | ||
| SMC139 | 12 | 17092 | -0.218 | 16.548 | -2.202 | -0.078 | B2 | ||
| SMC139 | 12 | 17132 | -0.175 | 16.578 | -2.172 | 0.022 | B2 | ||
| SMC140 | 12 | 38008 | -0.159 | 16.755 | -1.995 | -0.095 | B2 | ||
| SMC142 | 11 | 34166 | -0.194 | 15.580 | -3.170 | -0.075 | B1 | ||
| SMC143 | 12 | 48420 | -0.264 | 17.271 | -1.479 | -0.242 | B3 | ||
| SMC144 | 11 | 37686 | -0.149 | 17.689 | -1.061 | -0.204 | B4 | ||
| SMC144 | 11 | 37554 | -0.170 | 18.278 | -0.472 | -0.134 | B6 | ||
| SMC155 | 14 | 30041 | -0.178 | 15.319 | -3.431 | -0.046 | B0 | [MA93] 1630 | Em* |
| SMC155 | 14 | 29773 | -0.229 | 15.924 | -2.826 | -0.128 | B1 | [MA93] 1631 | Em* |
| SMC155 | 14 | 29777 | -0.171 | 15.528 | -3.222 | 0.035 | B1 | ||
| SMC198 | 6 | 49187 | -0.088 | 17.017 | -1.733 | 0.101 | B3 | ||
| SMC198 | 6 | 50118 | -0.076 | 17.403 | -1.347 | 0.061 | B4 | ||
| SMC198 | 6 | 50141 | -0.107 | 17.569 | -1.181 | 0.130 | B4 |
| Cluster | Image | Image | ID | ID | r | RA(2000) | DEC(2000) | RA(2000) | DEC(2000) | V | B | I | B-V | V-I | E[B-V] | log(t) | Mult |
|---|---|---|---|---|---|---|---|---|---|---|---|---|---|---|---|---|---|
| WFI | Ogle | WFI | Ogle | ″ | WFI | WFI | Ogle | Ogle | |||||||||
| SMC002 | 2 | sc1 | 11621 | 35532 | 0.9 | 0 37 41.567 | -73 37 4.805 | 0 37 41.720 | -73 37 4.300 | 15.941 | 15.886 | 15.790 | -0.055 | 0.151 | 0.060 | 8.4 | 1 |
| SMC008 | 2 | sc2 | 34493 | 35344 | 1.0 | 0 40 35.389 | -73 23 56.521 | 0 40 35.540 | -73 23 56.300 | 17.218 | 17.103 | 17.231 | -0.115 | -0.013 | 0.070 | 8 | 1 |
| SMC009 | 2 | sc2 | 35862 | 35312 | 0.8 | 0 40 44.245 | -73 23 14.832 | 0 40 44.350 | -73 23 14.600 | 16.393 | 16.291 | 16.447 | -0.102 | -0.054 | 0.070 | 8 | 1 |
| SMC009 | 2 | sc2 | 35791 | 35497 | 0.8 | 0 40 37.924 | -73 23 12.782 | 0 40 38.030 | -73 23 12.500 | 17.774 | 17.671 | 17.753 | -0.104 | 0.021 | 0.070 | 8 | 1 |
| SMC011 | 2 | sc2 | 40080 | 61911 | 0.7 | 0 41 6.174 | -73 21 4.138 | 0 41 6.250 | -73 21 3.800 | 17.586 | 17.345 | 17.276 | -0.241 | 0.309 | 0.080 | 7.9 | 1 |
| SMC011 | 2 | sc2 | 40465 | 64097 | 0.7 | 0 41 6.581 | -73 20 50.625 | 0 41 6.650 | -73 20 50.300 | 17.915 | 17.847 | 17.877 | -0.068 | 0.038 | 0.080 | 7.9 | 1 |
| SMC015 | 1 | sc3 | 9526 | 20020 | 1.0 | 0 42 52.422 | -73 17 28.318 | 0 42 52.370 | -73 17 27.800 | 16.828 | 16.789 | 16.768 | -0.039 | 0.060 | 0.100 | 8.1 | 1 |
| SMC016 | 1 | sc3 | 21973 | 28069 | 1.1 | 0 42 48.068 | -73 10 13.504 | 0 42 48.150 | -73 10 12.900 | 16.420 | 16.422 | 16.315 | 0.002 | 0.105 | 0.080 | 8.3 | 1 |
| SMC39 | 6 | sc4 | 11608 | 103852 | 1.0 | 0 47 18.232 | -73 28 20.732 | 0 47 18.380 | -73 28 20.300 | 17.471 | 17.418 | 17.620 | -0.053 | -0.149 | 0.110 | 8 | 1 |
| SMC39 | 4 | sc4 | 17735 | 101412 | 1.0 | 0 47 15.786 | -73 28 45.515 | 0 47 15.970 | -73 28 45.200 | 17.712 | 17.728 | 17.489 | 0.016 | 0.222 | 0.110 | 8 | 1 |
| SMC39 | 4 | sc4 | 17751 | 101821 | 1.1 | 0 47 25.005 | -73 28 50.983 | 0 47 24.900 | -73 28 50.400 | 18.010 | 17.978 | 17.995 | -0.032 | 0.016 | 0.110 | 8 | 1 |
| SMC39 | 4 | sc4 | 17374 | 101819 | 0.8 | 0 47 7.878 | -73 28 51.076 | 0 47 8.010 | -73 28 50.800 | 18.081 | 18.154 | 17.810 | 0.073 | 0.271 | 0.110 | 8 | 1 |
| SMC43 | 4 | sc4? | 47538 | 167239 | 1.0 | 0 47 54.893 | -73 13 12.824 | 0 47 54.890 | -73 13 12.100 | 15.847 | 15.821 | 15.750 | -0.026 | 0.097 | 0.090 | 8.5 | 1 |
| SMC47 | 5 | sc4 | 26309 | 183310 | 1.3 | 0 48 20.087 | -72 58 45.794 | 0 48 20.220 | -72 58 45.800 | 17.853 | 17.812 | 17.900 | -0.040 | -0.047 | 0.120 | 7.8 | 1 |
| SMC49 | 6 | sc5 | 19436 | 11592 | 1.4 | 0 48 35.491 | -73 24 59.553 | 0 48 35.720 | -73 24 59.200 | 16.799 | 16.647 | 16.976 | -0.152 | -0.176 | 0.060 | 7 | 1 |
| SMC54 | 6 | sc5 | 25290 | 95233 | 1.3 | 0 49 18.151 | -73 22 31.079 | 0 49 18.350 | -73 22 30.900 | 16.372 | 16.308 | 16.425 | -0.064 | -0.053 | 0.100 | 8 | 1 |
| SMC61 | 6 | sc5 | 40386 | 185177 | 1.0 | 0 50 2.240 | -73 15 39.100 | 0 50 2.380 | -73 15 39.100 | 17.149 | 17.106 | 17.092 | -0.043 | 0.056 | 0.120 | 7.4 | 1 |
| SMC61 | 6 | sc5 | 40812 | 106178 | 1.0 | 0 49 57.657 | -73 15 23.611 | 0 49 57.800 | -73 15 23.600 | 18.183 | 18.007 | 18.054 | -0.175 | 0.128 | 0.120 | 7.4 | 1 |
| SMC64 | 5 | sc5 | 30736 | 208709 | 0.6 | 0 50 39.685 | -72 58 18.552 | 0 50 39.650 | -72 58 18.700 | 17.716 | 17.698 | 17.633 | -0.018 | 0.083 | 0.100 | 8.1 | 1 |
| SMC64 | 5 | sc5 | 32158 | 214394 | 0.4 | 0 50 41.541 | -72 57 36.104 | 0 50 41.530 | -72 57 36.300 | 17.624 | 17.580 | 17.596 | -0.045 | 0.028 | 0.100 | 8.1 | 1 |
| SMC64 | 5 | sc5 | 30619 | 208690 | 0.2 | 0 50 42.575 | -72 58 23.876 | 0 50 42.610 | -72 58 24.000 | 17.990 | 18.017 | 17.955 | 0.027 | 0.035 | 0.100 | 8.1 | 1 |
| SMC64 | 5 | sc5 | 32232 | 214397 | 0.5 | 0 50 43.981 | -72 57 35.491 | 0 50 43.960 | -72 57 35.700 | 18.330 | 18.271 | 18.201 | -0.059 | 0.129 | 0.100 | 8.1 | 1 |
| SMC66 | 6 | sc5 | 49018 | 271189 | 0.9 | 0 50 52.018 | -73 12 9.134 | 0 50 52.130 | -73 12 9.100 | 17.186 | 17.096 | 17.222 | -0.090 | -0.035 | 0.090 | 7.8 | 1 |
| SMC68 | 6 | sc5 | 39658 | 261315 | 0.6 | 0 50 58.566 | -73 16 39.046 | 0 50 58.570 | -73 16 38.800 | 18.107 | 18.128 | 17.997 | 0.021 | 0.109 | 0.090 | 7.7 | 1 |
| SMC69 | 6 | sc5 | 53619 | 271156 | 0.8 | 0 51 11.718 | -73 10 8.483 | 0 51 11.690 | -73 10 8.100 | 16.397 | 16.278 | 16.405 | -0.119 | -0.008 | 0.080 | 7.6 | 1 |
| SMC69 | 5 | sc5 | 7652 | 271169 | 1.1 | 0 51 11.248 | -73 9 20.449 | 0 51 11.150 | -73 9 20.800 | 16.559 | 16.483 | 16.505 | -0.077 | 0.054 | 0.080 | 7.6 | 1 |
| SMC69 | 5 | sc5 | 7542 | 271354 | 1.0 | 0 51 12.972 | -73 9 20.447 | 0 51 12.890 | -73 9 20.800 | 17.342 | 17.287 | 17.308 | -0.055 | 0.033 | 0.080 | 7.6 | 1 |
| SMC69 | 5 | sc5 | 6624 | 271681 | 1.3 | 0 51 21.171 | -73 9 54.629 | 0 51 21.050 | -73 9 54.800 | 17.644 | 17.502 | 17.734 | -0.141 | -0.090 | 0.080 | 7.6 | 1 |
| SMC69 | 5 | sc5 | 6231 | 272406 | 1.0 | 0 51 16.995 | -73 10 1.924 | 0 51 17.110 | -73 10 2.800 | 18.490 | 18.414 | 18.503 | -0.078 | -0.011 | 0.080 | 7.6 | 1 |
| SMC72 | 6 | sc6 | 45847 | 17909 | 0.7 | 0 51 39.843 | -73 14 10.301 | 0 51 39.860 | -73 14 9.900 | 17.669 | 17.614 | 17.676 | -0.055 | -0.008 | 0.080 | 7.6 | 1 |
| Cluster | Image | Image | ID | ID | r | RA(2000) | DEC(2000) | RA(2000) | DEC(2000) | V | B | I | B-V | V-I | E[B-V] | log(t) | Mult |
|---|---|---|---|---|---|---|---|---|---|---|---|---|---|---|---|---|---|
| WFI | Ogle | WFI | Ogle | ″ | WFI | WFI | Ogle | Ogle | |||||||||
| SMC99 | 7 | sc7 | 58955 | 70940 | 1.4 | 0 54 41.207 | -72 28 2.335 | 0 54 41.320 | -72 28 2.200 | 17.371 | 17.282 | 17.352 | -0.089 | 0.019 | 0.080 | 7.6 | 1 |
| SMC107 | 9 | sc7 | 38635 | 206127 | 1.3 | 0 56 20.764 | -72 27 53.744 | 0 56 20.870 | -72 27 54.300 | 17.003 | 16.972 | 16.903 | -0.031 | 0.100 | 0.100 | 7.5 | 1 |
| SMC107 | 9 | sc7 | 38660 | 206138 | 0.6 | 0 56 23.650 | -72 27 52.520 | 0 56 23.660 | -72 27 52.200 | 17.210 | 17.178 | 17.124 | -0.032 | 0.086 | 0.100 | 7.5 | 1 |
| SMC107 | 9 | sc7 | 39170 | 206197 | 0.8 | 0 56 2.796 | -72 27 20.533 | 0 56 2.800 | -72 27 20.100 | 17.117 | 17.007 | 17.145 | -0.110 | -0.028 | 0.100 | 7.5 | 1 |
| SMC107 | 9 | sc7 | 35214 | 202114 | 1.4 | 0 56 13.101 | -72 29 41.006 | 0 56 13.200 | -72 29 40.500 | 17.593 | 17.554 | 17.541 | -0.039 | 0.052 | 0.100 | 7.5 | 1 |
| SMC107 | 9 | sc7 | 35856 | 138111 | 1.1 | 0 55 59.550 | -72 29 6.606 | 0 55 59.610 | -72 29 6.000 | 18.434 | 18.374 | 18.397 | -0.059 | 0.037 | 0.100 | 7.5 | 1 |
| SMC107 | 9 | sc7 | 37709 | 206326 | 1.4 | 0 56 20.117 | -72 28 22.155 | 0 56 20.220 | -72 28 21.800 | 17.972 | 17.875 | 17.815 | -0.098 | 0.157 | 0.100 | 7.5 | 1 |
| SMC109 | 9 | sc7? | 61409 | 52826 | 0.7 | 0 57 29.388 | -72 15 50.642 | 0 57 29.430 | -72 15 50.400 | 15.439 | 15.309 | 15.297 | -0.132 | 0.143 | 0.040 | 7.7 | 1 |
| SMC115 | 11 | sc8 | 17373 | 107346 | 1.1 | 0 58 32.446 | -72 17 2.726 | 0 58 32.400 | -72 17 2.500 | 17.241 | 17.159 | 17.151 | -0.082 | 0.090 | 0.070 | 7.3 | 2 |
| SMC120 | 9 | ? | 52588 | 201615 | 1.3 | 0 59 58.683 | -72 22 10.852 | 0 59 58.770 | -72 22 10.600 | 17.046 | 16.935 | 17.105 | -0.111 | -0.060 | 0.070 | 7.7 | 1 |
| SMC120 | 9 | ? | 53224 | 204590 | 0.7 | 1 0 0.041 | -72 21 48.414 | 1 0 0.080 | -72 21 48.100 | 17.901 | 17.827 | 17.812 | -0.073 | 0.089 | 0.070 | 7.7 | 2 |
| SMC121 | 12 | sc8 | 52864 | 198629 | 0.5 | 1 0 7.851 | -72 27 23.470 | 1 0 7.860 | -72 27 23.300 | 17.282 | 17.176 | 17.201 | -0.107 | 0.081 | 0.080 | 7.9 | 1 |
| SMC124 | 11 | sc8 | 11973 | 33070 | 1.5 | 1 0 39.500 | -72 22 30.342 | 1 0 39.600 | -72 22 29.800 | 17.077 | 16.985 | 17.080 | -0.093 | -0.002 | 0.060 | 7.6 | 1 |
| SMC124 | 9 | sc8 | 53703 | 36128 | 0.7 | 1 0 28.993 | -72 21 50.809 | 1 0 29.030 | -72 21 50.400 | 17.738 | 17.602 | 17.872 | -0.135 | -0.134 | 0.060 | 7.6 | 1 |
| SMC124 | 9 | sc8 | 54177 | 36143 | 0.4 | 1 0 37.635 | -72 21 40.713 | 1 0 37.640 | -72 21 40.300 | 17.885 | 17.757 | 18.018 | -0.128 | -0.132 | 0.060 | 7.6 | 1 |
| SMC126 | 12 | sc9 | 22431 | 61658 | 0.6 | 1 1 8.090 | -72 45 9.496 | 1 1 8.130 | -72 45 9.300 | 15.979 | 15.960 | 15.907 | -0.019 | 0.070 | 0.070 | 8 | 1 |
| SMC134 | 11 | sc9 | 23845 | 168530 | 0.5 | 1 3 10.387 | -72 16 17.644 | 1 3 10.380 | -72 16 17.600 | 17.564 | 17.470 | 17.546 | -0.094 | 0.019 | 0.050 | 7.8 | 1 |
| SMC134 | 11 | sc9 | 23538 | 168518 | 0.9 | 1 3 13.945 | -72 16 28.321 | 1 3 14.020 | -72 16 28.200 | 17.738 | 17.553 | 17.902 | -0.183 | -0.165 | 0.050 | 7.8 | 1 |
| SMC137 | 12 | sc9 | 35635 | 150055 | 0.5 | 1 3 27.910 | -72 39 39.381 | 1 3 27.920 | -72 39 39.200 | 17.517 | 17.402 | 17.527 | -0.115 | -0.010 | 0.060 | 7.6 | 1 |
| SMC137 | 12 | sc9 | 35836 | 152784 | 0.7 | 1 3 15.000 | -72 39 23.644 | 1 3 15.060 | -72 39 23.500 | 17.483 | 17.312 | 17.641 | -0.170 | -0.158 | 0.060 | 7.6 | 1 |
| SMC140 | 12 | sc10 | 38692 | 52204 | 0.7 | 1 4 19.306 | -72 38 31.773 | 1 4 19.300 | -72 38 31.500 | 15.897 | 15.746 | 16.030 | -0.151 | -0.133 | 0.090 | 7.2 | 1 |
| SMC147 | 13 | sc10 | 33231 | 110425 | 0.6 | 1 5 8.431 | -71 59 54.859 | 1 5 8.410 | -71 59 54.900 | 15.790 | 15.684 | 15.762 | -0.106 | 0.028 | 0.060 | 7.1 | 1 |
| SMC198 | 6 | sc5 | 49860 | 190524 | 0.8 | 0 50 5.040 | -73 11 14.452 | 0 50 5.140 | -73 11 14.400 | 16.452 | 16.377 | 16.348 | -0.075 | 0.104 | 0.060 | 7.9 | 1 |
| SMC198 | 6 | sc5 | 49985 | 190635 | 0.9 | 0 50 11.713 | -73 11 14.852 | 0 50 11.830 | -73 11 14.800 | 17.110 | 17.027 | 17.043 | -0.083 | 0.067 | 0.060 | 7.9 | 1 |
| Cluster | Image | ID | (B-V)0 | V0 | Mv | (V-I)0 | ST | ID Simbad | ST Simbad |
|---|---|---|---|---|---|---|---|---|---|
| WFI | WFI | ||||||||
| SMC2 | 2 | 11621 | -0.115 | 15.755 | -2.995 | 0.065 | B1 | ||
| SMC8 | 2 | 34493 | -0.185 | 17.001 | -1.749 | -0.114 | B3 | ||
| SMC9 | 2 | 35862 | -0.172 | 16.176 | -2.574 | -0.155 | B1 | ||
| SMC9 | 2 | 35791 | -0.174 | 17.557 | -1.193 | -0.080 | B4 | ||
| SMC11 | 2 | 40080 | -0.321 | 17.338 | -1.412 | 0.194 | B3 | ||
| SMC11 | 2 | 40465 | -0.148 | 17.667 | -1.083 | -0.077 | B4 | ||
| SMC15 | 1 | 9526 | -0.139 | 16.518 | -2.232 | -0.084 | B2 | ||
| SMC16 | 1 | 21973 | -0.078 | 16.172 | -2.578 | -0.010 | B1 | ||
| SMC39 | 6 | 11608 | -0.163 | 17.130 | -1.620 | -0.307 | B3 | ||
| SMC39 | 4 | 17751 | -0.142 | 17.669 | -1.081 | -0.142 | B4 | ||
| SMC39 | 4 | 17374 | -0.037 | 17.740 | -1.010 | 0.113 | B4 | ||
| SMC39 | 4 | 17735 | -0.094 | 17.371 | -1.379 | 0.064 | B4 | ||
| SMC43 | 4 | 47538 | -0.116 | 15.568 | -3.182 | -0.033 | B1 | ||
| SMC47 | 5 | 26309 | -0.160 | 17.481 | -1.269 | -0.220 | B4 | ||
| SMC49 | 6 | 19436 | -0.212 | 16.613 | -2.137 | -0.262 | B2 | ||
| SMC54 | 6 | 25290 | -0.164 | 16.062 | -2.688 | -0.197 | B1 | ||
| SMC61 | 6 | 40386 | -0.163 | 16.777 | -1.973 | -0.117 | B2 | ||
| SMC61 | 6 | 40812 | -0.295 | 17.811 | -0.939 | -0.045 | B5 | ||
| SMC64 | 5 | 32158 | -0.145 | 17.314 | -1.436 | -0.116 | B3 | ||
| SMC64 | 5 | 30619 | -0.073 | 17.680 | -1.070 | -0.109 | B4 | ||
| SMC64 | 5 | 30736 | -0.118 | 17.406 | -1.344 | -0.061 | B4 | ||
| SMC64 | 5 | 32232 | -0.159 | 18.020 | -0.730 | -0.015 | B5 | ||
| SMC66 | 6 | 49018 | -0.180 | 16.907 | -1.843 | -0.165 | B2 | ||
| SMC68 | 6 | 39658 | -0.069 | 17.828 | -0.922 | -0.021 | B5 | ||
| SMC69 | 6 | 53619 | -0.199 | 16.149 | -2.601 | -0.123 | B1 | ||
| SMC69 | 5 | 7652 | -0.157 | 16.311 | -2.439 | -0.061 | B2 | ||
| SMC69 | 5 | 7542 | -0.135 | 17.094 | -1.656 | -0.082 | B3 | ||
| SMC69 | 5 | 6624 | -0.221 | 17.396 | -1.354 | -0.205 | B4 | ||
| SMC69 | 5 | 6231 | -0.158 | 18.242 | -0.508 | -0.126 | B6 | ||
| SMC72 | 6 | 45847 | -0.135 | 17.421 | -1.329 | -0.123 | B4 |
| Cluster | Image | ID | (B-V)0 | V0 | Mv | (V-I)0 | ST | ID Simbad | ST Simbad |
|---|---|---|---|---|---|---|---|---|---|
| WFI | WFI | ||||||||
| SMC99 | 7 | 58955 | -0.169 | 17.123 | -1.627 | -0.096 | B3 | ||
| SMC107 | 9 | 38635 | -0.131 | 16.693 | -2.057 | -0.044 | B2 | ||
| SMC107 | 9 | 38660 | -0.132 | 16.900 | -1.850 | -0.058 | B2 | ||
| SMC107 | 9 | 39170 | -0.210 | 16.807 | -1.943 | -0.172 | B2 | Cl* NGC 330 ROB B18 | *iC |
| SMC107 | 9 | 35214 | -0.139 | 17.283 | -1.467 | -0.092 | B3 | ||
| SMC107 | 9 | 37709 | -0.198 | 17.662 | -1.088 | 0.013 | B4 | ||
| SMC107 | 9 | 35856 | -0.159 | 18.124 | -0.626 | -0.107 | B5 | Cl* NGC 330 G 89 | *iC |
| SMC109 | 9 | 61409 | -0.172 | 15.315 | -3.435 | 0.085 | B0 | ||
| SMC115 | 11 | 17373 | -0.152 | 17.024 | -1.726 | -0.011 | B3 | ||
| SMC120 | 9 | 52588 | -0.181 | 16.829 | -1.921 | -0.161 | B2 | ||
| SMC120 | 9 | 53224 | -0.143 | 17.684 | -1.066 | -0.012 | B4 | ||
| SMC121 | 12 | 52864 | -0.187 | 17.034 | -1.716 | -0.034 | B3 | ||
| SMC124 | 11 | 11973 | -0.153 | 16.891 | -1.859 | -0.088 | B2 | ||
| SMC124 | 9 | 53703 | -0.195 | 17.552 | -1.198 | -0.220 | B4 | ||
| SMC124 | 9 | 54177 | -0.188 | 17.699 | -1.051 | -0.218 | B4 | ||
| SMC126 | 12 | 22431 | -0.089 | 15.762 | -2.988 | -0.031 | B1 | ||
| SMC134 | 11 | 23538 | -0.233 | 17.583 | -1.167 | -0.237 | B4 | ||
| SMC134 | 11 | 23845 | -0.144 | 17.409 | -1.341 | -0.053 | B4 | ||
| SMC137 | 12 | 35635 | -0.175 | 17.331 | -1.419 | -0.096 | B3 | ||
| SMC137 | 12 | 35836 | -0.230 | 17.297 | -1.453 | -0.244 | B3 | ||
| SMC140 | 12 | 38692 | -0.241 | 15.618 | -3.132 | -0.263 | B1 | ||
| SMC147 | 13 | 33231 | -0.166 | 15.604 | -3.146 | -0.058 | B1 | [M2002] SMC 61168 | Em* |
| SMC198 | 6 | 49860 | -0.135 | 16.266 | -2.484 | 0.018 | B2 | ||
| SMC198 | 6 | 49985 | -0.143 | 16.924 | -1.826 | -0.019 | B2 |
| Cluster | Image | Image | ID | ID | r | RA(2000) | DEC(2000) | RA(2000) | DEC(2000) | V | B | I | B-V | V-I | E[B-V] | log(t) | Mult |
|---|---|---|---|---|---|---|---|---|---|---|---|---|---|---|---|---|---|
| WFI | Ogle | WFI | Ogle | ″ | WFI | WFI | Ogle | Ogle | |||||||||
| SMC11 | 2 | sc2 | 39734 | 63847 | 0.8 | 0 41 2.835 | -73 21 11.479 | 0 41 2.860 | -73 21 12.600 | 20.762 | 20.832 | 20.417 | 0.069 | 0.344 | 0.080 | 7.9 | 1 |
| SMC39 | 4 | sc4 | 18277 | 104655 | 1.3 | 0 47 7.353 | -73 28 24.163 | 0 47 7.390 | -73 28 23.200 | 19.937 | 19.822 | 19.993 | -0.115 | -0.056 | 0.110 | 8 | 1 |
| SMC39 | 6 | sc4 | 11532 | 106710 | 0.6 | 0 47 13.047 | -73 28 19.429 | 0 47 12.980 | -73 28 19.300 | 20.467 | 20.315 | 20.476 | -0.152 | -0.009 | 0.110 | 8 | 1 |
| SMC49 | 6 | sc5 | 20245 | 14801 | 0.9 | 0 48 43.036 | -73 24 39.905 | 0 48 42.950 | -73 24 40.800 | 20.820 | 21.054 | 20.668 | 0.233 | 0.151 | 0.060 | 7 | 1 |
| SMC89 | 7 | sc6 | 42527 | 169518 | 1.2 | 0 52 52.054 | -72 37 25.012 | 0 52 52.030 | -72 37 26.400 | 20.387 | 20.522 | 20.439 | 0.135 | -0.052 | 0.090 | 7.3 | 1 |
| SMC141 | 12 | sc10 | 41782 | 53127 | 1.4 | 1 4 35.572 | -72 36 58.556 | 1 4 35.690 | -72 36 59.300 | 19.840 | 19.945 | 19.684 | 0.104 | 0.155 | 0.090 | 8.2 | 1 |
| SMC149 | 11 | sc10 | 44134 | 108869 | 1.2 | 1 5 24.988 | -72 2 31.146 | 1 5 25.040 | -72 2 32.500 | 19.802 | 19.629 | 19.607 | -0.173 | 0.195 | 0.080 | 8.2 | 1 |
| SMC17 | 2 | sc3 | 33282 | 63371 | 1.1 | 0 43 36.954 | -73 26 38.578 | 0 43 36.910 | -73 26 37.800 | 14.178 | 14.361 | 13.847 | 0.181 | 0.331 | 0.100 | 7.9 | 1 |
| SMC33 | 4 | sc4 | 25961 | 56763 | 1.3 | 0 46 11.608 | -73 23 25.468 | 0 46 11.790 | -73 23 25.000 | 14.546 | 14.484 | 14.544 | -0.061 | 0.001 | 0.150 | 7.2 | 1 |
| SMC71 | 5 | sc5 | 26201 | 288705 | 0.3 | 0 51 28.049 | -73 1 0.976 | 0 51 28.040 | -73 1 1.300 | 14.069 | 14.011 | 13.988 | -0.058 | 0.080 | 0.070 | 7.5 | 1 |
| SMC105 | 7 | sc7 | 18826 | 110080 | 0.7 | 0 55 48.587 | -72 52 7.467 | 0 55 48.600 | -72 52 7.100 | 14.777 | 14.717 | 14.635 | -0.060 | 0.142 | 0.110 | 8 | 1 |
| SMC107 | 9 | sc7 | 37633 | 205873 | 1.9 | 0 56 7.039 | -72 28 13.947 | 0 56 7.180 | -72 28 13.500 | 13.395 | 13.423 | 13.230 | 0.028 | 0.165 | 0.100 | 7.5 | 1 |
| SMC187 | 4 | sc4 | 29240 | 106867 | 1.0 | 0 47 4.127 | -73 22 11.456 | 0 47 4.230 | -73 22 10.900 | 14.448 | 14.427 | 14.255 | -0.022 | 0.193 | 0.040 | 8.2 | 2 |
| Cluster | Image | ID | (B-V)0 | V0 | Mv | (V-I)0 | ST | ID Simbad | ST Simbad |
|---|---|---|---|---|---|---|---|---|---|
| WFI | WFI | ||||||||
| SMC11 | 2 | 39734 | -0.011 | 20.514 | 1.764 | 0.229 | A3-A4 | ||
| SMC39 | 4 | 18277 | -0.225 | 19.596 | 0.846 | -0.214 | A0 | ||
| SMC39 | 6 | 11532 | -0.262 | 20.126 | 1.376 | -0.167 | A2 | ||
| SMC49 | 6 | 20245 | 0.173 | 20.634 | 1.884 | 0.065 | A3-A4 | ||
| SMC89 | 7 | 42527 | 0.045 | 20.108 | 1.358 | -0.182 | A2 | ||
| SMC141 | 12 | 41782 | 0.014 | 19.561 | 0.811 | 0.025 | A0 | ||
| SMC149 | 11 | 44134 | -0.253 | 19.554 | 0.804 | 0.080 | A0 | ||
| SMC17 | 2 | 33282 | 0.081 | 13.868 | -4.882 | 0.187 | O8 | LHA 115-S 3 | A7/HAeBe? |
| SMC33 | 4 | 25961 | -0.211 | 14.081 | -4.669 | -0.215 | O8 | ||
| SMC71 | 5 | 26201 | -0.128 | 13.852 | -4.898 | -0.021 | O8 | [MA93] 470 | Em* |
| SMC105 | 7 | 18826 | -0.170 | 14.436 | -4.314 | -0.016 | O9 | 2MASS J00554860-7252073 | Em* |
| SMC107 | 9 | 37633 | -0.072 | 13.085 | -5.665 | 0.021 | O5 | [MFH2007] SMC5-82819 | B2IIIe |
| SMC187 | 4 | 29240 | -0.062 | 14.324 | -4.426 | 0.135 | O9 | LIN 88 | Em* |
| Cluster | Image | Image | ID | ID | r | RA(2000) | DEC(2000) | RA(2000) | DEC(2000) | V | B | I | B-V | V-I | E[B-V] | log(t) | Mult |
|---|---|---|---|---|---|---|---|---|---|---|---|---|---|---|---|---|---|
| WFI | Ogle | WFI | Ogle | ″ | WFI | WFI | Ogle | Ogle | |||||||||
| SMC008 | 2 | sc2 | 32681 | 33368 | 1.2 | 0 40 22.224 | -73 24 49.108 | 0 40 22.420 | -73 24 48.900 | 17.847 | 18.481 | 17.071 | 0.631 | 0.775 | 0.070 | 8 | 1 |
| SMC008 | 2 | sc2 | 33371 | 35303 | 1.5 | 0 40 24.878 | -73 24 26.225 | 0 40 25.120 | -73 24 26.000 | 18.069 | 19.699 | 15.803 | 1.622 | 2.264 | 0.070 | 8 | 1 |
| SMC008 | 2 | sc2 | 32765 | 33369 | 1.3 | 0 40 23.181 | -73 24 46.718 | 0 40 23.390 | -73 24 46.500 | 18.371 | 19.231 | 17.328 | 0.856 | 1.042 | 0.070 | 8 | 1 |
| SMC008 | 2 | sc2 | 33200 | 34401 | 0.5 | 0 40 27.520 | -73 24 36.202 | 0 40 27.470 | -73 24 36.800 | 20.375 | 19.699 | 20.097 | -0.675 | 0.277 | 0.070 | 8 | 2 |
| SMC015 | 1 | sc3 | 9969 | 19977 | 1.0 | 0 42 54.809 | -73 17 15.972 | 0 42 54.770 | -73 17 15.400 | 16.644 | 18.242 | 15.152 | 1.592 | 1.491 | 0.100 | 8.1 | 1 |
| SMC015 | 1 | sc3 | 9516 | 19975 | 1.1 | 0 42 53.612 | -73 17 29.583 | 0 42 53.540 | -73 17 29.000 | 17.246 | 18.649 | 15.412 | 1.397 | 1.834 | 0.100 | 8.1 | 1 |
| SMC015 | 1 | sc3 | 48053 | 23189 | 1.3 | 0 42 49.013 | -73 17 27.348 | 0 42 48.920 | -73 17 28.600 | 20.962 | 21.551 | 20.819 | 0.587 | 0.143 | 0.100 | 8.1 | 1 |
| SMC39 | 4 | sc4 | 18580 | 103684 | 0.9 | 0 47 10.289 | -73 28 17.794 | 0 47 10.450 | -73 28 17.500 | 14.990 | 15.214 | 14.456 | 0.222 | 0.534 | 0.110 | 8 | 2 |
| SMC39 | 4 | sc4 | 18288 | 103753 | 0.9 | 0 47 2.490 | -73 28 21.407 | 0 47 2.640 | -73 28 21.100 | 17.164 | 17.561 | 16.477 | 0.394 | 0.687 | 0.110 | 8 | 1 |
| SMC39 | 4 | sc4 | 17311 | 101180 | 1.2 | 0 47 17.356 | -73 28 59.579 | 0 47 17.590 | -73 28 59.400 | 16.857 | 18.325 | 15.386 | 1.462 | 1.470 | 0.110 | 8 | 1 |
| SMC39 | 4 | sc4 | 18196 | 103749 | 0.8 | 0 47 4.182 | -73 28 24.993 | 0 47 4.330 | -73 28 24.900 | 17.483 | 18.355 | 16.460 | 0.868 | 1.022 | 0.110 | 8 | 1 |
| SMC43 | 4 | sc4? | 46790 | 167294 | 1.1 | 0 47 51.979 | -73 13 33.964 | 0 47 51.990 | -73 13 33.200 | 16.516 | 16.739 | 15.989 | 0.221 | 0.526 | 0.090 | 8.5 | 1 |
| SMC47 | 5 | sc4 | 25512 | 183229 | 1.1 | 0 48 20.914 | -72 59 9.443 | 0 48 20.920 | -72 59 8.700 | 19.375 | 20.016 | 18.423 | 0.639 | 0.951 | 0.120 | 7.8 | 1 |
| SMC49 | 6 | sc5 | 18987 | 11482 | 1.5 | 0 48 35.841 | -73 25 13.652 | 0 48 36.080 | -73 25 13.300 | 17.588 | 18.872 | 16.310 | 1.279 | 1.277 | 0.060 | 7 | 1 |
| SMC49 | 6 | sc5 | 20941 | 11627 | 1.5 | 0 48 35.867 | -73 24 14.297 | 0 48 36.110 | -73 24 14.000 | 17.610 | 18.370 | 16.729 | 0.757 | 0.880 | 0.060 | 7 | 1 |
| SMC49 | 6 | sc5 | 19536 | 14591 | 0.7 | 0 48 39.519 | -73 25 0.760 | 0 48 39.440 | -73 25 1.500 | 21.074 | 20.055 | 20.588 | -1.019 | 0.485 | 0.060 | 7 | 1 |
| SMC54 | 6 | sc5 | 26281 | 95246 | 1.4 | 0 49 19.138 | -73 22 2.087 | 0 49 19.360 | -73 22 1.900 | 16.511 | 16.807 | 16.053 | 0.295 | 0.457 | 0.100 | 8 | 1 |
| SMC54 | 6 | sc5 | 25893 | 95328 | 1.3 | 0 49 17.931 | -73 22 13.403 | 0 49 18.140 | -73 22 13.300 | 18.111 | 19.450 | 16.991 | 1.334 | 1.120 | 0.100 | 8 | 1 |
| SMC61 | 6 | sc5 | 40871 | 105869 | 1.2 | 0 49 59.622 | -73 15 25.497 | 0 49 59.790 | -73 15 25.500 | 17.568 | 18.843 | 16.191 | 1.270 | 1.376 | 0.120 | 7.4 | 1 |
| SMC61 | 6 | sc5 | 40887 | 185816 | 0.8 | 0 50 1.946 | -73 15 27.744 | 0 50 2.010 | -73 15 28.800 | 18.875 | 18.668 | 19.263 | -0.206 | -0.387 | 0.120 | 7.4 | 1 |
| SMC61 | 6 | sc5 | 40536 | 106627 | 0.6 | 0 49 59.189 | -73 15 34.541 | 0 49 59.150 | -73 15 34.500 | 19.446 | 20.264 | 18.538 | 0.815 | 0.907 | 0.120 | 7.4 | 1 |
| SMC64 | 5 | sc5 | 31529 | 214027 | 0.5 | 0 50 48.992 | -72 58 2.871 | 0 50 48.970 | -72 58 3.200 | 17.448 | 19.759 | 15.951 | 2.303 | 1.495 | 0.100 | 8.1 | 1 |
| SMC67 | 5 | sc5 | 56955 | 235186 | 0.2 | 0 50 43.917 | -72 43 40.013 | 0 50 43.950 | -72 43 40.200 | 17.593 | 18.785 | 16.342 | 1.188 | 1.250 | 0.080 | 8.2 | 1 |
| SMC67 | 5 | sc5 | 57052 | 316842 | 0.9 | 0 51 5.906 | -72 43 56.336 | 0 51 5.860 | -72 43 56.300 | 18.143 | 18.780 | 17.275 | 0.634 | 0.868 | 0.080 | 8.2 | 1 |
| SMC68 | 6 | sc5 | 37450 | 260864 | 0.8 | 0 50 49.753 | -73 17 26.850 | 0 50 49.850 | -73 17 26.600 | 17.343 | 18.795 | 15.865 | 1.446 | 1.477 | 0.090 | 7.7 | 1 |
| SMC68 | 6 | sc5 | 39689 | 264985 | 0.3 | 0 51 7.582 | -73 16 42.655 | 0 51 7.570 | -73 16 42.800 | 18.230 | 18.419 | 18.710 | 0.189 | -0.478 | 0.090 | 7.7 | 1 |
| SMC68 | 6 | sc5 | 37302 | 260965 | 0.6 | 0 50 52.260 | -73 17 32.230 | 0 50 52.310 | -73 17 32.000 | 18.215 | 19.388 | 17.026 | 1.169 | 1.188 | 0.090 | 7.7 | 1 |
| SMC68 | 6 | sc5 | 36375 | 261183 | 0.7 | 0 50 58.503 | -73 18 2.273 | 0 50 58.580 | -73 18 2.000 | 18.643 | 19.512 | 17.612 | 0.865 | 1.030 | 0.090 | 7.7 | 1 |
| SMC68 | 8 | sc5 | 12982 | 182074 | 0.9 | 0 50 42.121 | -73 17 36.784 | 0 50 42.220 | -73 17 37.800 | 20.727 | 20.132 | 19.675 | -0.595 | 1.051 | 0.090 | 7.7 | 1 |
| SMC69 | 5 | sc5 | 6154 | 271102 | 1.2 | 0 51 5.335 | -73 9 56.310 | 0 51 5.230 | -73 9 56.600 | 16.829 | 17.790 | 15.601 | 0.956 | 1.227 | 0.080 | 7.6 | 2 |
| SMC69 | 5 | sc5 | 5453 | 271292 | 1.4 | 0 51 12.691 | -73 10 22.098 | 0 51 12.560 | -73 10 22.400 | 18.595 | 19.523 | 17.409 | 0.924 | 1.186 | 0.080 | 7.6 | 1 |
| SMC69 | 5 | sc5 | 5851 | 271393 | 1.2 | 0 51 7.504 | -73 10 7.123 | 0 51 7.420 | -73 10 6.700 | 19.455 | 20.437 | 18.423 | 0.978 | 1.032 | 0.080 | 7.6 | 1 |
| Cluster | Image | Image | ID | ID | r | RA(2000) | DEC(2000) | RA(2000) | DEC(2000) | V | B | I | B-V | V-I | E[B-V] | log(t) | Mult |
|---|---|---|---|---|---|---|---|---|---|---|---|---|---|---|---|---|---|
| WFI | Ogle | WFI | Ogle | ″ | WFI | WFI | Ogle | Ogle | |||||||||
| SMC70 | 6 | sc5 | 39108 | 261948 | 1.1 | 0 51 25.509 | -73 17 9.571 | 0 51 25.520 | -73 17 8.800 | 19.636 | 20.363 | 18.654 | 0.724 | 0.981 | 0.090 | 7.8 | 1 |
| SMC71 | 5 | sc5 | 26433 | 288728 | 0.5 | 0 51 24.596 | -73 0 51.497 | 0 51 24.660 | -73 0 52.000 | 15.915 | 15.888 | 15.247 | -0.028 | 0.667 | 0.070 | 7.5 | 1 |
| SMC72 | 6 | sc6 | 47906 | 17311 | 0.9 | 0 51 42.821 | -73 13 27.500 | 0 51 42.780 | -73 13 27.100 | 16.113 | 16.113 | 15.721 | -0.001 | 0.392 | 0.080 | 7.6 | 2 |
| SMC72 | 6 | sc6 | 47440 | 18048 | 0.6 | 0 51 38.503 | -73 13 23.609 | 0 51 38.500 | -73 13 23.300 | 18.846 | 19.410 | 18.046 | 0.561 | 0.798 | 0.080 | 7.6 | 1 |
| SMC73 | 5 | sc6 | 47237 | 61592 | 0.7 | 0 51 44.171 | -72 49 51.499 | 0 51 44.140 | -72 49 51.500 | 18.021 | 18.971 | 16.946 | 0.947 | 1.074 | 0.110 | 8.2 | 1 |
| SMC74 | 5 | sc6 | 33275 | 49197 | 0.2 | 0 51 55.562 | -72 57 52.561 | 0 51 55.590 | -72 57 53.000 | 16.560 | 17.270 | 15.946 | 0.708 | 0.613 | 0.090 | 8.1 | 1 |
| SMC74 | 5 | sc6 | 34888 | 49148 | 1.4 | 0 52 0.303 | -72 57 6.959 | 0 52 0.200 | -72 57 7.300 | 17.253 | 18.608 | 15.902 | 1.349 | 1.350 | 0.090 | 8.1 | 1 |
| SMC76 | 7 | sc6 | 50781 | 85616 | 1.4 | 0 52 10.630 | -72 31 34.209 | 0 52 10.740 | -72 31 34.000 | 16.553 | 17.364 | 15.375 | 0.807 | 1.177 | 0.070 | 7.4 | 1 |
| SMC82 | 7 | sc6 | 5632 | 135623 | 1.0 | 0 52 49.039 | -72 56 4.506 | 0 52 49.110 | -72 56 4.000 | 18.102 | 19.196 | 16.876 | 1.089 | 1.225 | 0.100 | 7.8 | 1 |
| SMC82 | 7 | sc6 | 7335 | 136216 | 1.2 | 0 52 50.126 | -72 55 15.543 | 0 52 50.220 | -72 55 15.000 | 18.802 | 19.724 | 17.707 | 0.919 | 1.094 | 0.100 | 7.8 | 1 |
| SMC89 | 7 | sc6 | 40128 | 163933 | 1.4 | 0 52 55.540 | -72 38 51.947 | 0 52 55.490 | -72 38 51.300 | 19.677 | 20.519 | 18.336 | 0.838 | 1.340 | 0.090 | 7.3 | 1 |
| SMC89 | 7 | sc6 | 40967 | 164025 | 0.6 | 0 52 52.005 | -72 38 20.721 | 0 52 52.060 | -72 38 21.300 | 20.500 | 20.744 | 18.711 | 0.241 | 1.787 | 0.090 | 7.3 | 1 |
| SMC90 | 8 | sc6 | 5703 | 180279 | 0.3 | 0 53 8.526 | -73 22 21.661 | 0 53 8.530 | -73 22 21.700 | 18.297 | 18.989 | 17.388 | 0.689 | 0.908 | 0.110 | 8.5 | 1 |
| SMC90 | 8 | sc6 | 4344 | 94604 | 0.3 | 0 52 58.810 | -73 22 52.004 | 0 52 58.800 | -73 22 52.100 | 18.366 | 19.064 | 17.527 | 0.695 | 0.838 | 0.110 | 8.5 | 1 |
| SMC98 | 8 | sc7 | 27738 | 8705 | 0.8 | 0 54 48.652 | -73 13 45.658 | 0 54 48.760 | -73 13 45.600 | 17.394 | 18.378 | 16.267 | 0.980 | 1.126 | 0.070 | 8 | 1 |
| SMC98 | 8 | sc7 | 28402 | 8710 | 0.8 | 0 54 50.962 | -73 13 29.594 | 0 54 51.070 | -73 13 29.600 | 17.466 | 18.561 | 16.292 | 1.090 | 1.173 | 0.070 | 8 | 1 |
| SMC98 | 8 | sc7 | 28567 | 8717 | 0.9 | 0 54 39.527 | -73 13 17.041 | 0 54 39.650 | -73 13 17.000 | 17.813 | 18.826 | 16.717 | 1.009 | 1.094 | 0.070 | 8 | 1 |
| SMC98 | 8 | sc7 | 29408 | 8820 | 0.8 | 0 54 49.071 | -73 13 1.449 | 0 54 49.180 | -73 13 1.400 | 18.625 | 19.631 | 17.551 | 1.002 | 1.073 | 0.070 | 8 | 1 |
| SMC99 | 7 | sc7 | 59064 | 70814 | 1.4 | 0 54 45.740 | -72 28 31.559 | 0 54 45.850 | -72 28 31.500 | 16.927 | 18.634 | 15.460 | 1.701 | 1.465 | 0.080 | 7.6 | 1 |
| SMC99 | 7 | sc7 | 59097 | 70929 | 1.2 | 0 54 54.170 | -72 28 20.204 | 0 54 54.270 | -72 28 20.100 | 18.072 | 19.122 | 16.975 | 1.046 | 1.096 | 0.080 | 7.6 | 1 |
| SMC99 | 7 | sc7 | 57172 | 70909 | 1.0 | 0 54 54.435 | -72 27 23.662 | 0 54 54.400 | -72 27 23.400 | 19.261 | 20.806 | 17.677 | 1.539 | 1.582 | 0.080 | 7.6 | 1 |
| SMC104 | 7 | sc7 | 23453 | 115132 | 0.9 | 0 55 27.480 | -72 49 38.621 | 0 55 27.560 | -72 49 38.400 | 20.744 | 20.895 | 15.398 | 0.140 | 5.341 | 0.120 | 8.6 | 1 |
| SMC105 | 7 | sc7 | 17563 | 110095 | 0.7 | 0 55 49.334 | -72 52 44.660 | 0 55 49.390 | -72 52 44.400 | 17.005 | 18.626 | 15.350 | 1.614 | 1.653 | 0.110 | 8 | 1 |
| SMC105 | 7 | sc7 | 18620 | 110103 | 0.8 | 0 55 41.881 | -72 52 8.441 | 0 55 41.950 | -72 52 8.200 | 16.981 | 18.609 | 15.413 | 1.621 | 1.567 | 0.110 | 8 | 1 |
| SMC105 | 7 | sc7 | 17400 | 110205 | 0.7 | 0 55 54.143 | -72 52 52.216 | 0 55 54.200 | -72 52 52.000 | 18.480 | 19.437 | 17.059 | 0.952 | 1.420 | 0.110 | 8 | 1 |
| SMC107 | 9 | sc7 | 37803 | 205874 | 1.8 | 0 56 9.280 | -72 28 9.599 | 0 56 9.410 | -72 28 9.200 | 14.539 | 15.533 | 13.206 | 0.990 | 1.332 | 0.100 | 7.5 | 1 |
| SMC107 | 9 | sc7 | 37219 | 205975 | 0.9 | 0 56 6.388 | -72 28 28.089 | 0 56 6.440 | -72 28 27.600 | 17.271 | 17.794 | 16.418 | 0.521 | 0.852 | 0.100 | 7.5 | 1 |
| SMC107 | 9 | sc7 | 39390 | 206186 | 1.5 | 0 56 25.705 | -72 27 31.044 | 0 56 25.820 | -72 27 30.700 | 17.236 | 99.999 | 17.143 | 9.999 | 0.093 | 0.100 | 7.5 | 1 |
| SMC107 | 9 | sc7 | 40364 | 206615 | 1.2 | 0 56 30.668 | -72 27 2.245 | 0 56 30.750 | -72 27 1.800 | 17.417 | 18.522 | 18.047 | 1.104 | -0.629 | 0.100 | 7.5 | 1 |
| SMC107 | 9 | sc7 | 38179 | 206959 | 1.9 | 0 56 17.677 | -72 28 4.410 | 0 56 17.580 | -72 28 4.000 | 18.074 | 17.720 | 18.214 | -0.353 | -0.140 | 0.100 | 7.5 | 1 |
| SMC107 | 9 | sc7 | 38481 | 209303 | 1.3 | 0 56 18.013 | -72 27 57.427 | 0 56 17.950 | -72 27 57.300 | 17.906 | 17.011 | 17.857 | -0.894 | 0.049 | 0.100 | 7.5 | 1 |
| SMC107 | 9 | sc7 | 38214 | 209255 | 1.2 | 0 56 19.593 | -72 28 1.628 | 0 56 19.680 | -72 28 2.600 | 19.780 | 99.999 | 19.508 | 9.999 | 0.271 | 0.100 | 7.5 | 1 |
| SMC107 | 9 | sc7 | 38775 | 209506 | 1.5 | 0 56 6.528 | -72 27 36.446 | 0 56 6.540 | -72 27 38.200 | 20.654 | 20.961 | 20.177 | 0.305 | 0.477 | 0.100 | 7.5 | 1 |
| Cluster | Image | Image | ID | ID | r | RA(2000) | DEC(2000) | RA(2000) | DEC(2000) | V | B | I | B-V | V-I | E[B-V] | log(t) | Mult |
|---|---|---|---|---|---|---|---|---|---|---|---|---|---|---|---|---|---|
| WFI | Ogle | WFI | Ogle | ″ | WFI | WFI | Ogle | Ogle | |||||||||
| SMC109 | 9 | sc7? | 61352 | 52936 | 0.9 | 0 57 31.114 | -72 16 0.786 | 0 57 31.170 | -72 16 0.400 | 17.537 | 17.554 | 17.094 | 0.016 | 0.443 | 0.040 | 7.7 | 1 |
| SMC109 | 9 | sc7? | 61387 | 54360 | 1.3 | 0 57 29.499 | -72 15 44.768 | 0 57 29.550 | -72 15 45.800 | 18.637 | 99.999 | 19.054 | 9.999 | -0.416 | 0.040 | 7.7 | 1 |
| SMC109 | 9 | sc7? | 61314 | 56075 | 1.3 | 0 57 30.225 | -72 15 58.665 | 0 57 30.190 | -72 15 59.800 | 19.285 | 18.798 | 18.822 | -0.487 | 0.463 | 0.040 | 7.7 | 1 |
| SMC117 | 9 | sc8 | 25911 | 139438 | 1.7 | 0 59 8.344 | -72 36 55.340 | 0 59 8.460 | -72 36 55.000 | 17.504 | 18.668 | 16.290 | 1.159 | 1.213 | 0.130 | 8.3 | 1 |
| SMC117 | 9 | sc8 | 27255 | 139451 | 1.7 | 0 59 10.979 | -72 36 17.866 | 0 59 11.100 | -72 36 17.600 | 17.114 | 18.590 | 15.712 | 1.471 | 1.400 | 0.130 | 8.3 | 1 |
| SMC117 | 9 | sc8 | 27276 | 139453 | 1.7 | 0 59 9.653 | -72 36 15.719 | 0 59 9.770 | -72 36 15.500 | 17.595 | 18.946 | 16.228 | 1.346 | 1.366 | 0.130 | 8.3 | 1 |
| SMC117 | 9 | sc8 | 27278 | 140923 | 0.8 | 0 59 15.301 | -72 36 19.516 | 0 59 15.270 | -72 36 18.900 | 20.172 | 99.999 | 19.687 | 9.999 | 0.485 | 0.130 | 8.3 | 1 |
| SMC120 | 9 | ? | 52998 | 201623 | 0.8 | 0 59 59.006 | -72 21 56.125 | 0 59 59.060 | -72 21 56.000 | 18.319 | 99.999 | 17.052 | 9.999 | 1.266 | 0.070 | 7.7 | 1 |
| SMC121 | 11 | sc8 | 3908 | 198577 | 1.0 | 1 0 8.721 | -72 27 27.194 | 1 0 8.770 | -72 27 26.600 | 17.640 | 18.939 | 16.309 | 1.294 | 1.329 | 0.080 | 7.9 | 1 |
| SMC121 | 11 | sc8 | 3672 | 198575 | 0.9 | 1 0 6.841 | -72 27 36.247 | 1 0 6.880 | -72 27 35.700 | 17.762 | 19.061 | 16.428 | 1.294 | 1.333 | 0.080 | 7.9 | 2 |
| SMC121 | 11 | sc8 | 2725 | 198609 | 1.0 | 1 0 14.928 | -72 28 17.309 | 1 0 14.990 | -72 28 16.800 | 17.989 | 19.016 | 16.644 | 1.023 | 1.345 | 0.080 | 7.9 | 1 |
| SMC124 | 9 | sc8 | 53362 | 32985 | 1.0 | 1 0 30.251 | -72 22 4.533 | 1 0 30.310 | -72 22 4.100 | 17.160 | 18.732 | 15.705 | 1.566 | 1.454 | 0.060 | 7.6 | 1 |
| SMC124 | 9 | sc8 | 53549 | 33086 | 0.7 | 1 0 36.792 | -72 22 0.983 | 1 0 36.830 | -72 22 1.400 | 18.625 | 20.479 | 17.559 | 1.849 | 1.064 | 0.060 | 7.6 | 1 |
| SMC129 | 12 | sc9 | 44327 | 70395 | 0.9 | 1 1 51.493 | -72 33 38.625 | 1 1 51.570 | -72 33 38.500 | 17.442 | 18.656 | 16.184 | 1.210 | 1.257 | 0.090 | 7.3 | 1 |
| SMC129 | 12 | sc9 | 43061 | 70615 | 1.0 | 1 1 47.253 | -72 34 17.029 | 1 1 47.220 | -72 34 16.700 | 18.763 | 19.141 | 17.541 | 0.374 | 1.221 | 0.090 | 7.3 | 1 |
| SMC139 | 12 | sc10 | 17345 | 1376 | 1.0 | 1 3 48.779 | -72 49 36.257 | 1 3 48.790 | -72 49 37.600 | 19.455 | 19.620 | 19.065 | 0.164 | 0.390 | 0.070 | 7.5 | 1 |
| SMC139 | 12 | sc10 | 18035 | 3901 | 1.0 | 1 3 56.135 | -72 49 21.478 | 1 3 56.170 | -72 49 22.800 | 19.582 | 99.999 | 19.078 | 9.999 | 0.503 | 0.070 | 7.5 | 1 |
| SMC141 | 12 | sc10 | 41542 | 52186 | 1.2 | 1 4 30.456 | -72 37 3.988 | 1 4 30.400 | -72 37 3.800 | 15.288 | 15.755 | 14.616 | 0.465 | 0.671 | 0.090 | 8.2 | 1 |
| SMC142 | 11 | sc10 | 34225 | 70818 | 0.2 | 1 4 37.496 | -72 9 38.565 | 1 4 37.510 | -72 9 38.700 | 17.239 | 17.092 | 17.584 | -0.147 | -0.344 | 0.060 | 7.3 | 1 |
| SMC145 | 13 | sc10 | 34943 | 111052 | 1.1 | 1 5 3.973 | -71 59 25.544 | 1 5 3.920 | -71 59 26.100 | 20.125 | 99.999 | 18.893 | 9.999 | 1.231 | 0.070 | 7.9 | 1 |
| SMC149 | 13 | sc10 | 32199 | 108122 | 0.6 | 1 5 20.094 | -72 2 12.586 | 1 5 20.150 | -72 2 12.600 | 16.407 | 16.972 | 15.675 | 0.562 | 0.731 | 0.080 | 8.2 | 1 |
| SMC149 | 13 | sc10 | 31744 | 108108 | 0.9 | 1 5 25.028 | -72 2 35.103 | 1 5 25.110 | -72 2 35.200 | 16.249 | 16.856 | 15.478 | 0.605 | 0.770 | 0.080 | 8.2 | 1 |
| SMC156 | 14 | sc11 | 12631 | 42339 | 1.1 | 1 7 32.126 | -72 45 40.562 | 1 7 32.210 | -72 45 40.200 | 15.747 | 16.192 | 15.085 | 0.443 | 0.661 | 0.090 | 8.2 | 1 |
| SMC156 | 14 | sc11 | 11524 | 40376 | 1.0 | 1 7 36.005 | -72 46 42.845 | 1 7 36.090 | -72 46 42.600 | 17.235 | 17.746 | 16.635 | 0.509 | 0.599 | 0.090 | 8.2 | 1 |
| SMC194 | 6 | sc5 | 27897 | 16254 | 1.4 | 0 49 5.082 | -73 21 3.517 | 0 49 5.290 | -73 21 3.400 | 16.948 | 18.373 | 15.510 | 1.419 | 1.437 | 0.070 | 7.9 | 1 |
| Cluster | Image | ID | (B-V)0 | V0 | Mv | (V-I)0 | ST | ID Simbad | ST Simbad |
|---|---|---|---|---|---|---|---|---|---|
| WFI | WFI | ||||||||
| SMC008 | 2 | 32681 | 0.561 | 17.630 | -1.120 | 0.674 | G0-2III-II: | ||
| SMC008 | 2 | 33371 | 1.552 | 17.852 | -0.898 | 2.163 | M3III: | ||
| SMC008 | 2 | 32765 | 0.786 | 18.154 | -0.596 | 0.941 | G5III | ||
| SMC008 | 2 | 33200 | -0.745 | 20.158 | 1.408 | 0.176 | A2 | [MA93] 11 | Em* |
| SMC015 | 1 | 9969 | 1.492 | 16.334 | -2.416 | 1.347 | M2III-II: | ||
| SMC015 | 1 | 9516 | 1.297 | 16.936 | -1.814 | 1.690 | K9III | ||
| SMC015 | 1 | 48053 | 0.487 | 20.652 | 1.902 | -0.001 | F5III: | ||
| SMC39 | 4 | 18580 | 0.112 | 14.649 | -4.101 | 0.376 | B5II: | 2MASS J00471042-7328180 | star |
| SMC39 | 4 | 18288 | 0.284 | 16.823 | -1.927 | 0.529 | F1II: | ||
| SMC39 | 4 | 17311 | 1.352 | 16.516 | -2.234 | 1.312 | M1III-II: | ||
| SMC39 | 4 | 18196 | 0.758 | 17.142 | -1.608 | 0.864 | G5III-II: | ||
| SMC43 | 4 | 46790 | 0.131 | 16.237 | -2.513 | 0.396 | A7II: | [MA93] 193 | Em* |
| SMC47 | 5 | 25512 | 0.519 | 19.003 | 0.253 | 0.778 | A9III: | ||
| SMC49 | 6 | 18987 | 1.219 | 17.402 | -1.348 | 1.191 | B3-B4 | ||
| SMC49 | 6 | 20941 | 0.697 | 17.424 | -1.326 | 0.794 | G5III-II: | ||
| SMC49 | 6 | 19536 | -1.079 | 20.888 | 2.138 | 0.399 | A5-A6 | ||
| SMC54 | 6 | 26281 | 0.195 | 16.201 | -2.549 | 0.313 | A8II: | ||
| SMC54 | 6 | 25893 | 1.234 | 17.801 | -0.949 | 0.976 | K5III | ||
| SMC61 | 6 | 40871 | 1.150 | 17.196 | -1.554 | 1.203 | K5III | ||
| SMC61 | 6 | 40887 | -0.326 | 18.503 | -0.247 | -0.560 | B8 | ||
| SMC61 | 6 | 40536 | 0.695 | 19.074 | 0.324 | 0.734 | F1III: | ||
| SMC64 | 5 | 31529 | 2.203 | 17.138 | -1.612 | 1.351 | MIII: | ||
| SMC67 | 5 | 56955 | 1.108 | 17.345 | -1.405 | 1.135 | K5III | ||
| SMC67 | 5 | 57052 | 0.554 | 17.895 | -0.855 | 0.753 | G0-2III-II: | ||
| SMC68 | 6 | 37450 | 1.356 | 17.064 | -1.686 | 1.347 | K9III | ||
| SMC68 | 6 | 39689 | 0.099 | 17.951 | -0.799 | -0.608 | B9III-II: | ||
| SMC68 | 6 | 37302 | 1.079 | 17.936 | -0.814 | 1.058 | K2III | ||
| SMC68 | 6 | 36375 | 0.775 | 18.364 | -0.386 | 0.900 | G5III | ||
| SMC68 | 8 | 12982 | -0.685 | 20.448 | 1.698 | 0.921 | A3-A4 | ISO-MCMS J005041.5-731739 | Em* |
| SMC69 | 5 | 6154 | 0.876 | 16.581 | -2.169 | 1.112 | G3II: | ||
| SMC69 | 5 | 5453 | 0.844 | 18.347 | -0.403 | 1.071 | G5III | ||
| SMC69 | 5 | 5851 | 0.898 | 19.207 | 0.457 | 0.917 | G3III: |
| Cluster | Image | ID | (B-V)0 | V0 | Mv | (V-I)0 | ST | ID Simbad | ST Simbad |
|---|---|---|---|---|---|---|---|---|---|
| WFI | WFI | ||||||||
| SMC70 | 6 | 39108 | 0.634 | 19.357 | 0.607 | 0.851 | F1III: | ||
| SMC71 | 5 | 26433 | -0.098 | 15.698 | -3.052 | 0.566 | B9III-II: | ||
| SMC72 | 6 | 47906 | -0.081 | 15.865 | -2.885 | 0.277 | B8III: | [WSH2003] d-129 ? | IR |
| SMC72 | 6 | 47440 | 0.481 | 18.598 | -0.152 | 0.683 | A8III: | ||
| SMC73 | 5 | 47237 | 0.837 | 17.680 | -1.070 | 0.916 | G8III-II: | ||
| SMC74 | 5 | 33275 | 0.618 | 16.281 | -2.469 | 0.483 | F9II: | 2MASS J00515560-7257534 | IR, Cepheid |
| SMC74 | 5 | 34888 | 1.259 | 16.974 | -1.776 | 1.220 | K9III | ||
| SMC76 | 7 | 50781 | 0.737 | 16.336 | -2.414 | 1.076 | G0II: | 2MASS J00521076-7231342 | Em* |
| SMC82 | 7 | 5632 | 0.989 | 17.792 | -0.958 | 1.081 | K0III: | ||
| SMC82 | 7 | 7335 | 0.819 | 18.492 | -0.258 | 0.950 | G5III | ||
| SMC89 | 7 | 40128 | 0.748 | 19.398 | 0.648 | 1.210 | F5III: | ||
| SMC89 | 7 | 40967 | 0.151 | 20.221 | 1.471 | 1.657 | A5IV: | 2MASS J00525211-7238206 | Em* |
| SMC90 | 8 | 5703 | 0.579 | 17.956 | -0.794 | 0.750 | G0-2III-II: | ||
| SMC90 | 8 | 4344 | 0.585 | 18.025 | -0.725 | 0.680 | G0-2III-II: | ||
| SMC98 | 8 | 27738 | 0.910 | 17.177 | -1.573 | 1.025 | K2III-II | ||
| SMC98 | 8 | 28402 | 1.020 | 17.249 | -1.501 | 1.072 | K3III-II: | ||
| SMC98 | 8 | 28567 | 0.939 | 17.596 | -1.154 | 0.993 | K0III: | ||
| SMC98 | 8 | 29408 | 0.932 | 18.408 | -0.342 | 0.972 | G8III | ||
| SMC99 | 7 | 59064 | 1.621 | 16.679 | -2.071 | 1.350 | M3III-II: | ||
| SMC99 | 7 | 59097 | 0.966 | 17.824 | -0.926 | 0.981 | K0III: | ||
| SMC99 | 7 | 57172 | 1.459 | 19.013 | 0.263 | 1.467 | K9III | ||
| SMC104 | 7 | 23453 | 0.020 | 20.372 | 1.622 | 5.168 | A3-A4V | ||
| SMC105 | 7 | 17563 | 1.504 | 16.664 | -2.086 | 1.495 | M2III-II: | ||
| SMC105 | 7 | 18620 | 1.511 | 16.640 | -2.110 | 1.409 | M2III-II: | ||
| SMC105 | 7 | 17400 | 0.842 | 18.139 | -0.611 | 1.262 | G5III | ||
| SMC107 | 9 | 37803 | 0.890 | 14.229 | -4.521 | 1.188 | K4I | [MFH2007] SMC5-2807 | Sge, EB |
| SMC107 | 9 | 37219 | 0.421 | 16.961 | -1.789 | 0.708 | F5II: | Cl* NGC 330 KWBBE 485 | IR, HB[e], AGB |
| SMC107 | 9 | 39390 | _ | 16.926 | -1.824 | -0.051 | B2 | Cl* NGC 330 KWBBE 1845 | *iC |
| SMC107 | 9 | 40364 | 1.004 | 17.107 | -1.643 | -0.773 | K3III-II: | Cl* NGC 330 KWBBE 4154 | PN |
| SMC107 | 9 | 38179 | -0.453 | 17.764 | -0.986 | -0.284 | B5-B6 | Cl* NGC 330 KWBBE 458 | *iC |
| SMC107 | 9 | 38481 | -0.994 | 17.596 | -1.154 | -0.095 | B5-B6 | Cl* NGC 330 KWBBE 453 | *iC |
| SMC107 | 9 | 38214 | _ | 19.470 | 0.720 | 0.127 | A0 | Cl* NGC 330 ROB A32 | *iC |
| SMC107 | 9 | 38775 | 0.205 | 20.344 | 1.594 | 0.333 | A4IV: | Cl* NGC 330 ROB B21 | B1/B2II/IIIe |
| SMC109 | 9 | 61352 | -0.024 | 17.413 | -1.337 | 0.385 | B3-B4 | ||
| SMC109 | 9 | 61387 | _ | 18.513 | -0.237 | -0.474 | B8 | ||
| SMC109 | 9 | 61314 | -0.527 | 19.161 | 0.411 | 0.405 | B9 |
| Cluster | Image | ID | (B-V)0 | V0 | Mv | (V-I)0 | ST | ID Simbad | ST Simbad |
|---|---|---|---|---|---|---|---|---|---|
| WFI | WFI | ||||||||
| SMC117 | 9 | 25911 | 1.029 | 17.101 | -1.649 | 1.026 | K3III-II: | ||
| SMC117 | 9 | 27255 | 1.341 | 16.711 | -2.039 | 1.213 | M1III-II: | ||
| SMC117 | 9 | 27276 | 1.216 | 17.192 | -1.558 | 1.179 | K5III | ||
| SMC117 | 9 | 27278 | _ | 19.769 | 1.019 | 0.298 | A1 | ||
| SMC120 | 9 | 52998 | _ | 18.102 | -0.648 | 1.165 | B5-B6 | ||
| SMC121 | 11 | 3908 | 1.214 | 17.392 | -1.358 | 1.214 | K5III | ||
| SMC121 | 11 | 3672 | 1.214 | 17.514 | -1.236 | 1.218 | K5III | ||
| SMC121 | 11 | 2725 | 0.943 | 17.741 | -1.009 | 1.230 | K0III: | ||
| SMC124 | 9 | 53362 | 1.506 | 16.974 | -1.776 | 1.368 | M2III-II: | ||
| SMC124 | 9 | 53549 | 1.789 | 18.439 | -0.311 | 0.978 | MIII: | ||
| SMC129 | 12 | 44327 | 1.120 | 17.163 | -1.587 | 1.127 | K5III | ||
| SMC129 | 12 | 43061 | 0.284 | 18.484 | -0.266 | 1.091 | A0III: | ||
| SMC139 | 12 | 17345 | 0.094 | 19.238 | 0.488 | 0.289 | A3III | ||
| SMC139 | 12 | 18035 | _ | 19.365 | 0.615 | 0.402 | A0 | ||
| SMC141 | 12 | 41542 | 0.375 | 15.009 | -3.741 | 0.541 | A9II: | ||
| SMC142 | 11 | 34225 | -0.207 | 17.053 | -1.697 | -0.430 | B2 | [MA93] 1471 | Em* |
| SMC145 | 13 | 34943 | _ | 19.908 | 1.158 | 1.130 | A1 | [FBR2002] J010505-715936 ? | Rad |
| SMC149 | 13 | 32199 | 0.482 | 16.159 | -2.591 | 0.616 | F3II: | OGLE SMC-SC10 108122 | Cepheid? |
| SMC149 | 13 | 31744 | 0.525 | 16.001 | -2.749 | 0.655 | F5II: | ||
| SMC156 | 14 | 12631 | 0.353 | 15.468 | -3.282 | 0.531 | F0II: | ||
| SMC156 | 14 | 11524 | 0.419 | 16.956 | -1.794 | 0.469 | F5II: | ||
| SMC194 | 6 | 27897 | 1.349 | 16.731 | -2.019 | 1.336 | M1III-II: |
[x]llllllllll
emission-line star from WFI without identification in SC catalogues from Ogle (Udalski et al. 1998). The status indicates
whether the star is found as a definite emission-line star (ELS) or a candidate emission-line star (ELS?)
Cluster Image ID RA(2000) DEC(2000) E[B-V] log(t) status ID Simbad ST Simbad
WFI WFI WFI WFI
\endfirstheadcontinued.
Cluster Image ID RA(2000) DEC(2000) E[B-V] log(t) status ID Simbad ST Simbad
WFI WFI WFI WFI
\endhead\endfootSMC12 1 45403 0 41 24.034 -72 53 54.477 0.06 9 ELS?
SMC12 1 46376 0 41 18.777 -72 53 8.976 0.06 9 ELS?
SMC47 5 27197 0 48 34.021 -72 58 35.742 0.12 7.8 ELS
SMC49 6 21247 0 48 40.269 -73 24 8.730 0.06 7 ELS?
SMC64 5 31661 0 50 39.163 -72 57 51.239 0.1 8.1 ELS OGLE J005039.05-725751.4 Be?
SMC78 8 49392 0 52 16.683 -73 1 24.842 0.08 7.9 ELS LIN 202 Em*
SMC81 7 36209 0 52 37.860 -72 40 49.885 0.12 7.4 ELS?
SMC82 7 61803 0 52 39.276 -72 55 29.603 0.12 7.4 ELS
SMC83 8 54326 0 52 41.180 -72 59 19.144 0.09 7.8 ELS
SMC83 8 55937 0 52 47.000 -72 58 32.314 0.09 7.8 ELS
SMC89 7 39236 0 53 11.104 -72 39 34.315 0.09 7.3 ELS 2dFS 5064 Em*
SMC89 7 39526 0 52 59.533 -72 39 16.040 0.09 7.3 ELS LIN 226 Em*
SMC89 7 39545 0 53 19.997 -72 39 30.179 0.09 7.3 ELS
SMC89 7 39828 0 52 56.260 -72 39 4.350 0.09 7.3 ELS
SMC89 7 42020 0 53 22.264 -72 38 7.245 0.09 7.3 ELS [MA93] 666 Em*
SMC89 7 42367 0 53 5.564 -72 37 40.918 0.09 7.3 ELS
SMC89 7 42626 0 53 34.325 -72 37 52.327 0.09 7.3 ELS [MA93] 685 Em*
SMC89 7 42727 0 52 58.857 -72 37 22.725 0.09 7.3 ELS 2MASS J00525899-7237226 Em*
SMC89 7 44110 0 52 38.895 -72 36 19.773 0.09 7.3 ELS 2MASS J00523904-7236198 Em*
SMC89 7 39179 0 53 4.863 -72 39 31.443 0.09 7.3 ELS?
SMC89 7 40377 0 52 44.290 -72 38 35.552 0.09 7.3 ELS?
SMC89 7 40732 0 53 24.642 -72 38 52.211 0.09 7.3 ELS?
SMC89 7 41098 0 52 47.476 -72 38 18.479 0.09 7.3 ELS? [MA93] 604 Em*
SMC89 7 41948 0 52 58.205 -72 37 50.734 0.09 7.3 ELS?
SMC89 7 42509 0 53 7.017 -72 37 37.569 0.09 7.3 ELS?
SMC89 7 44408 0 53 5.257 -72 36 26.778 0.09 7.3 ELS?
SMC92 7 27577 0 53 19.087 -72 46 2.259 0.12 7.4 ELS? 2MASS J00531922-7246019 Em*
SMC107 9 38884 0 56 15.777 -72 27 58.477 0.1 7.5 ELS Cl* NGC 330 ROB A12 Be*
SMC107 9 39126 0 56 27.281 -72 27 41.167 0.1 7.5 ELS Cl* NGC 330 KWBBE 1830 *iC
SMC107 9 39781 0 56 17.936 -72 27 13.754 0.1 7.5 ELS [MFH2007] SMC5-14727 B2IVe
SMC126 12 22678 1 0 56.081 -72 44 54.142 0.07 8 ELS
SMC128 11 9857 1 1 28.530 -72 24 29.437 0.09 7.1 ELS
SMC128 11 10054 1 1 35.187 -72 24 27.118 0.09 7.1 ELS?
SMC134 11 23759 1 3 10.322 -72 16 19.565 0.05 7.8 ELS?
SMC137 12 35467 1 3 22.062 -72 39 41.917 0.06 7.6 ELS
SMC137 12 36127 1 3 30.300 -72 39 24.713 0.06 7.6 ELS
SMC137 12 37019 1 3 30.051 -72 38 54.070 0.06 7.6 ELS?
SMC139 12 17319 1 3 51.369 -72 49 39.385 0.07 7.5 ELS
SMC139 12 17598 1 3 52.447 -72 49 31.960 0.07 7.5 ELS [MA93] 1420 ? Em*
SMC139 12 17417 1 3 55.757 -72 49 39.585 0.07 7.5 ELS?
SMC140 12 37541 1 4 18.979 -72 39 10.941 0.09 7.2 ELS [MA93] 1456 Em*
SMC142 11 33354 1 4 38.296 -72 10 11.999 0.06 7.3 ELS
SMC142 11 33470 1 4 28.547 -72 10 0.257 0.06 7.3 ELS
SMC142 11 33596 1 4 27.137 -72 9 54.350 0.06 7.3 ELS [MA93] 1462 Em*
SMC153 13 16305 1 6 52.020 -72 16 39.709 0.04 7.2 ELS
SMC153 13 16434 1 6 46.229 -72 16 29.729 0.04 7.2 ELS
SMC153 13 16267 1 6 44.544 -72 16 36.636 0.04 7.2 ELS? [M2002] SMC 64573 star
SMC160 13 4716 1 8 37.597 -72 26 21.269 0.04 7.6 ELS?
SMC160 14 34767 1 8 34.857 -72 26 11.936 0.04 7.6 ELS?
Appendix D HR diagrammes for individual open clusters
Colour/magnitude (Mv, (B-V)0) diagrammes are presented separately for each open cluster in the SMC with at least 10 members and at least 1 WFI emission-line star with OGLE photometry Udalski et al. (1998)
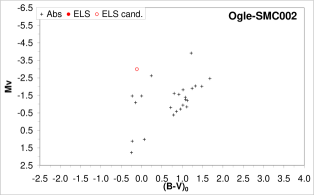 |
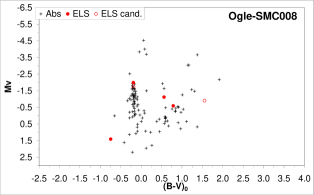 |
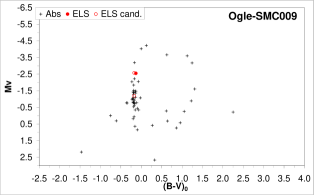 |
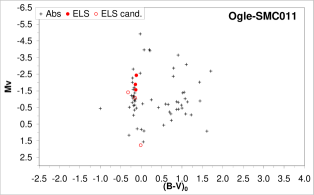 |
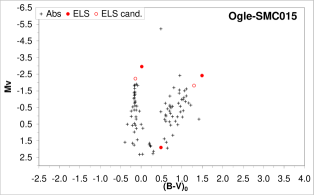 |
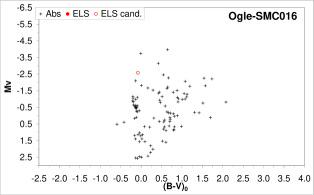 |
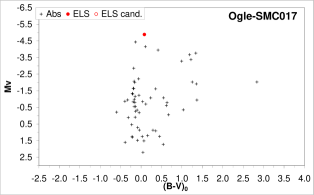 |
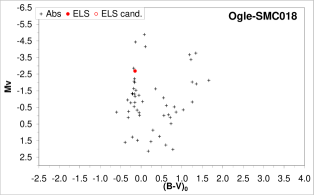 |
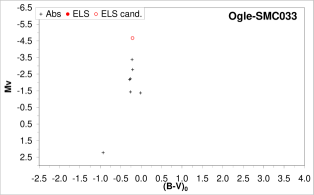 |
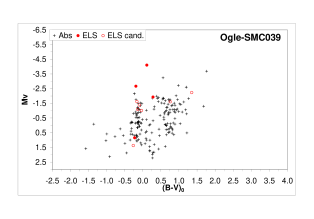 |
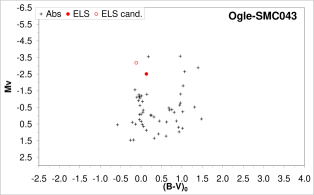 |
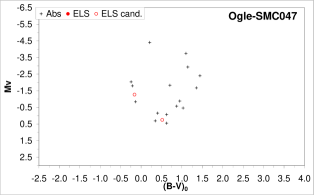 |
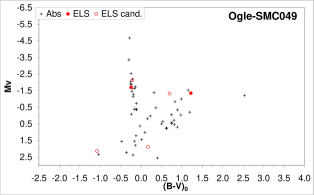 |
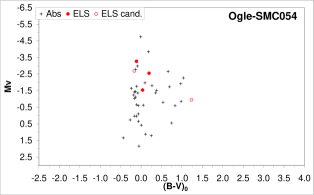 |
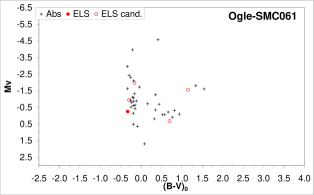 |
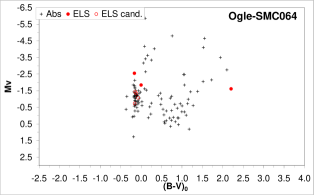 |
 |
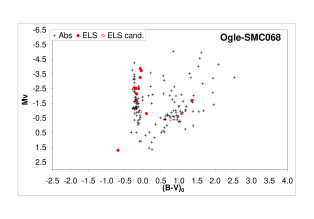 |
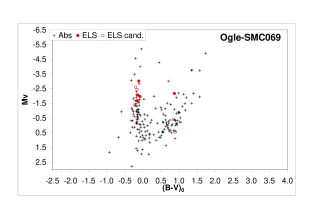 |
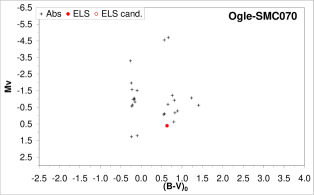 |
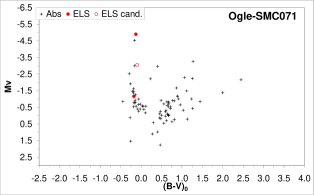 |
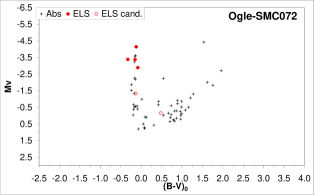 |
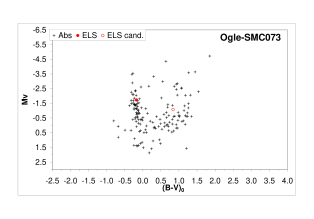 |
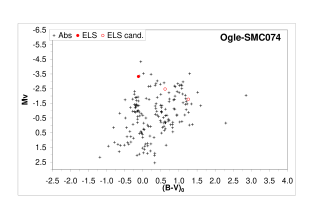 |
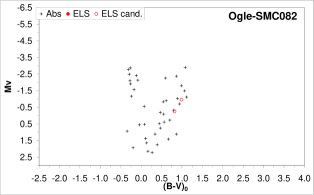 |
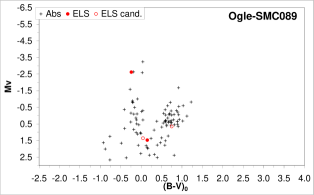 |
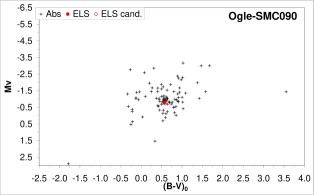 |
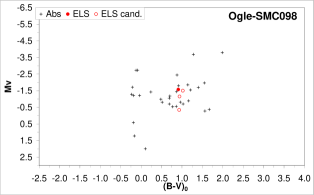 |
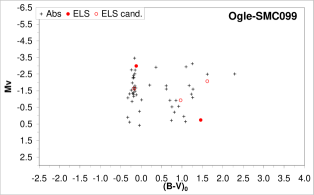 |
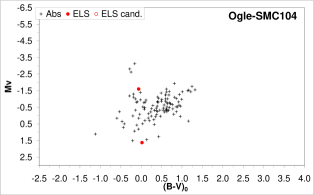 |
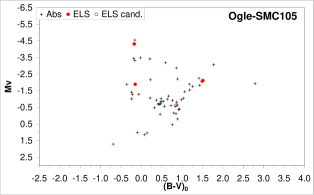 |
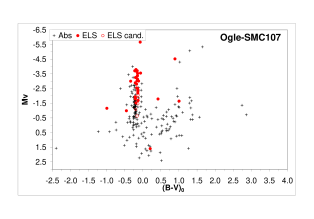 |
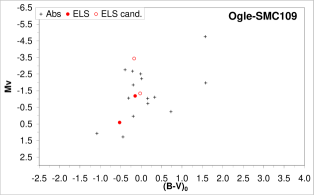 |
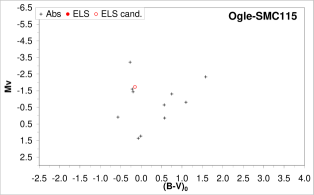 |
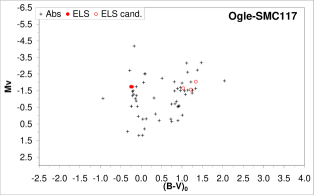 |
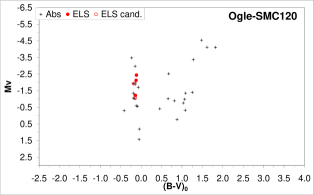 |
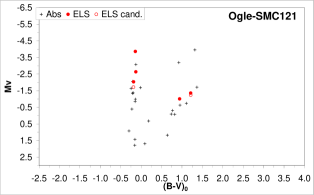 |
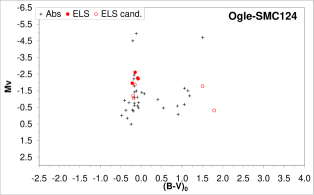 |
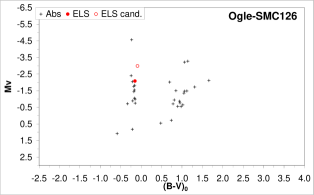 |
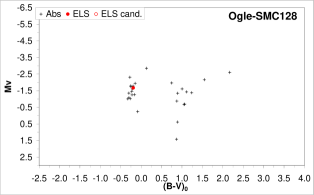 |
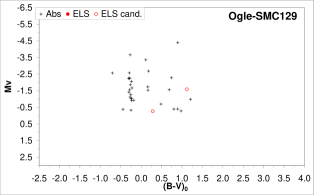 |
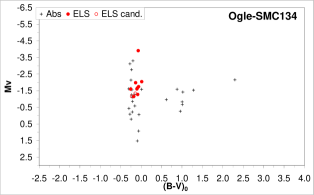 |
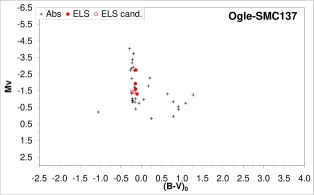 |
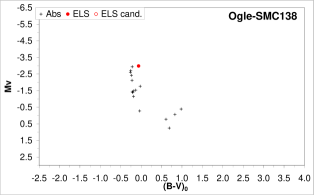 |
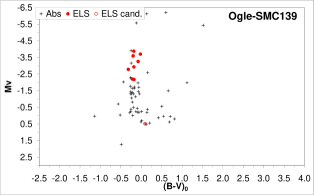 |
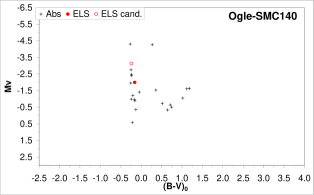 |
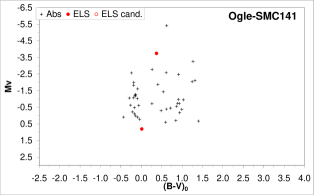 |
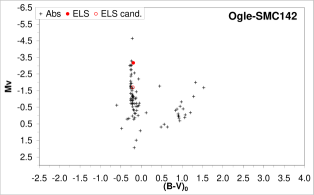 |
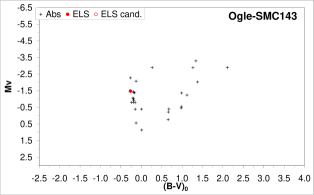 |
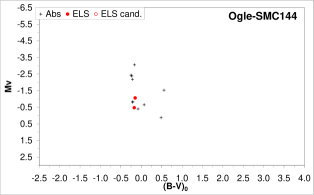 |
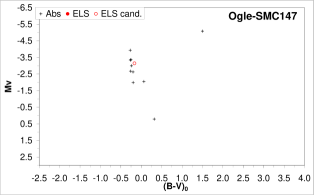 |
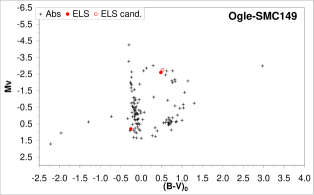 |
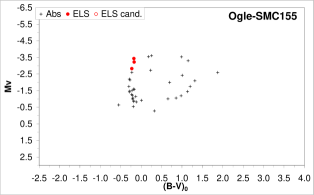 |
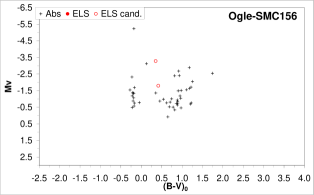 |
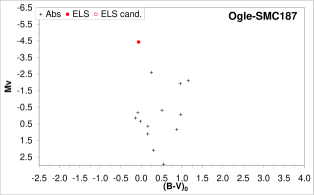 |
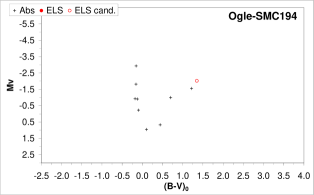 |
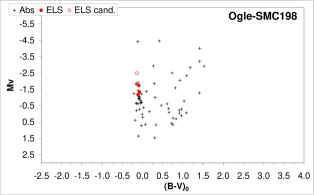 |