Polycyclic Aromatic Hydrocarbons in Galaxies at z 0.1: the Effect of Star Formation and AGN
Abstract
We present the analysis of the Polycyclic Aromatic Hydrocarbon (PAH) spectra of a sample of 92 typical star forming galaxies at observed with the Spitzer IRS. We compare the relative strengths of PAH emission features with SDSS optical diagnostics to probe the relationship between PAH grain properties and star formation and AGN activity. Short-to-long wavelength PAH ratios, and in particular the 7.7 µm-to-11.3 µm feature ratio, are strongly correlated with the star formation diagnostics and H equivalent width, increasing with younger stellar populations. This ratio also shows a significant difference between active and non-active galaxies, with the active galaxies exhibiting weaker 7.7 µm emission. A hard radiation field as measured by and affects PAH ratios differently depending on whether this field results from starburst activity or an AGN. Our results are consistent with a picture in which larger PAH molecules grow more efficiently in richer media and in which smaller PAH molecules are preferentially destroyed by AGN.
1 INTRODUCTION
The mid-infrared spectra of star forming galaxies are punctuated by a series of broad peaks that dominate the emission between 3 and m. These bands are generally accepted to result from the vibrational modes of Polycyclic Aromatic Hydrocarbons (PAHs) (Léger et al., 1989; Allamandola et al., 1989). PAH molecules — planar lattices of aromatic rings containing from 10’s to 100’s of carbon atoms — suffuse the interstellar medium of our own Galaxy. Their vibrational modes are excited by absorption of UV photons, and in heavily star forming galaxies the PAH bands alone can contribute a substantial fraction of the reprocessed light. Given that bolometric infrared (IR) emission has long been an important measure of star formation due to the large fraction of dust-absorbed starlight that is re-emitted in the IR, the PAH bands themselves offer great promise as a more detailed diagnostic of star formation history and as a probe of star formation in heavily dust-obscured galaxies.
A major factor limiting the diagnostic use of galactic PAH emission is that the detailed physics of large PAH molecules is poorly understood. Models of stochastic heating of dust grains predict that the relative strengths of PAH bands are dependent on the size distribution of PAH grains and on the ionization state of the molecules (Schutte et al., 1993; Draine & Li, 2007). However laboratory tests of PAHs have been limited to smaller size molecules than dominate the interstellar medium (Oomens et al., 2003; Kim et al., 2001). As a result, the confidence with which the results of these models can be applied to interstellar PAH spectra is still uncertain. Nonetheless, such models indicate that measurements of relative PAH band strengths will provide valuable measures of PAH growth and destruction and of the ambient radiation field.
Observationally, the overall shape of the PAH spectrum shows remarkable similarity across a broad range of environments within our own Galaxy, and across a range of star formation histories in other galaxies. However there are still significant variations observed in the relative strengths of certain PAH emission bands. Infrared Space Observatory (ISO) and Spitzer studies (Peeters et al., 2004; Smith et al., 2007; Galliano et al., 2008) have revealed trends between PAH band ratios and various properties of the galaxy, including AGN activity, star formation history, and/or galaxy morphology. Yet, because these properties are themselves related, it has been difficult to disentangle primary physical processes responsible for variations in PAH spectra.
To begin to understand the links between galaxies’ PAH emission and their physical properties, it is essential to study a sample spanning the full range of normal galaxy properties, and this sample must include extensive multi-wavelength data to enable characterization of convolved physical properties. These were the primary driving goals behind the Spitzer SDSS GALEX Spectroscopic Survey (SSGSS). The SSGSS sample covers galaxies from the blue cloud to the red sequence and transitional galaxies in between, spanning two orders of magnitude in stellar mass, colour, and dust attenuation. It combines both broad-wavelength-coverage and high-resolution IRS spectroscopy with a thorough suite of multi-wavelength data spanning the far ultraviolet to the far infrared. This makes it the ideal data set for studying the connection between galaxies’ detailed IR emission and their physical properties.
In this paper we study the effect of star formation, metallicity, radiation field, and AGN incidence on PAH molecules by looking at the connection between relative PAH emission strengths and optical diagnostics of these properties. In Section 2 we describe the sample selection, data reduction and spectral decomposition. In Section 3 we study the relationships between the relative strengths of the strongest PAH bands and a range optical diagnostics. In Section 4 we present our conclusions.
2 OBSERVATIONS AND SPECTRAL ANALYSIS
2.1 Sample, Observations and Data Reduction
The full details of the SSGSS sample selection, observations, and data reduction are reported in O’Dowd et al. (2009, in preparation). To summarize:
SSGSS is a Spitzer spectroscopic survey of 101 normal, star-forming galaxies from the Lockman Hole region. This square degree field of low Galactic HI/cirrus is extensively surveyed in multiple wavebands. SSGSS galaxies were selected to have coverage by SDSS, GALEX and IRAC (4 channel) and MIPS (24 µm, 70 µm). We applied a surface brightness limit of I MJy sr-1, and a flux limit of F mJy. These criteria yielded 154 galaxies, from which we selected 101 galaxies to span the range of normal galaxy properties by uniformly sampling vs. NUV-K space. This sample has a redshift range of with median redshift , and a total infrared luminosity range of , with median .
Spectroscopy was obtained in staring mode using the ’low-res’ Short-Low (SL) and Long-Low (LL) IRS modules for the entire sample, providing 5.2—38.0 µm coverage with resolving power of 60 to 125. ’Hi-res’ Short-high (SH) spectroscopy was obtained for a subsample of the brightest 33 galaxies, providing 9.9—19.6 µm coverage at . For the bright subsample, exposure times were 8 min for the SL and LL modules, and 16 min for SH. For the remaining sample, exposure times were 8 min for SL and 16 min for LL. All data were taken during Spitzer IRS campaign 37.
We used the 2-D Spitzer data products processed by the Spitzer Pipeline version S15.3.0, which performed standard IRS calibration (ramp fitting, dark subtraction, droop, linearity correction and distortion correction, flat fielding, masking and interpolation, and wavelength calibration). Sky subtraction was performed manually, with sky frames constructed from the 2-D data frames, utilizing the shift in galaxy spectrum position between orders to obtain clean sky regions. IRSCLEAN (v.1.9) was used to clean bad and rogue pixels. SPICE was used to extract 1-D spectra, and these spectra were finally combined and stitched manually by weighted mean.
Due to problems with some observations, the sample studied in this paper consists of 92 galaxies observed with the low-res modules and a subset of 32 observed at hi-res. In addition, for subset of sources spectrophotometric calibration failed for the SL 2nd order module, resulting in fluxes a factor of lower than expected based on the SL 1nd order module spectrum and IRAC photometry. We eliminate these sources from analyses involving the affected spectral region, as described in Section 2.2.3.
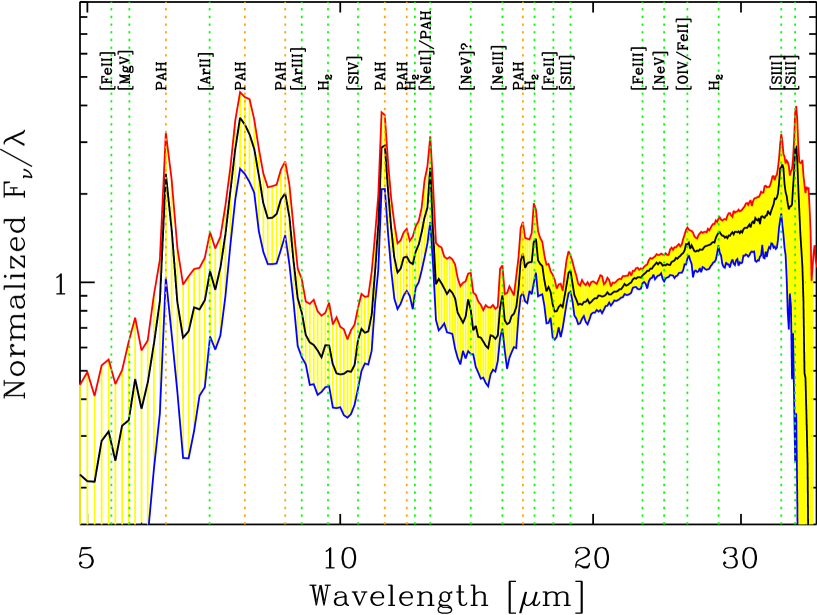
Figure 1 shows the composite low-res spectrum for this sample. PAH features and complexes at 6.2, 7.7, 8.6, 11.3, 12, 12.6, and 17 µm are prominent, as are a number of atomic emission lines. A thermal dust continuum component dominates redward of µm. These composite spectra are normalized between 20 µm and 24 µm.
2.1.1 Aperture Effects
The short- and long-low resolution IRS modules have respective slit widths of 37 and 105, corresponding to physical sizes of 2—12 kpc and 10—34 kpc over the redshift range of the sample, with respective medians 5.5 kpc and 15.6 kpc. The reduction process makes a flux correction for aperture effects assuming a point-like source. The maximum correction is at the intersection of the SL and LL modules, where the slit-loss is 15% and 45% respectively. Some error may be introduced due the fact that the different apertures sample different regions of the galaxy. Fortunately, the PAH features of primary interest are between 6.2 and 11.3 µm, and so all lie in the short-low regime, and are thus largely self-consistent.
Aperture effects may also arise from the wavelength-dependent PSF width. In extended sources, this may result in increased sampling of central regions at the expense of extended regions with increasing wavelength. We use IRAC and MIPS photometry in the 6, 8, 16 & 24 µm bands to explore this effect, and find that the difference due to aperture effects in the 7.7 µm-to-11.4 µm PAH ratio is on average less than 15%, and we find no systematic bias in this effect with any of the optical properties studied in this paper.
The SDSS fibre diameter is 3″, corresponding to a physical 1.6—9.7 kpc, with a median of 4.5 kpc, over the redshift range of the sample. This is sufficiently close to the scale sampled by the SL slit that aperture effects with SDSS data are expected to be minimal.
2.2 Spectral Fitting and PAH Strengths
To measure the strengths of the PAH features we use the PAHFIT spectral decomposition code of Smith et al. (2007) (S07). This code performs fitting of multiple spectral components, including PAH features modeled as Drude profiles, the thermal dust continuum, starlight, prominent emission lines, and dust extinction. For ease of comparison with the results of S07, we use identical temperatures for the thermal continuum components and identical central wavelengths and widths for the PAH features.
We report a sample of the fitted fluxes of the most prominent PAH features and PAH feature complexes in Table 1. These include the 6.2 and 8.3 µm bands, which are discrete PAH features, and the 7.7, 11.3, and 17 µm complexes, which are blends of 3, 2, and 4 subfeatures respectively. Henceforth, we refer to individual PAH features and complexes of multiple features simply as ’features’. In Table 1 also report the fitted dust extinction optical depth, and the integrated line strengths for [NeII] and [NeIII]. The full table, including the entire data set and uncertainties for all parameters, is available in the Astrophysical Journal electronic edition.
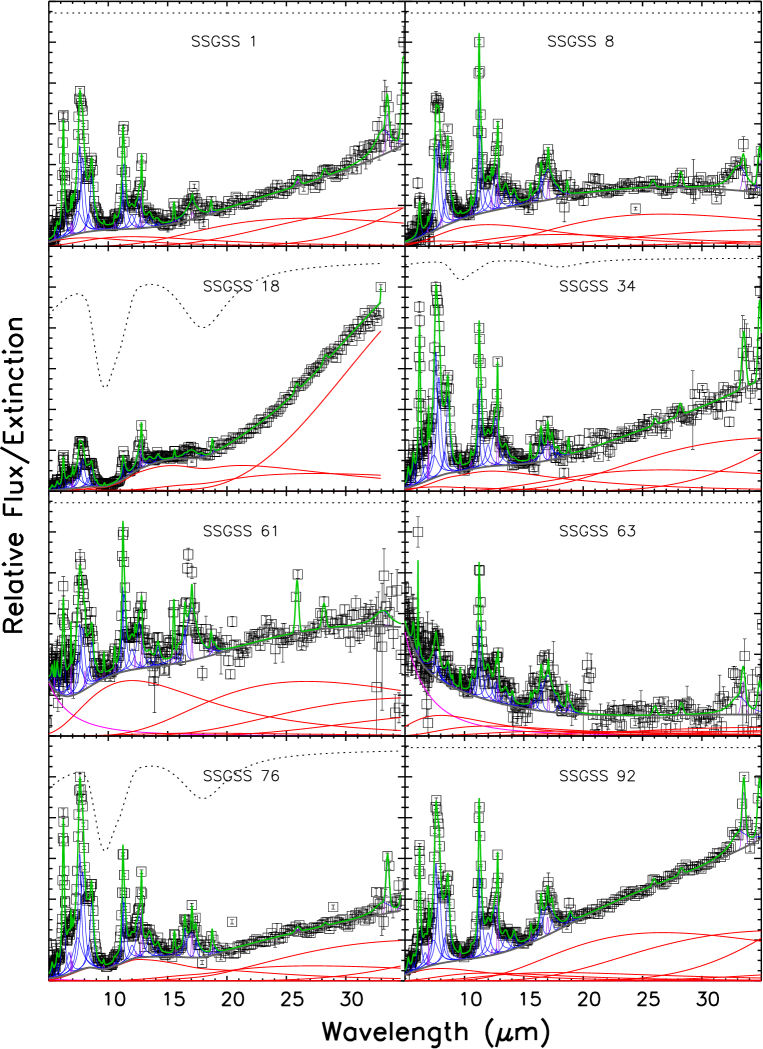
Figure 2 shows examples of PAHFIT decompositions of the SSGSS spectra.
| SSGSS | RA | DEC | z | ||||||||
|---|---|---|---|---|---|---|---|---|---|---|---|
| 1 | 160.34398 | 58.89201 | 0.066 | 1.35E-16 | 4.35E-16 | 8.89E-17 | 1.09E-16 | 4.72E-17 | 1.08E-17 | 1.17E-18 | … |
| 2 | 159.86748 | 58.79165 | 0.045 | 7.04E-17 | 2.14E-16 | 4.88E-17 | 5.43E-17 | 4.21E-17 | 3.51E-18 | 4.58E-18 | … |
| 11 | 162.41000 | 59.58426 | 0.047 | 4.56E-17 | 1.58E-16 | 3.32E-17 | 5.37E-17 | 3.40E-17 | 2.67E-18 | 2.02E-19 | … |
| 12 | 162.36443 | 59.54812 | 0.072 | 1.55E-16 | 6.61E-16 | 1.37E-16 | 1.99E-16 | 1.40E-16 | 3.41E-17 | 3.92E-18 | 1.47 |
| 14 | 162.52991 | 59.54828 | 0.153 | 8.67E-17 | 3.11E-16 | 6.74E-17 | 8.93E-17 | 4.97E-17 | 1.06E-17 | 1.93E-18 | … |
| 15 | 161.78737 | 59.63707 | 0.153 | 1.60E-17 | 5.81E-17 | 2.67E-17 | 3.88E-17 | 1.41E-17 | 8.37E-18 | … | … |
| 16 | 161.48123 | 59.15443 | 0.072 | 8.38E-17 | 3.10E-16 | 6.03E-17 | 8.49E-17 | 6.12E-17 | 1.35E-17 | 1.42E-18 | … |
| 17 | 161.59111 | 59.73368 | 0.047 | 5.68E-16 | 2.02E-09 | 4.11E-16 | 4.74E-16 | 2.81E-16 | 4.71E-17 | 1.11E-17 | 0.94 |
| 27 | 161.11412 | 59.74155 | 0.072 | 1.32E-16 | 1.19E-09 | 2.67E-16 | 3.29E-16 | 1.97E-16 | 6.58E-17 | 1.38E-17 | … |
| 28 | 161.71980 | 56.25187 | 0.103 | 1.98E-18 | 1.95E-16 | 4.68E-17 | 8.54E-17 | 2.67E-17 | 7.68E-18 | 4.23E-18 | … |
| 30 | 162.26756 | 56.22390 | 0.046 | 1.13E-16 | 4.02E-16 | 7.74E-17 | 1.00E-16 | 3.01E-17 | 5.10E-18 | 4.63E-18 | … |
| 32 | 163.00845 | 56.55043 | 0.117 | 7.61E-17 | 2.64E-16 | 5.72E-17 | 6.91E-17 | 1.75E-17 | 9.13E-18 | 4.76E-18 | … |
| 33 | 161.92709 | 56.31395 | 0.185 | 2.99E-17 | 1.61E-16 | 2.68E-17 | 5.48E-17 | 3.89E-17 | 7.02E-18 | 2.23E-18 | 0.66 |
| 34 | 161.75783 | 56.30670 | 0.046 | 9.03E-17 | 2.76E-16 | 6.15E-17 | 7.29E-17 | 3.47E-17 | 1.01E-17 | 3.14E-18 | 0.20 |
| 39 | 162.04231 | 56.38041 | 0.074 | 5.47E-17 | 1.97E-16 | 4.41E-17 | 5.54E-17 | 1.49E-17 | 8.42E-18 | 1.47E-18 | … |
| 45 | 161.76901 | 56.34029 | 0.113 | 2.41E-17 | 2.01E-16 | 4.64E-17 | 6.85E-17 | 3.07E-17 | 1.73E-17 | 1.02E-18 | … |
| 47 | 163.39658 | 56.74202 | 0.102 | 7.47E-17 | 2.48E-16 | 5.14E-17 | 6.64E-17 | 2.89E-17 | 1.46E-17 | 2.18E-18 | … |
| 48 | 163.44330 | 56.73859 | 0.200 | 7.44E-17 | 2.92E-16 | 5.86E-17 | 7.52E-17 | 1.88E-17 | 7.51E-18 | 1.98E-18 | … |
| 54 | 163.26968 | 56.55812 | 0.115 | 2.12E-16 | 7.50E-16 | 1.54E-16 | 1.96E-16 | 1.30E-16 | 1.41E-17 | 1.62E-18 | 0.82 |
| 61 | 163.19810 | 56.48840 | 0.073 | 3.14E-17 | 1.23E-16 | 2.00E-17 | 4.14E-17 | 4.56E-17 | 3.36E-17 | 3.98E-18 | … |
| 62 | 163.09050 | 56.50836 | 0.133 | 1.03E-16 | 3.82E-16 | 7.03E-17 | 9.18E-17 | 5.97E-17 | 2.15E-17 | … | … |
| 64 | 163.53931 | 56.82104 | 0.073 | 2.62E-16 | 9.32E-16 | 1.85E-16 | 2.04E-16 | 1.69E-16 | 4.45E-17 | 6.49E-18 | 1.14 |
| 65 | 158.22482 | 58.10917 | 0.118 | 1.82E-16 | 6.69E-16 | 1.26E-16 | 1.74E-16 | 1.00E-16 | 2.72E-17 | 4.82E-18 | 0.29 |
| 69 | 159.04880 | 57.72258 | 0.076 | 8.83E-17 | 2.46E-16 | 5.92E-17 | 7.23E-17 | 4.54E-17 | 1.38E-17 | 1.91E-18 | … |
| 70 | 159.34668 | 57.52069 | 0.090 | 4.72E-17 | 2.17E-16 | 4.75E-17 | 6.48E-17 | 2.57E-17 | 8.37E-18 | 2.46E-18 | … |
| 73 | 158.91122 | 57.59536 | 0.080 | 1.88E-17 | 9.81E-17 | 2.06E-17 | 2.47E-17 | 2.50E-17 | 7.12E-18 | … | … |
| 77 | 158.91344 | 57.71219 | 0.044 | 3.93E-17 | 1.62E-16 | 3.22E-17 | 3.56E-17 | 1.60E-17 | 1.12E-17 | 5.46E-18 | … |
| 83 | 159.73558 | 57.26361 | 0.119 | 3.13E-19 | 3.06E-16 | 6.76E-17 | 8.36E-17 | 4.79E-17 | 4.69E-18 | 3.78E-18 | … |
| 94 | 159.63510 | 57.40035 | 0.061 | 7.79E-17 | 2.77E-16 | 5.33E-17 | 6.52E-17 | 4.08E-17 | 1.44E-17 | 5.61E-19 | … |
| 95 | 161.48724 | 57.45520 | 0.115 | 7.48E-17 | 2.66E-16 | 5.84E-17 | 8.49E-17 | 2.52E-17 | 1.33E-17 | 1.04E-19 | 0.79 |
| 98 | 160.29099 | 56.93161 | 0.050 | 6.40E-17 | 7.98E-16 | 2.18E-16 | 2.64E-16 | 1.37E-16 | 1.81E-17 | 1.00E-17 | … |
| 99 | 160.30701 | 57.08246 | 0.077 | 1.62E-16 | 5.30E-16 | 1.11E-16 | 1.23E-16 | 8.50E-17 | 2.09E-17 | 1.41E-17 | … |
Integrated fluxes in W m-2 for PAH features and complexes and for and emission lines derived from PAHFIT spectral decomposition of the subsample of SSGSS galaxies with hi-res spectroscopy. Also reported are the redshift of the galaxy, z, and dust extinction given as , the optical depth at 9.7 µm. PAH strengths and absorption come from fitting of low-res data while emission lines come from fitting of hi-res data. Results for the full data set, including uncertainties for all values, is included in the electronic edition of the Astrophysical Journal.
2.2.1 Dust Extinction
Dust extinction can have a pronounced effect on PAH feature strengths due to the strong silicate absorption features at 10 and 18 µm. PAHFIT provides the option to fit a fixed extinction template as a free parameter. The standard template, which we utilize, models absorbing dust mixed with the emitting stars and grains, as opposed to an absorbing screen. Introducing this free parameter has the potential to lead to degenerate solutions and hence to large uncertainties in PAH feature strengths, and so we investigated the effect of inclusion/omission of extinction fitting on the fit results. We find that the strengths measured for the 6.2 µm and 7.7 µm PAH features are very similar whether or not dust extinction is included, with average deviations of less than 5% and no systematic bias. On the other hand, the 8.6 µm and 11.3 µm feature strengths appear to be systematically overestimated without the inclusion of silicate absorption by an average of 40% and 20% respectively.
Due to this systematic effect, the results that we present in this paper utilize PAHFIT fits including extinction fitting. 33% of galaxies provide better fits with some level of silicate absorption, with a median fitted extinction of . Having repeated all analyses excluding silicate absorption we find that our primary results are essentially unchanged. We make only minimal use of the strongly affected 8.6 µm feature.
2.2.2 Spline Fitting
A commonly used alternative method for measuring PAH strengths subtracts a fitted spline to represent the continuum and integrate the residuals within each PAH band. This method has the advantage of being independent of assumptions about the physical contributions to the fitted spectrum. However, having applied this method to all spectra, we find that it significantly underestimates PAH strengths because it misses the PAH features’ extended wings, and because the continuum is typically overestimated as the spline fitting points usually include substantial PAH flux. Worse, we find that PAH ratios are particularly sensitive to the systematic errors of this method as it depends strongly on the variable widths and level of blending of PAH features. As a result, we only report results based on the PAHFIT decompositions.
2.2.3 Problematic 6.2 µm Feature Fits
The lower sensitivity of the 2nd order of the IRS SL module results in low signal for a number of sources, and hence to problems in fitting the 6.2 µm feature in some cases. Although some 6.2 µm PAH flux is clearly present in almost all galaxies, PAHFIT failed to find a good fit to this feature in 18 cases. In many of these cases, the fit significantly underestimated the 6.2 µm flux, perhaps because of a small mismatch between the width or peak position of the feature and the fitted Drude profile.
It is possible to estimate PAH fluxes independently of PAHFIT, however for the analysis of PAH ratios we restrict ourselves to self-consistant PAH flux measurements using PAHFIT. Hence, we omit failed 6.2 µm fits from analyses that directly involve this feature. By BPT designation (see Sect. 2.2.4) these include 10 non-active galaxies, 3 composite sources, and 5 AGN.
As mentioned in Section 2.1, a calibration problem with the SL 2nd order resulted in aberrantly low fluxes in this order for a further subset of the galaxies. We identify 14 galaxies whose IRAC flux in the 5.7 µm band is significantly greater than the SL 2nd order flux integrated across this band. We omit these galaxies from analyses of the 6.2 µm feature. These include 10 non-active galaxies and 4 composite sources.
In total, 30 galaxies are omitted from analyses and plots involving the 6.2 µm feature. While this introduces unquantifiable biases, we still include such analyses where we feel that they remain informative. However the focus of this work is on the more robust PAH measurements - in particular th 7.7 µm and 11.3 µm features.
2.2.4 The Relative Dominance of Star-Formation and AGN
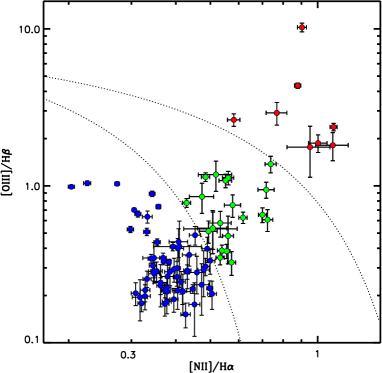
Throughout this paper we colour-code to indicate location in log vs. log space: the so-called BPT diagram of Baldwin et al. (1981) (Fig. 3). Red points indicate more powerful AGN satisfying the Kewley et al. (2001) designation, green points indicate composite sources with weaker active components between the Kewley and the Kauffmann et al. (2003) designation, while black points indicate galaxies dominated by stellar light, below the Kauffmann designation.
BPT designation must be interpreted carefully. Rather than an absolute discriminator between star-forming galaxies, composite sources, and AGN, for this study we instead interpret it as a measure of the relative dominance of star-formation and AGN with the Sloan aperture. The similarity of the Sloan and Spitzer SL apertures means that BPT designation measures this relative dominance within roughly the same galactic region responsible for the observed PAH emission. The regions probed in this study are larger than those probed in earlier, local studies. This is an important difference as it means that we observe a more global stellar population, where any AGN component is less overwhelming.
2.2.5 Correlation of PAH Ratios and Comparison to Other Studies
Ratios of the integrated fluxes of the fitted Drude profiles were used to determine PAH luminosity ratios, designated , where is the central wavelength of the feature in micrometers. Figure 4 shows the tight correlations between different short-to-long wavelength PAH ratios. versus follows a tight locus with 0.25 dex scatter. versus shows a similar scatter, but broadens towards low ratio values. The tight correlations suggest that lower-wavelength PAH features are strongly coupled, and are less-strongly tied to the 11.3 µm feature.
In this figure, we also compare our results to two other spectroscopic studies of PAH intensities:
S07 present spectral decomposition of IRS observations of 59 SINGS galaxies, and we use an identical spectral decomposition technique (see Sect. 2.2). An important difference between S07 and our survey is, with their local targets and shorter exposure times, they are dominated by the highest surface brightness regions near the nucleus, while our observations sample more of the extended structure. Their reported PAH ratios are very similar to ours, with the exception that the S07 sample have, on average, higher , and lack the small number of galaxies with that we observe.
Galliano et al. (2008) (G08) present spectral decomposition of ISO and Spitzer IRS observations of Galactic HII regions and dwarf spiral and starburst galaxies. We take the results of their most comparable decomposition technique, in which fit they Lorenzian profiles to the PAH bands (as opposed to the Drude profiles used by PAHFIT). While their sample show very similar trends in the 7.7 µm and 8.6 µm features versus the 11.3 µm feature, they find that the 6.2 µm feature is on average stronger by a factor of 1.3 to 2 than both our results and those of S07. This discrepancy is likely due to the differences in the fitting techniques.
3 RESULTS AND DISCUSSION
3.1 PAH Ratios as Measures of Grain Size and Ionization
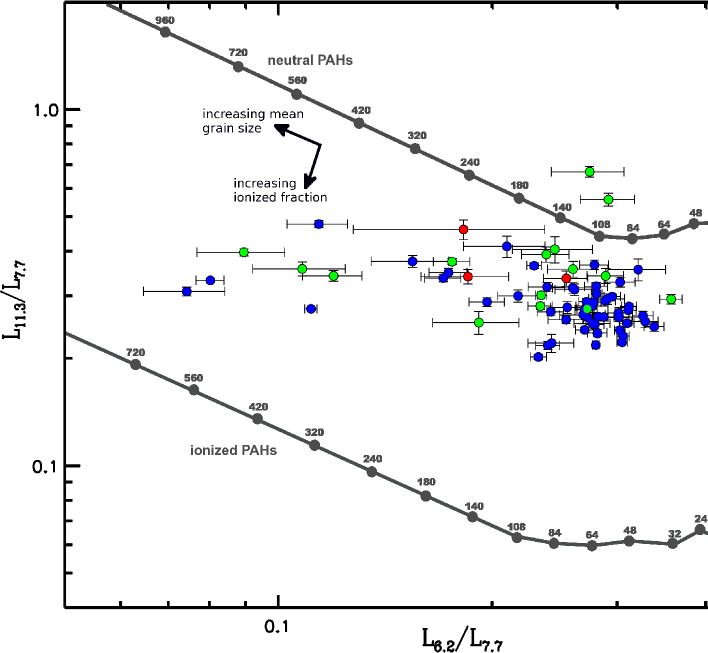
Models of the stochastic heating of dust grains (Tielens, 2005; Draine & Li, 2007; Schutte et al., 1993) show that the relative power emitted in a given PAH band is strongly dependent on the distribution of grain sizes. In general, smaller dust grains emit more power in the shorter wavelength bands and larger grains dominate longer wavelengths bands. In the regime of grain sizes expected in interstellar dust (10’s to 100’s of carbon atoms), rapid drops are expected in the 6.2 µm and m bands relative to longer-wavelength features, and in 6.2 µm relative to 7.7 µm, with increasing grain size.
It is also expected that the ionization state of a PAH molecule will have a dramatic effect on its spectrum (Draine & Li, 2007). In particular, carbon-carbon vibrational modes are known to be significantly more intense in ionized PAH molecules (Tielens, 2005). As the 6.2 µm and m bands result from radiative relaxation of CC stretching modes, the ratios of these bands to those arising from carbon-hydrogen modes such as the 11.3 µm feature are expected to drop by an order of magnitude between completely neutral and completely ionized PAH clouds. At the same time, the 6.2 µm feature should change little relative to the m feature as the ionization fraction changes.
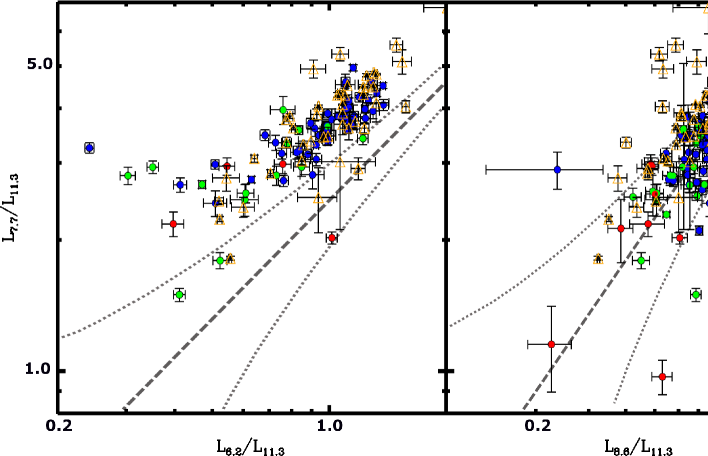
Comparison of the PAH band power ratios to is useful in extricating these two effects, with the former being sensitive to PAH grain size but relatively unaffected by ionization as both bands result from the similar CC modes, while the latter is very sensitive to ionization, and somewhat less so to grain size. Figure 5 shows these ratios for our sample plotted over the Draine & Li (2007) models. Most of the sample is restricted to a tight locus between 0.2 and 0.4 in both and , although within this locus there is a weak trend in the direction expected for constant ionization fraction with changing grain size, albeit with significant scatter. We discuss the distribution of active galaxies in this plot in Section 3.3
3.2 Comparison of PAH Ratios with Optical Diagnostics
We compare the PAH spectra resulting from our PAHFIT models to SDSS optical diagnostics of star formation history and AGN activity. Figure 6 shows the ratio of short-to-long wavelength PAH bands (, , and ) versus the star formation diagnostics , Specific Star Formation Rate (SSFR), and H Equivalent Width (H EW). (Kauffmann et al., 2003) measures the 4000Å break over a narrower bandpass than the standard (Bruzual et al., 1983), and provides a measure of the luminosity-weighted stellar age. SSFR (Brinchmann et al., 2004) is the star formation rate as determined by population synthesis models per unit stellar mass. The H line provides a direct measure of recent star formation, and in particular the presence of short-lived OB stars.
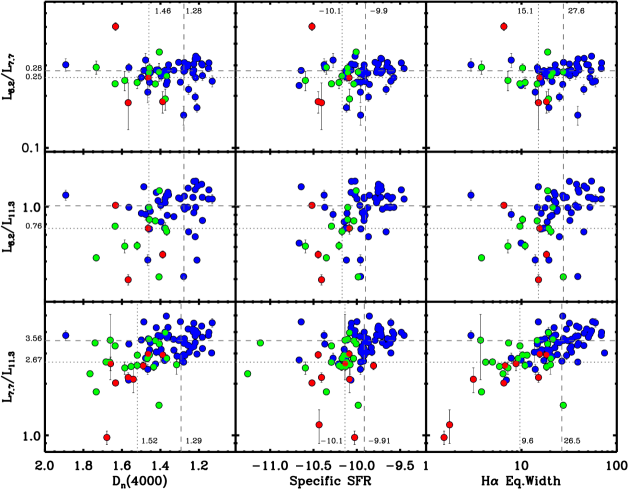
These star formation diagnostics are relatively free of the effects of dust extinction; and H EW because of the narrow bandpasses over which these diagnostics are calculated, and SSFR because it has been corrected for extinction (Brinchmann et al., 2004).
The most striking correlations are seen relative to , with the short wavelength PAH band becoming more dominant with increasing recent star formation. The ratios of the 6.2 µm feature to longer wavelength features follow similar, albeit weaker trends to .
Table 2 shows the results of the regression analyses of PAH ratios to optical properties. We use Kendall’s correlation to determine the significance of the trends, given as probabilities of obtaining the observed data given the null hypothesis of no correlation. We obtain a significance of 5% for and versus all star formation diagnostics, while shows no significant correlations.
provides a measure of the ionization parameter weighted by SFR, and hence of the hardness of the radiation field present in the galaxy (Kewley et al., 2001). From Figure 7 (left) it can be seen that there is a global trend between this line ratio and , and no strong trends with ratios involving the 6.2 µm feature.
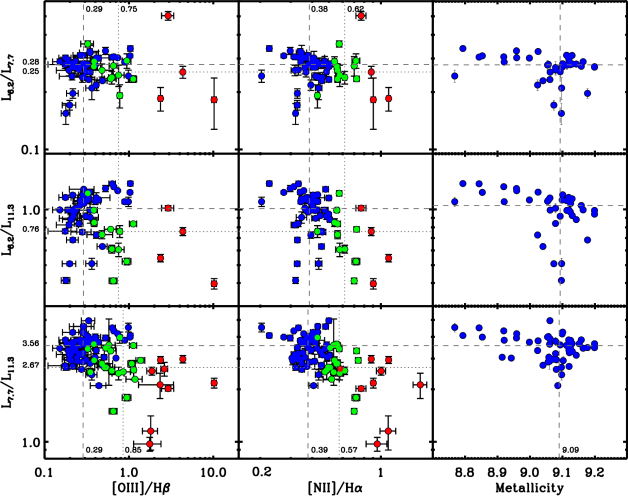
The emission line ratio provides a diagnostic of gas-phase metallicity, although it is also affected by radiation field hardness. This ratio strongly correlates with the age of the stellar population. As expected, follows the trends observed with star formation diagnostics (Fig. 7, middle). The best global correlation is again with , with the ratios of short-to-long wavelength PAH bands decreasing with increasing emission line ratio.
Table 2 also shows the results of the correlation analysis for PAH ratios versus emission line ratios.
A more reliable measure of gas-phase metallicity, derived from a range SDSS optical nebular lines (Tremonti et al., 2004) is available for a subset of the sample, although contain no BPT-designated AGN or composite sources (Fig. 7, right). The correlations of PAH ratios with this metallicity measure are slightly weaker than that for , suggesting that the trends observed in may be dominated by the trend with radiation hardness. However there is a notable locus of high short-to-long wavelength PAH ratios for lower metallicities. Galaxies in these upper left loci have the lowest metallicities () and are among the youngest in the sample (), and exhibit the hardest radiation fields of the star-forming galaxies ().
It is known that PAH emission around 8 µm is stronger in higher metallicity galaxies (Engelbracht et al., 2005). The dominance of short wavelength PAH features in the lowest metallicity galaxies as seen in Figure 7 (right) may result from a difficulty in building large PAH molecules in an under-rich medium. It may also result from other age-dependent effects given the close link between metallicity and age. However it is not expected to arise through the link between metallicity and radiation field hardness; a hard radiation field will either preferentially destroy small PAH molecules, decreasing this ratio, or ionize molecules, which should not produce the observed change in with metallicity, as seen in Section 3.1.
| Diagnostic | Sample | |||
|---|---|---|---|---|
| full sample | … | -0.07 (1.6%) | -0.26 (0.01%) | |
| star-forming | … | … | -0.39 (3%) | |
| AGN/composite | … | … | … | |
| full sample | … | 0.2 (0.17%) | 0.21 (0.01%) | |
| SSFR | star-forming | … | … | 0.13 (0.2%) |
| AGN/composite | … | … | … | |
| full sample | … | 0.16 (0.01%) | 0.19 (0.01%) | |
| H EW | star-forming | … | 0.1 (0.5%) | 0.16 (0.01%) |
| AGN/composite | … | … | 0.19 (2%) | |
| full sample | … | -0.5 (0.1%) | -0.53 (0.01%) | |
| star-forming | … | … | … | |
| AGN/composite | … | … | … | |
| full sample | … | … | -0.20 (1.2%) | |
| star-forming | … | … | -0.07 (4%) | |
| AGN/composite | … | … | -0.25 (5%) |
3.3 Separating the Effects of AGN Activity and Star Formation
From Figures 6 and 7 it can be seen that galaxies with dominant AGN components (those above the Kauffmann divide on the BPT diagram) have, on average, weaker short-to-long wavelength PAH bands. There is a strong link between AGN incidence and the star formation history of a galaxy; most notably, AGN are not apparent in the most strongly star-forming galaxies, because of swamping of diagnostic lines, dust obscuration, or for reasons related to the life-cycle of the AGN. The link between age and BPT designation is apparent from Figure 6. This makes it difficult to determine whether AGN activity, star formation history, or a combination of the two are responsible for the trends observed between PAH ratios and optical properties.
3.3.1 The Effect of Star Formation
We repeat the regression analysis and linear fits from Section 3.2 independently for subsamples of star-forming galaxies and AGN/composite sources. For both subsamples, the correlations with still hold for H EW. However, for and SSFR the correlation remains significant at better than the 5% level only for the star-forming subsample. For the correlation only holds for the star formation-dominated subsample with respect to H EW.
In general, it appears that star formation history does have an influence on ratio of the -to-11.3 µm PAH features, independent of an AGN component. Table 2 includes the regression analysis for the split samples.
3.3.2 The Effect of AGN
The split-sample regression analysis for vs. reveals that the correlation still holds for the AGN+composite subsample with a similar slope to the full sample. While there is a formal correlation for the star-forming subsample, the best-fit slope is so shallow as to suggest that the correlation is not meaningful. This suggests that there is a correlation between the hardness of the radiation field originating from an AGN and the 7.7 µm-to-11.3 µm ratio.
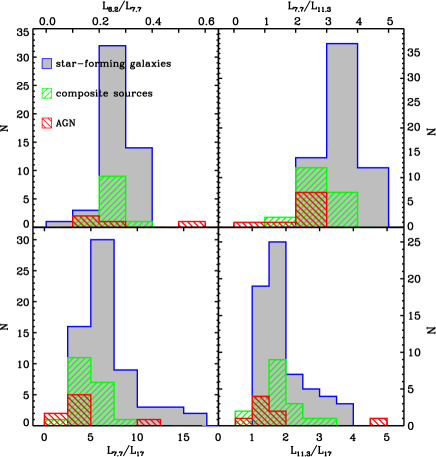
In Figure 8 (left) we show our sample on the BPT diagram, colour-coded as in Figure 3. For better visual clarity, symbol size is proportional to the ratio of long-to-short wavelength PAH band luminosity (upper: , lower: ), and hence to average grain size and/or neutral PAH fraction. The histograms (Fig. 8, right) show the distribution of PAH ratios for the different BPT designations. The strongest trend is found for , for which the active galaxies show significantly lower values than star-forming galaxies (with 0.1% significance by a KS test). More dominant AGN satisfying the Kewley designation have only marginally lower than composite sources satisfying the Kauffmann designation (10% significance). For , the differences in the subsamples are not highly significant; there is a 10% significance for the difference in this ratio between active and star-forming galaxies.
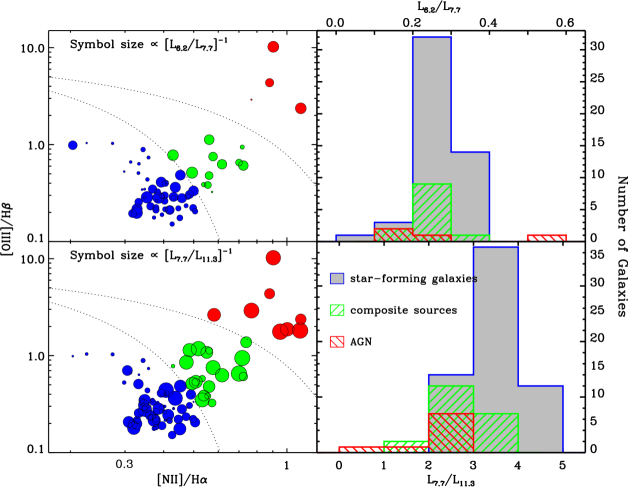
Although there is only a tentative difference in the distributions between the BPT-designated full AGN and composite sources, these galaxies have indistinguishable distributions of and H EW by a KS test. Thus, any difference in PAH ratios is likely due to AGN dominance and not to a link between AGN and star formation properties.
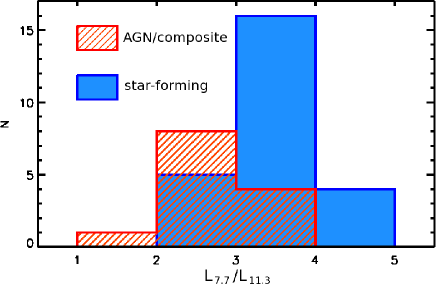
To better establish the independence of this relationship to star formation we analyse a controlled subsample restricted to a narrow age range, with . Figure 9 shows the histogram of for galaxies in this range, split between galaxies with dominant AGN activity (either composite or full AGN by BPT designation), versus galaxies with dominated by star formation. In this range, both subsamples have indistinguishable distributions of both and H EW. A KS test of these PAH ratios shows that they are different, with a significance level of 2%. It is therefore likely that AGN play some role in reducing the relative 7.7 µm-to-11.3 µm PAH emission, and that the trend is not solely due to the link between AGN status and the age of the stellar population.
3.4 The Effect of Age, Metallicity and Hard Radiation Fields on PAH Molecules
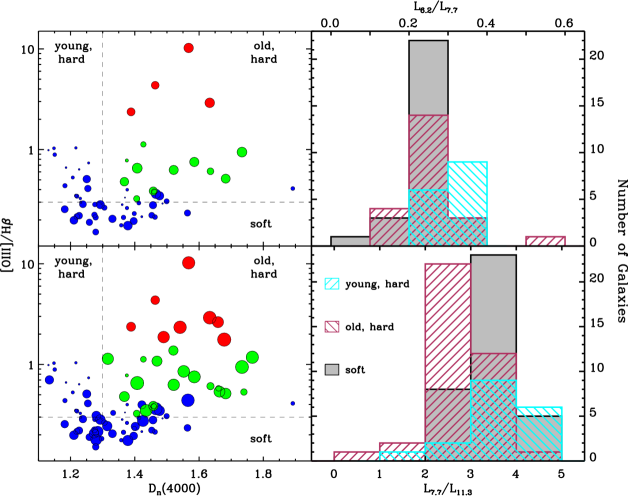
In order to better separate the role of AGN and star formation, we look at the relationship between hardness of the radiation field as measured by with stellar population age as measured by (Fig. 10). As a sensitive age diagnostic, is highly correlated with [NII])/H, and so this plot is analogous to the BPT plot, but with a clearer separation between young and older stellar populations. In this plot symbol size is again proportional to long-to-short wavelength PAH ratio for the purpose of visual clarity. Here we see that, for hard radiation fields as measured by , there is a striking difference in PAH ratio between younger and older stellar populations. Younger stellar populations () with hard radiation fields ([OIII]/H) have stronger short wavelength PAH bands than older galaxies with similar (significance: 0.05% for , 3% for ); they also have stronger short wavelength bands than galaxies of all ages with softer radiation fields ([OIII]/H, significance: 2% for , 1% for ). Older populations with hard ionizing fields (which are also predominantly AGN-dominated) have stronger long wavelength bands than the other populations (significance: 0.01% for , 8% for ). The differences are illustrated in the histograms to the right of Figure 10.
Thus, it seems that the behaviour of PAH molecules in the presence of a hard radiation field differs depending on the age of the stellar population, and so it may depend on whether the radiation comes predominately from starburst activity or an AGN. These trends may also arise from a link between metallicity and both radiation field hardness and stellar population. Below, we discuss the factors that drive the evolution of short-to-long wavelength PAH ratios:
The youngest galaxies begin their evolution with low , low metallicity, a moderately hard radiation field resulting from starburst activity, and high short-to-long wavelength PAH ratios. The increase in metallicity with age is expected toallow the larger grains that dominate the longer wavelength feature in each ratio to be assembled more efficiently, resulting in a drop in this ratio as seen in Section 3.2.
Additionally, as age increases the starburst radiation field also softens. This may result in a decrease in the ionization fraction of the PAH molecules, which, according to the Draine & Li (2007) models (Fig. 5), may contribute to the drop in 7.7 µm-to-11.3 µm ratio between the youngest galaxies in this sample and older galaxies.
Even after these youngest, starburst stages, aging galaxies continue to exhibit a decrease in short-to-long wavelength PAH ratios, and in particular in (see Fig. 6). Some of these galaxies experience AGN activity, and so are subject to radiation fields that are often much harder than in starburst galaxies. If the initial decrease in PAH ratio with age is due to increasing neutral fraction of PAH molecules, then AGN do not seem to reionize these molecules; indeed, the trend of diminishing PAH ratio with galaxy age continues through an increasing incidence of AGN.
In Section 3.3.2 we saw that AGN seem to cause a decrease in PAH ratio, particularly , independently of star formation diagnostics, and that also drops with AGN-sourced radiation hardness (Fig. 7, lower left). This may be due to preferential destruction of small PAH grains by X-rays and/or shocks from the AGN. It may also be due to heating of PAH molecules by the AGN, as ionization fraction decreases with increasing gas temperature (Tielens, 2005). Thus, if the AGN is capable of heating PAH to high temperatures in dense regions, compared to the more diffuse heating by stars, then the net effect may be to reduce the ionization fraction.
3.4.1 [NeII] and [NeIII] Measurements
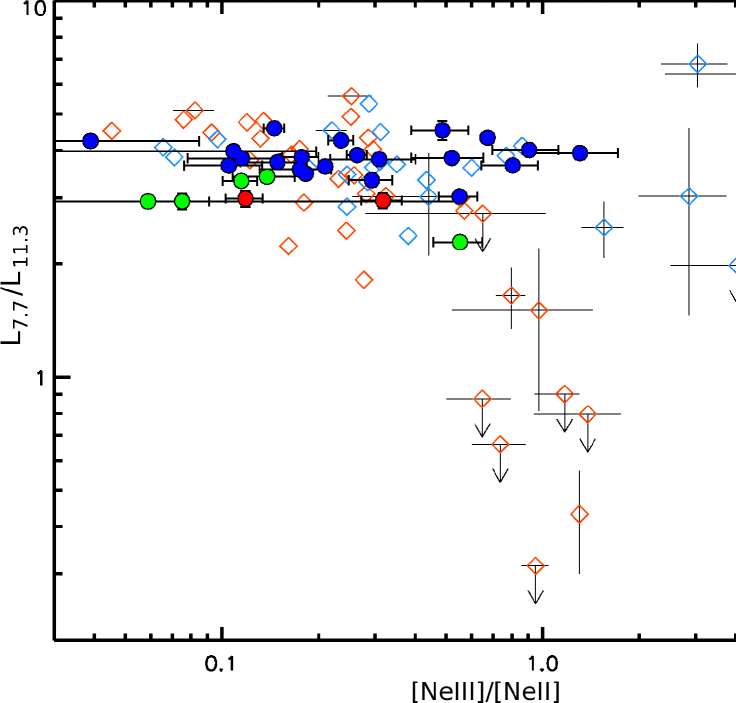
This differing effect of an AGN- or starburst-sourced hard radiation field on the PAH spectrum is consistent with the result of S07, who plot versus for their sample. provides a NIR measure of the hardness of the radiation field. For a subsample of galaxies with significant AGN components (Seyferts and LINERs), they find a strong anti-correlation between the two ratios: the harder the ionizing field in the AGN, the weaker the short wavelength PAH band. However the hardness of the radiation field in star-forming galaxies — radiation that is primarily stellar in origin — shows no correlation with PAH ratio. Brandl et al. (2006) find a similar absense of correlation for 22 starburst nuclei over a similarly broad range of .
We have measured for the subsample of 32 galaxies with
the IRS hi-res spectrograph. In Figure 11 we compare our
results with S07.
Our results are consistent, however the SSGSS sample does not include
values as high as those found by S07, and so we don’t see the full
trend between these ratios. The likely reason for the difference in
measured is that for the local galaxies studied by
S07, the IRS slit samples a smaller, more central, and hence more
AGN-dominated region than for our more distant galaxies.
3.5 The 17 µm Feature
The 17 µm PAH band is well separated from the denser blueward bands, and hence provides one of the cleanest measures of PAH strength. This band may arise from C-C-C bending (Draine & Li, 2007), however the true vibrational mode or modes responsible for this emission are not established. Nonetheless, it is expected that the dominant contributing grain size will be larger than for lower wavelength bands. This band falls in the long-low IRS module, which has a significantly larger slit width than both the short-low module and the SDSS aperture, at 105 vs. 37 and 3″ respectively. As a result, the sampling of different regions of the galaxy introduces unquantifiable uncertainties, and so we limit the analysis of this feature to qualitative comparisons.
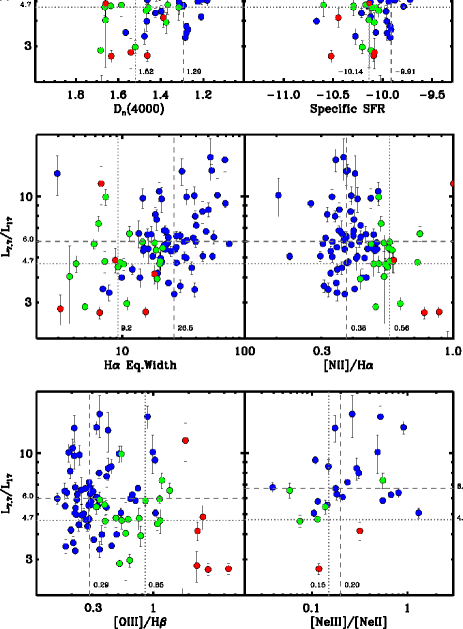
In Figure 12 we plot the ratio of the 7.7 µm bands to the 17 µm band versus SDSS optical properties. With respect to most optical diagnostics, displays similar correlations to , with similar dispersions. This ratio shows a significantly better correlation with respect to SSFR, and a worse correlation with respect to . As with , no correlation is observed with respect to . Dividing the sample between BPT-designated AGN/composite sources and star-forming galaxies, the same correlations are observed with all star formation diagnostics for star-forming galaxies. The correlations are not significant for other diagnostics or for the subsample of galaxies with AGN components.
In Figure 13 we compare the histograms of the PAH ratios , , , and divided into subsamples of varying of AGN activity. As was seen in Figure 8, reveals a slight relative increase in the strength of the longer-wavelength PAH feature for galaxies with an AGN component while shows a much stronger increase. There is also a significant increase in the strength of the 17 µm feature relative to the 7.7 µm feature with increasing AGN incidence and power. There is an increase in the 17 µm feature relative to the 11.3 µm feature between star-forming galaxies and full AGN, but not between star-forming galaxies and composite sources.
This may indicate a threshold in AGN power needed to destroy the larger PAH grains that dominate the 11.3 µm feature; only full AGN are capable of destroying such grains with enough efficiency to register a difference in the ratio. Conversely, the average molecule sizes that dominate both the 6.2 and 7.7 µm features are destroyed with similar efficiency even for composite sources, resulting in little change in with AGN status.
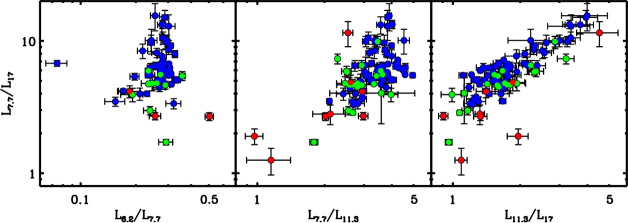
In Figure 14 we study the 17 µm feature in comparison to shorter wavelength features. vs. shows a very narrow range of the former ratio over an order of magnitude variation in the latter. correlates well with . Interestingly, an even tighter correlation is observed between and , suggesting that the 7.7 µm and 11.3 µm features are more closely tied than the 11.3 µm and 17 µm features.
4 CONCLUSIONS
We have studied the relationships between a range of optical diagnostics and the relative strengths of PAH emission bands for the SSGSS sample of 92 GALEX-selected normal, star-forming galaxies observed with the IRS lo-res and hi-res spectrographs. The observed PAH spectra are consistent with SINGS galaxies studied by Smith et al. (2007) and largely consistent with the galactic HII regions and galaxies studied by Galliano et al. (2008), although in the case of the latter, the different analysis methods appears to yield a 20-50% difference in the strength of the 6.2 µm feature.
Short-to-long wavelength PAH feature ratios exhibit a number of trends with the SDSS optical diagnostics of the galaxies’ star formation histories, metallicities, and radiation fields. The most striking of these is the correlation of the 7.7 µm-to-11.3 µm feature ratio with the star formation diagnostics H EW and , and with the emission line ratios and , and with metallicity. The correlation of this PAH ratio with star formation diagnostics is independent of the presence of an AGN component, indicating that the stellar population plays an important role in determining the relative feature strengths. This is consistent with an increase in production of large-grain PAH molecules with increasing metallicity, and with a correlation between the fraction of PAH molecules that are ionized and the hardness of any starburst radiation field.
The presence of an AGN component, as determined by the galaxy’s location on the BPT diagram, is correlated with a reduction in the ratio of the 7.7 µm to 11.3 and 17 µm features. For a subsample with matched and H EW, galaxies with any AGN component (AGN or composite sources) have weaker relative 7.7 µm emission than quiescent galaxies. This is consistent with a picture in which smaller PAH grains are preferentially destroyed by shocks and/or x-rays from the AGN.
References
- Allamandola et al. (1989) Allamandola, L. J., Tielen, A. G. G. M., & Barker, J. R., 1989, ApJS, 71, 733
- Baldwin et al. (1981) Baldwin J., Phillips M., & Terlevich R., 1981, PASP, 93, 5
- Brandl et al. (2006) Brandl, B. R., Bernard-Salas, J., Spoon, H. W. W., et al., 2006, ApJ, 653, 1129
- Brinchmann et al. (2004) Brinchmann, J., Charlot, S.; White, S. D. M.; Tremonti, C.; Kauffmann, G.; Heckman, T.; Brinkmann, J., 2004, MNRAS, 351, 1151
- Bruzual et al. (1983) Bruzual, A. G., 1983, ApJ, 273, 105
- Draine & Li (2007) Draine, B. T. & Li, A., 2007, ApJ, 551, 807
- Draine & Li (2007) Draine, B. T. & Li, A., 2007, ApJ, 657, 810
- Engelbracht et al. (2005) Engelbracht, C. W., Gordon, K. D., Rieke, G. H., Werner, M. W. Dale, D. A. & Latter, W. B., ApJ, 628, L29
- Galliano et al. (2008) Galliano, F., Madden, S. C., Tielens, A. G. G. M., Peeters, E., & Jones, A. P. 2008 ApJ, 679, 310
- Helou et al. (2000) Helou, G., Lu, N. Y., Werner, M. W., Malhotra, S., & Silbermann, N., 2000, ApJ, 352, L21
- Kauffmann et al. (2003) Kauffmann, G., Heckman, T., White, S. D. M., et al., 2003, MNRAS, 341, 33
- Kauffmann et al. (2003) Kauffmann G., Heckman T., Tremonte C., et al., 2003, MNRAS, 346, 1055
- Kennicutt et al. (2003) Kennicutt, R. C., Jr., Armus, L., Bendo, G., et al. 2003, PASP, 115, 928
- Kewley et al. (2001) Kewley L., Dopita M., Sutherland R., Heisler C. & Trevena J., 2001, ApJ, 556, 121
- Kim et al. (2001) Kim, H.-S., Wagner, D. R., & Saykally, R. J., 2001, Phys. Rev. Lett., 86, 5691
- Léger et al. (1989) Léger, A., d’Hendecourt, L. & Défourneau, D., 1989, Å, 216, 148
- Oomens et al. (2003) Oomens, J., Tielens, A. G. G. M., Sartakov, B. G., von Helden, G., & Meijer, G., 2003, ApJ, 591, 968
- Peeters et al. (2004) Peeters, E., Allamandola, L. J., Hudgins, D. M., Hony, S., & Tielens, A. G. G. M., 2004, in Astrophysics of Dust ed. A. Witt, B. T. Draine, & C. C. Clayton, (San Franscisco: PASP), p. 141
- Schutte et al. (1993) Schutte, W. A., Tielens, A. G. G. M., & Allamandola, L. J., 1993, ApJ, 415, 397
- Smith et al. (2007) Smith J. D. T., Draine B. T., Dale D. A., et al. 2006, ApJ, 656, 770
- Tielens (2005) Tielens, A. G. G. M. 2005, The Physics and Chemistry of the Interstellar Medium, Cambridge University Press
- Tremonti et al. (2004) Tremonti, C, A., Heckman, T. M., Kauffmann, G., et al. ApJ, 613, 898