Electronic structure of the two-dimensional Heisenberg antiferromagnet VOCl: a multi-orbital Mott insulator
Abstract
We have studied the electronic structure of the two-dimensional Heisenberg antiferromagnet VOCl using photoemission spectroscopy and density functional theory including local Coulomb repulsion. From calculated exchange integrals and the observed energy dispersions we argue that the degree of one-dimensionality regarding both the magnetic and electronic properties is noticeably reduced compared to the isostructural compounds TiOCl and TiOBr. Also, our analysis provides conclusive justification to classify VOCl as a multi-orbital Mott insulator. In contrast to the titanium based compounds density functional theory here gives a better description of the electronic structure. However, a quantitative account of the low-energy features and detailed line shapes calls for further investigations including dynamical and spatial correlations.
pacs:
71.20.-b,71.27.+a,71.30.+h,79.60.-iI Introduction
Transition metal compounds are characterized by a plethora of many-body phenomena which emerge from a complex interplay of charge, spin, orbital, and lattice degrees of freedom. More recently, strong focus has been placed on the role of multi-orbital physics, which is governed by a competition between intra-atomic Hund’s rule exchange coupling and crystal field splitting in the shell.Liebsch (2003); Costi and Liebsch (2007); de’ Medici et al. (2009) The simplest possible case where multi-orbital effects may occur is in a configuration, as encountered, e.g., in trivalent vanadium compounds. A prominent example is V2O3, whose spin nature, whether being , as naively expected for a system and found spectroscopically,Park et al. (2000) or whether V-V pair dimerization leads to an effective behavior,Castellani et al. (1978) has been lengthly debated and recently settled as a system (for details, see Ref. Poteryaev et al., 2007).
Here we study another prototypical V3+ compound, namely VOCl. It belongs to the class of low-dimensional transition metal oxyhalides of the form MOX (M=Ti,V,Cr,Fe; X=Cl,Br,I). Amongst these, especially the systems TiOCl and TiOBr have seen considerable interest recently,Seidel et al. (2003); Lemmens et al. (2005); Hoinkis et al. (2005); Krimmel et al. (2006); Abel et al. (2007); Kuntscher et al. (2008); Zhang et al. (2008) as they also show dimerization leading to non-conventional spin-Peierls behavior. Like its Ti counterparts, VOCl has a layered crystal structure which provides a topologically frustrated lattice, thus being a good candidate for unusual ground states and phase transitions. Such tendencies are enhanced due to competing one- and two-dimensional interactions.Rückamp et al. (2005); Clancy et al. (2007); Mastrogiuseppe and Dobry (2009); Hoinkis et al. (2007); Aichhorn et al. (2008) Furthermore, it has been shown that TiOX can be electron-doped by alkali metal intercalation into the van der Waals gaps of the crystal structureSing et al. (2009) up to a nominal configuration. In some sense, the electronic structure of VOCl can be viewed as the limit of such a doping series and thus provides an interesting reference point.
Electronically, VOCl is found to be an insulator. Our photoemission spectroscopy (PES) data as well as the density functional theory (DFT) calculations confirm the importance of correlations in this system, and our analysis shows that the suppression of metallicity is driven by strong correlations. This implies that VOCl is a multi-orbital Mott-Hubbard system, in line with results from TiOCl, which displays multi-orbital physics upon electron doping.Sing et al. (2009); Zhang et al. (2009); Craco et al. (2006). On the other hand, the effects of dynamical and spatial fluctuations, which should be prominently observable in angle-resolved photoemission (ARPES), turn out to be less important than, e.g., in TiOCl, though not negligible.Saha-Dasgupta et al. (2005); Pisani et al. (2007)
This paper is structured as follows: in Sec. II we give an overview of the structural, thermodynamic, and magnetic properties of VOCl, in Sec. III both experimental and computational methods are described. Section IV contains our results and a comparative discussion of the electronic structure of VOCl at room temperature and above, determined using (AR)PES as well as DFT calculations within the generalized gradient approximation including local correlations at the mean field level (GGA+U). Finally, in Sec. V we summarize our results.
II Structural, thermodynamic, and magnetic properties
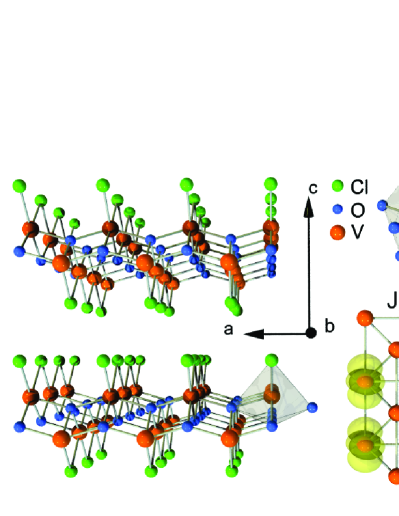
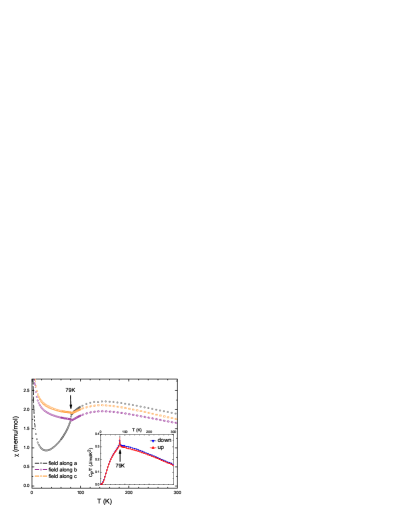
VOCl crystallizes in an orthorhombic structure of buckled V-O bilayers sandwiched by Cl layers as shown in Fig. 1 (space group ; lattice parameters Å, Å, Å).Schäfer and Wartenpfuhl (1961) These building blocks are only weakly coupled through van-der-Waals forces along the crystallographic direction. Each V ion lies in the center of a strongly distorted octahedron of two Cl and four O ions. Thus, the degeneracy within the low-lying triplet and the high-lying doublet is completely lifted, as is also the case for TiOCl.Hoinkis et al. (2005); Rückamp et al. (2005); Saha-Dasgupta et al. (2004) It will be shown below that the electrons occupy the lowest-lying orbitals of and character in the chosen reference frame (), which leads to a weaker electronic anisotropy within the plane compared to TiOCl. This enhanced two-dimensionality is also reflected in the magnetic susceptibility displayed in Fig. 2. While showing an isotropic behavior for the high-temperature phase, a sharp drop with the external field applied along the crystallographic axis is observed at around K, while along the and axis a slight upturn occurs. This behavior, in conjunction with the anomaly in the specific heat shown in the inset of Fig. 2, indicates a transition to an antiferromagnetically ordered phase, which has been described previously by a two-dimensional Heisenberg model on a square lattice with antiferromagnetic nearest-neighbor interaction.Wiedenmann et al. (1983) In this low-T Néel phase the crystal symmetry is reduced from orthorhombic to axis monoclinic.Komarek et al. (2009); Schönleber et al. (2009)
III Technical details
Single crystals were grown by chemical vapor transport.Schäfer et al. (1958); Hoinkis et al. (2005) Crystals of typical dimensions mm3 were selected for the PES measurements. The samples were characterized by x-ray diffraction and magnetic susceptibility measurements (see Fig. 2). For the (AR)PES experiments we used a Specs PHOIBOS 100 as well as an Omicron EA125 analyzer, monochromatized Al Kα radiation for x-ray photoemission spectroscopy (XPS; =1486.6 eV) and He Iα photons (=21.2 eV) from a gas discharge lamp for valence band spectroscopy (UPS, ARPES). The total energy resolution amounted to 700 meV and 70 meV for XPS and UPS, respectively. In ARPES, using the EA125, the angular resolution was about . Clean surfaces were obtained by in situ cleavage using Scotch tape. Their cleanliness and atomic long-range order were evidenced using XPS and low-energy electron diffraction (LEED), respectively. Pressure during measurements was in the low mbar regime. Due to the strongly insulating nature of VOCl all measurements have been performed at temperatures of 360 K or above in order to minimize charging effects via thermally activated conductivity.Hoinkis et al. (2005) It was found from systematic temperature variations that for K the maximum of the V peak saturates at 2.2 eV below the chemical potential as determined from the Fermi edge of a silver foil. All measured spectra have been aligned accordingly, and the calculated spectra have been shifted such that their first order moments correspond to those of the experimental ones.
The DFT calculations where performed with the Full Potential Linearized Augmented Plane Wave basis (FPLAPW) as implemented in the WIEN2k code Blaha et al. (2001). We considered a mesh of in the irreducible Brillouin zone and a RKmax=7. For the GGA+U calculations we considered the implementation of Dudarev et al. Dudarev et al. (1998) in WIEN2k where a unique parameter is needed as an input. This leaves a certain flexibility for the choices of and values provided their difference is . NMTO downfolding calculationsAndersen and Saha-Dasgupta (2000) were also performed in order to obtain the important hopping parameters among the V atoms.
IV Results and discussion
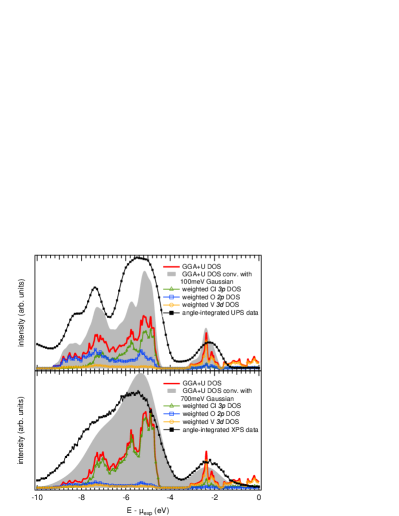
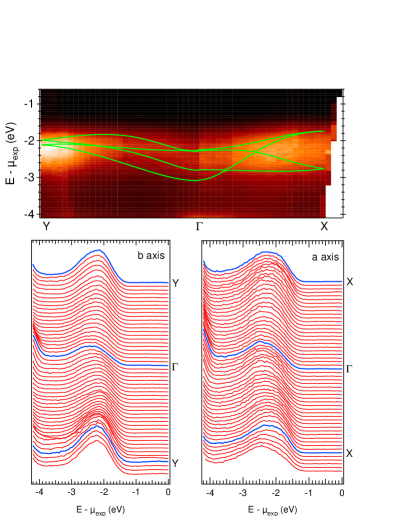
Figure 3 presents the angle-integrated UPS and XPS valence band spectra of VOCl together with the density of states (DOS), calculated for the room temperature structure within GGA+U for eV where is the onsite Coulomb energy and the exchange integral. Also shown are the partial DOS (pDOS) for Cl , O , and V which have been multiplied by calculated photo-ionization cross-sections Yeh and Lindau (1985) for UPS (upper panel) and XPS (lower panel) excitation energies, respectively. In order to mimic the experimental resolution we convoluted the sums of weighted pDOS (‘GGA+U DOS’, solid red curves) with Gaussian functions having a FWHM of meV and meV for UPS and XPS, respectively (grey-shaded areas in Fig. 3). The experimental UPS spectrum is representative of an integration in -space around the point with a radius of roughly of the Brillouin zone.
The basic feature observed experimentally, namely the separation of the spectra into a low-binding-energy part (ca. -2 to -4 eV) of mainly V character and a high-binding-energy part (ca. -5 to -9 eV) derived from O and Cl states is consistently reproduced in GGA+U.foo At least for the UPS valence spectrum, the latter can roughly be further subdivided into a peak of mostly Cl character for energies of approx. -4 to -6.5 eV and a structure of mixed O and Cl character below -6.5 eV. The changes of shape in the O/Cl bands for different excitation energies are nicely accounted for by the appropriate cross-sections. While the substructure of these bands is reproduced remarkably well, the agreement becomes less satisfactory regarding the shape of the V band. This observation will be discussed below in the context of ARPES data.
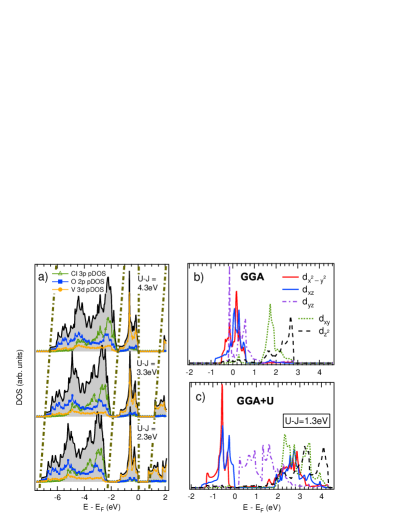
An important issue when comparing PES with GGA+U (or LDA+U) calculations is the choice of the parameters for the GGA+U functional. In our calculations we treated only the V orbitals with the terms. This implies that (i) the gap between the O/Cl bands and the V bands closer to the Fermi edge as well as (ii) the charge gap between occupied V states and unoccupied ones will depend on the value of . On the other hand, the widths of the different bands are unaffected and remain constant upon variation of . In Fig. 4(a) we show the GGA+U pDOS for three sets of values. For eV the observed PES separation between O/Cl and V occupied bands is reproduced by the calculations (see Fig. 3) although for this value the gap between the highest occupied and the lowest unoccupied states is underestimated compared to the gap observed in photoemission as well as to optical absorption experiments, which reported a charge gap of 2 eV.Vénien et al. (1979); Maule et al. (1988) For eV the charge gap is basically reproduced but the O/Cl - V gap is strongly underestimated. Since the latter is fundamentally determined by the hybridization pattern in VOCl, it has to be captured in the calculations. The parameter value eV is thus the most sensible choice for describing this system. This value is for instance compatible with eV and eV as possible onsite Coulomb and exchange parameters.
| VOCl | 0.025 | 0.33 | 1.63 | 1.93 |
| TiOCl | 0.241 | 0.46 | 1.54 | 2.08 |
The distorted nature of the VO4Cl2 octahedra is reflected in the crystal field splittings for the V orbital energies as shown in Tab. 1, where these energies relative to the lowest orbital energy are compared to those of TiOCl. The values were obtained by considering the first order moment in the DOS GGA results (see Fig. 4(b)). The onsite (i.e. charge neutral) orbital excitation energies from occupied to the different unoccupied orbitals found in optical absorption experiments are in good agreement with our calculated values.Vénien et al. (1979); Maule et al. (1988); Benckiser et al. (2008)
We observe that in VOCl the and states are almost degenerate unlike in TiOCl for both GGA and GGA+U. Comparing the two methods, it is important to note that an insulating state with a finite gap at the Fermi energy is obtained only when correlations are included. This shows that correlations are the driving force for the suppression of metallicity in VOCl and that the system is a (multi-band) Mott insulator. In the case of TiOCl only the orbital is occupied, defining a dominant one-dimensional hopping path along the direction.Saha-Dasgupta et al. (2004); Seidel et al. (2003) Nevertheless, from a quantitative comparison of electronic dispersions in TiOCl and TiOBr as well as from an analysis of all interaction paths, the importance of two-dimensional correlations for the electronic properties has been pointed out for these systems.Hoinkis et al. (2007); Zhang et al. (2008); Aichhorn et al. (2008)
From a closer inspection of Fig. 4(c) one sees that the total bandwidth of is larger than that of , suggesting that strong antiferromagnetic exchange coupling would be expected along mainly due to orbitals. As the latter have a zig-zag overlap along the axis (see Fig. 1) one can expect that VOCl is intrinsically less one-dimensional from the electronic structure point of view compared to TiOCl, which is in line with the observation of a two-dimensional magnetic structure as mentioned above.Wiedenmann et al. (1983); Komarek et al. (2009) This is verified by calculating energy differences within GGA+U among different magnetically ordered states and then mapping the results to a Heisenberg model. With this method we obtain the exchange integrals between nearest neighbor interacting V ions along (), along () and along the diagonal direction () (see Fig. 1). We performed the calculations for various values and find that is always larger than and both are antiferromagnetic (e.g. at eV and at eV ) while is smaller than and . However, the nature of the exchange depends on the choice of the value, e.g., at eV and at eV. This is probably due to the fact that ferro- and antiferromagnetic contributions are equally important for the exchange and with increasing the antiferromagnetic contribution is suppressed, while the ferromagnetic contribution is barely affected, and is then ferromagnetic. Nevertheless, the dominant exchanges and are always antiferromagnetic and their strengths remain comparable for various , indicating that VOCl should be a two-dimensional antiferromagnet at low temperatures without a preferred one-dimensional hopping path induced by largely different hopping matrix elements as in TiOCl. Indeed, the NMTO downfolding results identify the dominant hopping parameters to be of the same order of magnitude in ( eV) and ( eV) directions and a factor smaller in the direction. This qualitative trend in dominant hoppings agrees well with the estimation of the exchange parameters as given above.
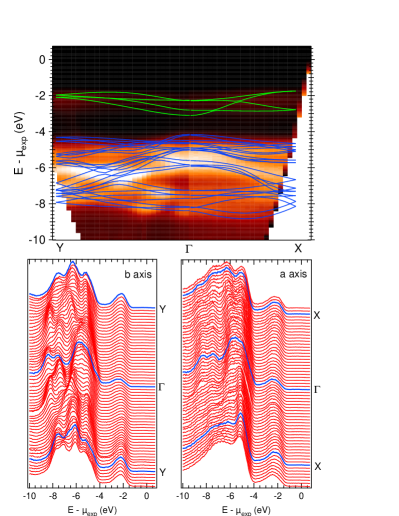
In order to elaborate some more on the dimensionality issue we compare ARPES data with band structures from GGA+U in Figs. 5 and 6. First, Fig. 5 shows intensity plots of the dispersions of the entire valence band in the Brillouin zone along X and Y corresponding to the crystallographic and axis, respectively, together with the respective energy distribution curves (EDCs). Also shown is the band structure calculated using GGA+U.
A large number of different bands and rich dispersive features which differ between the two directions are observed for the O/Cl bands in very good agreement between theory and experiment. This also indicates the good quality of our single crystals. In the low-binding-energy region, GGA+U shows a total of four V bands since there are two electrons per V site and two V sites per unit cell. In the ARPES data, however, the V weight appears as a rather broad and weakly dispersing hump without any sharp features, as can be seen in the blow-up shown in Fig. 6. This behavior was reproducibly observed on many different samples and is not due to, e.g., a limited experimental resolution. It is rather an intrinsic property which for several reasons cannot be expected to be fully captured in our calculations. From a strict many-body view the V bands do not have quasi-particle character, but must be interpreted as incoherent weight in the spirit of a Mott-Hubbard scenario. Thus, a description of the detailed line shapes within GGA+U, being an effective single-particle approach which does not account for dynamical and spatial fluctuations, is admittedly intricate. This issue has been extensively studied for the case of TiOCl, where dynamical mean field theory (DMFT) with a Quantum Monte Carlo (QMC) impurity solverSaha-Dasgupta et al. (2005) in order to take full account of dynamical correlations, as well as the extension to cluster- rather than single-site calculations,Saha-Dasgupta et al. (2007) have led to considerable improvement. Of course, due to the predominant one-dimensionality in TiOCl as well as its strong tendency to form singlets (evidenced by the unconventional spin-dimerized phases at intermediate and low temperaturesSeidel et al. (2003)) the influence of such fluctuations is expected to be stronger than in VOCl. Nevertheless, this issue calls for further investigation in the present case as well.
Despite these qualifying remarks, we shall give a more detailed analysis in order to compare to the computationally equally complex case of TiOCl. Compared to the latter, the differences of the ARPES dispersions of the V 3d weight between the a and b axis are less pronounced,Hoinkis et al. (2005) with the peak maximum appearing at highest binding energies at the point and shifting slightly to lower binding energies towards the zone boundary in both cases. A comparison shows that the trend towards lower binding energies as well as the evolution of the spectral weight distribution are qualitatively in line with the calculations: large weight is found along half way between and X, along right at the Y point, i.e., where bands cross in both cases. The shape of the peak, which can be seen in the lower panels of Fig. 6, reflects these trends as well: along it develops from a flat hump to a more distinct, symmetric peak towards the zone boundary, while along the slight asymmetry towards the high-binding-energy side at shifts towards the low-binding-energy side at X. The overall width at the X point appears to be larger than at the Y point, in line with the calculated result that the four GGA+U bands merge at Y while two pairs remain well separated at X. However, a detailed interpretation of this behavior needs further analysis which is beyond the scope of the present work, although we want to note that the observed asymmetric shape in VOCl is reminiscent of TiOCl where the asymmetry has been attributed to correlations.Hoinkis et al. (2005); Saha-Dasgupta et al. (2007)
Overall, the agreement between GGA+U and ARPES for VOCl is better than in the case of TiOCl. This is probably due to the fact that the influence of dynamical and/or spatial fluctuation effects in VOCl is smaller than in TiOCl.
V Conclusions
In conclusion, we have investigated the electronic structure of the low-dimensional system VOCl using photoemission spectroscopy and GGA+U band structure calculations. From a comparison to GGA calculations we could show that its insulating nature is due to strong correlations of the V valence electrons instead of band structure effects, which is the first conclusive evidence for the Mott character of the insulating state. The issue of choosing has been addressed concerning the correct description of the hybridization pattern in favor of a reasonable magnitude for the charge gap. Calculation of the exchange integrals shows that VOCl is two-dimensional both electronically and magnetically, and the obtained antiferromagnetic exchange within the plane is robust upon variation of and in line with experimental observations. Calculated band dispersions agree well with the ones observed via angle-resolved photoemission spectroscopy for the high-binding-energy uncorrelated bands, and qualitatively match the V derived weight. No considerable in-plane anisotropy within the VO bilayers is observed in ARPES, supporting the two-dimensional nature of the system. Overall, we could show that VOCl is a quasi-two-dimensional (as opposed to quasi-one-dimensional) system and can be well described as a two-band Mott-Hubbard insulator with ground state configuration.
Acknowledgements.
This work was supported through the Deutsche Forschungsgemeinschaft (DFG) under Grants CL-124/6-1 and SFB/TRR49 and SFB 484.References
- Liebsch (2003) A. Liebsch, Phys. Rev. Lett. 91, 226401 (2003).
- Costi and Liebsch (2007) T. A. Costi and A. Liebsch, Phys. Rev. Lett. 99, 236404 (2007).
- de’ Medici et al. (2009) L. de’ Medici, S. R. Hassan, M. Capone, and X. Dai, Phys. Rev. Lett. 102, 126401 (2009).
- Park et al. (2000) J.-H. Park, L. H. Tjeng, A. Tanaka, J. W. Allen, C. T. Chen, P. Metcalf, J. M. Honig, F. M. F. de Groot, and G. A. Sawatzky, Phys. Rev. B 61, 11506 (2000).
- Castellani et al. (1978) C. Castellani, C. R. Natoli, and J. Ranninger, Phys. Rev. B 18, 4945 (1978).
- Poteryaev et al. (2007) A. I. Poteryaev, J. M. Tomczak, S. Biermann, A. Georges, A. I. Lichtenstein, A. N. Rubtsov, T. Saha-Dasgupta, and O. K. Andersen, Phys. Rev. B 76, 085127 (2007).
- Seidel et al. (2003) A. Seidel, C. A. Marianetti, F. C. Chou, G. Ceder, and P. A. Lee, Phys. Rev. B 67, 020405(R) (2003).
- Lemmens et al. (2005) P. Lemmens, K. Y. Choi, R. Valentí, T. Saha-Dasgupta, E. Abel, Y. S. Lee, and F. C. Chou, New J. Phys. 7, 74 (2005).
- Hoinkis et al. (2005) M. Hoinkis, M. Sing, J. Schäfer, M. Klemm, S. Horn, H. Benthien, E. Jeckelmann, T. Saha-Dasgupta, L. Pisani, R. Valentí, et al., Phys. Rev. B 72, 125127 (2005).
- Krimmel et al. (2006) A. Krimmel, J. Strempfer, B. Bohnenbuck, B. Keimer, M. Hoinkis, M. Klemm, S. Horn, A. Loidl, M. Sing, R. Claessen, et al., Phys. Rev. B 73, 172413 (2006).
- Abel et al. (2007) E. T. Abel, K. Matan, F. C. Chou, E. D. Isaacs, D. E. Moncton, H. Sinn, A. Alatas, and Y. S. Lee, Phys. Rev. B 76, 214304 (2007).
- Kuntscher et al. (2008) C. A. Kuntscher, A. Pashkin, H. Hoffmann, S. Frank, M. Klemm, S. Horn, A. Schönleber, S. van Smaalen, M. Hanfland, S. Glawion, et al., Phys. Rev. B 78, 035106 (2008).
- Zhang et al. (2008) Y.-Z. Zhang, H. O. Jeschke, and R. Valentí, Phys. Rev. B 78, 205104 (2008).
- Rückamp et al. (2005) R. Rückamp, J. Baier, M. Kriener, M. Haverkort, T. Lorenz, G. Uhrig, L. Jongen, A. Möller, G. Meyer, and M. Grüninger, Phys. Rev. Lett. 95, 097203 (2005).
- Clancy et al. (2007) J. P. Clancy, B. D. Gaulin, K. C. Rule, J. P. Castellan, and F. C. Chou, Phys. Rev. B 75, 100401(R) (2007).
- Mastrogiuseppe and Dobry (2009) D. Mastrogiuseppe and A. Dobry, Phys. Rev. B 79, 134430 (2009).
- Hoinkis et al. (2007) M. Hoinkis, M. Sing, S. Glawion, L. Pisani, R. Valentí, S. van Smaalen, M. Klemm, S. Horn, and R. Claessen, Phys. Rev. B 75, 245124 (2007).
- Aichhorn et al. (2008) M. Aichhorn, T. Saha-Dasgupta, A. Lichtenstein, R. Valentí, S. Glawion, M. Sing, and R. Claessen, arXiv:0810.2433 (2008).
- Sing et al. (2009) M. Sing, S. Glawion, M. Schlachter, M. R. Scholz, K. Goss, J. Heidler, and R. Claessen, arXiv:0905.1381 (2009).
- Zhang et al. (2009) Y.-Z. Zhang, K. Foyevtsova, H. O. Jeschke, M. U. Schmidt, and R. Valentí, arXiv:0905.1276 (2009).
- Craco et al. (2006) L. Craco, M. S. Land, and E. Müller-Hartmann, J. Phys.: Condens. Matter 18, 10943 (2006).
- Saha-Dasgupta et al. (2005) T. Saha-Dasgupta, A. Lichtenstein, and R. Valentí, Phys. Rev. B 71, 153108 (2005).
- Pisani et al. (2007) L. Pisani, R. Valenti, B. Montanari, and N. Harrison, Phys. Rev. B 76, 235126 (2007).
- Schäfer and Wartenpfuhl (1961) H. Schäfer and F. Wartenpfuhl, J. Less Common Met. 3, 29 (1961).
- Saha-Dasgupta et al. (2004) T. Saha-Dasgupta, R. Valentí, H. Rosner, and C. Gros, Europhys. Lett. 67, 63 (2004).
- Wiedenmann et al. (1983) A. Wiedenmann, J. P. Vénien, P. Palvadeau, and J. Rossat-Mignod, J. Phys. C: Solid State Phys. 16, 5339 (1983).
- Komarek et al. (2009) A. C. Komarek, T. Taetz, M. T. Fernández-Díaz, D. M. Trots, A. Möller, and M. Braden, Phys. Rev. B 79, 104425 (2009).
- Schönleber et al. (2009) A. Schönleber, J. Angelkort, S. van Smaalen, L. Palatinus, A. Senyshyn, and W. Morgenroth, Physical Review B (Condensed Matter and Materials Physics) 80, 064426 (pages 7) (2009), URL http://link.aps.org/abstract/PRB/v80/e064426.
- Schäfer et al. (1958) H. Schäfer, F. Wartenpfuhl, and E. Weise, Z. Anorg. Allg. Chem. 295, 268 (1958).
- Blaha et al. (2001) P. Blaha, K. Schwarz, and J. Luitz (2001), computer code WIEN2k, Techn. Univ. Wien, Vienna, URL http://www.wien2k.at.
- Dudarev et al. (1998) S. L. Dudarev, G. A. Botton, S. Y. Savrasov, C. J. Humphreys, and A. P. Sutton, Phys. Rev. B 57, 1505 (1998).
- Andersen and Saha-Dasgupta (2000) O. K. Andersen and T. Saha-Dasgupta, Phys. Rev. B 62, R16219 (2000).
- Yeh and Lindau (1985) J. J. Yeh and I. Lindau, Atomic Data and Nuclear Data Tables 32, 1 (1985).
- (34) Note that we define binding energies as positive numbers, while in the figures and in the text energies are given relative to the chemical potential. Thus, occupied states have negative energies. Nevertheless, we call e.g. the occupied V feature the low-binding-energy part, referring to the magnitude of the binding energy.
- Vénien et al. (1979) J. P. Vénien, P. Palvadeau, D. Schleich, and J. Rouxel, Mater. Res. Bull. 14, 891 (1979).
- Maule et al. (1988) C. H. Maule, J. N. Tothill, P. Strange, and J. A. Wilson, J. Phys. C: Solid State Phys. 21, 2153 (1988).
- Benckiser et al. (2008) E. Benckiser, R. Rückamp, T. Möller, T. Taetz, A. Möller, A. A. Nugroho, T. T. M. Palstra, G. S. Uhrig, and M. Grüninger, New J. Phys. 10, 053027 (2008).
- Saha-Dasgupta et al. (2007) T. Saha-Dasgupta, A. Lichtenstein, M. Hoinkis, S. Glawion, M. Sing, R. Claessen, and R. Valentí, New J. Phys. 9, 380 (2007).