K+a galaxies in the zCOSMOS Survey: ††thanks: Based on data obtained with the European Southern Observatory Very Large Telescope, Paranal, Chile, program 175.A-0839.
Abstract
Aims. The identities of the main processes triggering and quenching star-formation in galaxies remain unclear. A key stage in evolution, however, appears to be represented by post-starburst galaxies. To investigate the prevalence of these galaxies and their impact on galaxy evolution in general, we initiated a multiwavelength study of galaxies with spectral features in the well-studied COSMOS field.
Methods. We examine a mass-selected sample of galaxies in the COSMOS field at using the spectroscopic zCOSMOS sample. To classify galaxies in their phase, we use a spectroscopic criterion, based on the amplitude of the H absorption line and the absence of the [OII] emission line. We develop our analysis for a well-defined sample by imposing stringent confidence levels on the spectroscopic redshifts and spectral measurements. We compare our results for two mass-selected samples of star-forming and quiescent galaxies selected using a purely spectral classification scheme from the 10,000 zCOSMOS catalogue (i.e. , based on measurements of 4000 Å break and EW[OII]).
Results. In our mass-limited sample, galaxies occupy the brightest tail of the luminosity distribution. They are as massive as quiescent galaxies and populate the green valley in the colour versus luminosity (or stellar mass) distribution. A small percentage (%) of these galaxies have radio and/or X-ray counterparts (implying an upper limit to the SFR of yr-1). Over the entire redshift range explored, the class of post-starburst galaxies is morphologically a heterogeneous population with a similar incidence of bulge-dominated and disky galaxies. This distribution does not vary with the strength of the H absorption line but instead with stellar mass in a way reminiscent of the well-known mass-morphology relation. The results about the incidence of asymmetries and the concentration of the light distribution derived from HST/ACS images imply that this galaxy population possibly represents an intermediate stage of galaxy evolution. Although galaxies are also found in underdense regions, they appear to reside typically in a similarly rich environment as quiescent galaxies on a physical scale of Mpc, and in groups they show a morphological early-to-late type ratio similar to the quiescent galaxy class. With the current data set, we do not find evidence of statistical significant evolution in either the number/mass density of galaxies at intermediate redshift with respect to the local values, or the spectral properties, although more solid results on this and other aspects will be obtained following the completion of the survey.
Conclusions. Several mechanisms related and unrelated to the environment are at work in quenching star-formation activity in galaxies on short timescales ( Gyr). Those galaxies, which are affected by a sudden quenching of their star-formation activity, may increase the stellar mass of the red-sequence by up to a non-negligible level of %.
Key Words.:
Galaxies: formation - galaxies: evolution - galaxies: fundamental parameters - galaxies: mass function - cosmology: observations1 Introduction
Numerous studies have demonstrated that a bimodal population of galaxies exists up to high redshift (e.g., Franzetti et al. 2007; Mignoli et al. 2009). The first population consists of galaxies that are actively star-forming, gas-rich, rotationally-supported, and morphologically disk-dominated. The second population represents typically quiescent galaxies that are gas-poor, pressure-supported, and have spheroidal morphologies. As noted by many studies (e.g., Bower et al. 1998; Brinchmann & Ellis 2000), observational evidence exists that many galaxies have experienced morphological transformations at various redshifts. Brinchmann & Ellis (2000) reported that a decline has occurred in the mass density of irregular galaxies between z 1 and today, in contrast to an increase for regular galaxies. Further support of this redistribution between galaxy types has been provided by study of the stellar mass function by many different surveys, e.g., K20 (Fontana et al. 2004), COMBO-17 (Borch et al. 2006), DEEP2 (Bundy et al. 2006), SWIRE-VVDS-CFHTLS (Arnouts et al. 2007), SDSS (Martin et al. 2007), and VVDS (Vergani et al. 2008). It is important to assess the role of environment in these transformations of galaxy type. For instance, it has been shown that galaxies in dense regions have modified distributions of HI, the primary source of fuel for star-formation, and truncated star-formation activity (e.g., Giovanelli & Haynes 1985; Cayatte et al. 1990; Koopmann & Kenney 2004). However, several other mechanisms may also contribute (see below). Thus, important questions in galaxy formation and evolution are whether star-forming galaxies are the precursors of the quiescent galaxy population observed at the present day, or whether there are alternative paths in galaxy formation, and, if so, what are the primary processes involved and how are they controlled?
The main limiting factor in answering this question is that we still have no true understanding of what triggers star formation in galaxies and why this activity is suppressed in some of them. There is a class of galaxies that might shed light on this issue. They are called or galaxies (depending on the author), or simply galaxies in the post-starburst phase. In this work, we adopt the spectral terminology instead of the morphological nomenclature.
Post-starburst galaxies, discovered by Dressler and Gunn (1983), exhibit peculiar spectral characteristics, i.e., strong Balmer absorption lines, indicative of an intense star-formation epoch in the past billion years, and an absence of emission lines, a signature of a lack of ongoing star-formation. On the basis of these spectral signatures, they have been assumed to represent galaxies in a transitional stage between being a star-forming, late-type galaxy and a passive, early-type system.
Various mechanisms have been proposed to explain the characteristic spectral features of post-starburst galaxies. Cluster-related mechanisms, such as ram-pressure gas stripping, harassment, or strangulation (Gunn & Gott 1972; Larson et al. 1980; Balogh & Morris 2000) are efficient in suppressing the star-formation activity of a galaxy. Events such as galaxy mergers and interactions (Toomre & Toomre 1972; Barnes & Hernquist 1992), commonly found in both the field and in clusters (although more efficient in the field), have been proposed. The large fraction of morphological irregularities (of similar physical timescale as a post-starburst phase) and galaxy companions in the vicinity of these galaxies, support the hypothesis that either a dynamical interaction or a merger with exchange of material may have suppressed star formation. Strong AGN/SN feedback might also contribute to star-formation quenching (Springel et al. 2005; Hopkins et al. 2007), depending on the stellar mass (Kaviraj et al. 2007).
This galaxy population was first discovered, and has been primarily studied since, inside clusters (Dressler & Gunn 1983; Couch & Sharples 1987; Tran et al. 2003; Poggianti et al. 1999, 2009), even if post-starburst galaxies have also been found in the field. Numerous studies have been undertaken to study the properties of field post-starburst galaxies at low redshift (Liu & Kennicutt 1995; Zabludoff et al. 1996; Chang et al. 2001; Norton et al. 2001; Goto & SDSS collaboration 2003; Quintero et al. 2004; Yang et al. 2004), and at (Hammer et al. 1997; Dressler et al. 1999; Poggianti et al. 1999; Balogh et al. 1999; Tran et al. 2004; Yang et al. 2008; Poggianti et al. 2009). These studies commonly concluded that post-starburst galaxies are a heterogeneous parent population.
Post-starburst galaxies appear to be rare at any epoch and discrepant results about their nature are found in the literature. The identifiable sources of discordance are numerous. Besides differences in selection criteria and spectral resolution, the main source of discrepancy may be the different signal-to-noise ratio achieved at different redshifts. This implies that we should also investigate the dependency of the underlying properties on the host galaxies (e.g., the sampling of only the most massive or brightest systems). Furthermore, because of the observational constraints, the majority of studies cover small areas and might probe specific types of environments (large-scale structures in pencil surveys, or studies in clusters). In addition to the observational limitations, finding post-starburst galaxies is also challenging because of the short duration of the post-starburst phase (1–1.5 Gyr) (see Couch & Sharples (1987) and Barger et al. (1996)). Because they represent a small fraction of the total galaxy population, the systematic effects caused by the aforementioned problems require particular attention when interpreting the results in a general framework.
In this paper, we present for the first time a mass-selected sample of post-starburst galaxies at intermediate redshift in a wide variety of different environments. This mass-selected sample and its parent galaxies are extracted from the largest multiwavelength survey existing up to now, the Cosmic Evolution Survey, or COSMOS (Scoville et al. 2007) imaged with HST/ACS (Koekemoer et al. 2007). We provide an overview of the main physical properties of these galaxies using data of unprecedented quality and completeness in this study. We present a first attempt to quantify their cosmic evolution. A more detailed study of this subject and its relation to the general picture of galaxy evolution over the past 8 Gyr will be presented on completion of the survey.
The present work is organized as follows: the data and sample selection are presented in Sect. 2; results are described in Sect. 3, and a summary is given in Sect. 4. Throughout this work, we assume a standard cosmological model with , , and . Magnitudes are given in the AB system.
2 Sample selection
2.1 The spectroscopic survey: zCOSMOS
The zCOSMOS project (Lilly et al. 2007) is a redshift survey of galaxies in the COSMOS field consisting of two observing programs. The “deep part” focuses on high- galaxies () using a combined flux-limited () and colour selection (these observations are not used in the present study). The “bright part” of zCOSMOS project aims to acquire spectra of about 20,000 galaxies () with a rather uniform sampling rate (about 60–70%) across the 1.7 deg2 COSMOS field, a superb spectroscopic redshift success rate (% at ), and high velocity accuracy ( 100 km s-1). The bright part is observed with the red VIMOS MR grism covering the spectral range 5500–9500Å (2.55Å dispersion), which provides an ideal configuration for detecting key spectral features in galaxies out to . This paper deals with the first “10k” galaxy data set completed to date for the bright part of the zCOSMOS survey, which we refer to hereafter as the zCOSMOS survey. All details of data acquisition, reduction, redshift measurements, and their quality can be found in Lilly et al. (2007) and Lilly et al. (2009), which also describes other important aspects of this survey.
2.2 The spectral measurements and sample selection
We measure the spectral features in our 10k sample with an automated software package (platefit_VIMOS). Here we provide a brief outline of the fitting procedure. We refer to Lamareille et al. (2006) for full details, and both Tremonti et al. (2004) and Brinchmann et al. (2004) for further details of the original pipeline developed for the higher resolution SDSS spectra. The best-fit stellar continuum derived from a grid of stellar population synthesis models (Bruzual & Charlot 2003, hereafter BC03) was subtracted from the observed spectrum. Any remaining residual was removed by fitting a low-order polynomial to the continuum-subtracted spectrum, and all emission lines were then fitted simultaneously with a Gaussian profile. Finally, absorption features and spectral breaks were measured after subtracting emission lines from the original spectrum.
In this paper, we use measurements of the spectral index H as defined by Worthey & Ottaviani (1997) and Balogh et al. (1999), the equivalent width of the [OII]3727 doublet (EW[OII]), the equivalent width of the [OIII]5007 (EW[OIII]), and the amplitude of the 4000 Å break (Dn4000) (Balogh et al. 1999). A careful treatment of spectral fitting is mandatory because both emission and absorption lines are present in the Balmer lines. The index H and the equivalent width of the lines are defined such that positive values refer to absorption features.
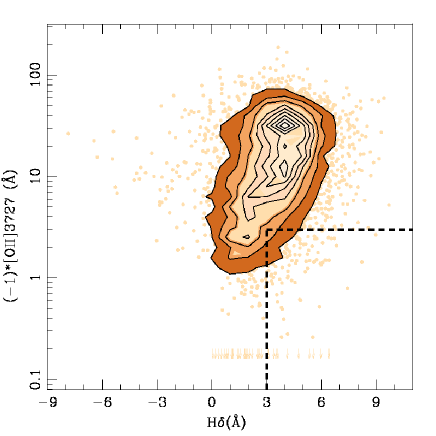
Authors usually adopt H and EW[OII] features in their criteria for selecting post-starburst galaxies, and/or H depending on the spectral coverage, although some exceptions exist. For example, Tran et al. (2004) used a combination of H and H indices, in addition to [OII], Yan et al. (2006) added an empirical limit to EW(H) in constraining EW[OII], and some others used, in addition to a threshold on emission lines, the relative abundance of A-type to K-type stars, i.e., the ratio A/K (e.g., Quintero et al. 2004). In this paper, we adopt a conventional definition using both the [OII] emission line and H, to be able to compare with the majority of other works, although any comparison is difficult and only possible qualitatively. In a future paper, based on the 20k galaxy sample, we will examine the effects of different selection criteria on a larger sample of H-enhanced galaxies (e.g. , Le Borgne et al. 2006) and the possible contribution from obscured AGNs (Yan et al. 2006). In the present paper, our post-starburst candidate criteria are that the equivalent width of H is larger than Å and the equivalent width of the emission line [OII] is larger than Å. This is illustrated in the top panel of Fig. 1, where the equivalent width of H is plotted versus EW[OII] for the 10k-parent galaxies in the redshift interval (the redshift bin explored in this work, which is imposed by our instrumental set-up). This plot shows the spectroscopic criteria adopted to select the post-starburst candidate galaxies. As is evident in Fig. 1, the region corresponding to our candidates is not completely separate from that of the 10k-parent population as it is in the SDSS data (cf. the left panel of Fig. 2 by Yan et al. (2009)). This is mainly due to the errors associated with the spectral measurements. To evaluate their impact on the classification scheme, we tested different empirical thresholds and applied a confidence level to the spectral features when defining our samples. This approach aims to exclude (include) residual signatures of ongoing star formation and to test the reliability of our spectral measurements. While the numbers of objects change depending on the thresholds adopted, of course, we obtained an optimal compromise between the ability to complete a robust, statistical analysis and reliable results by including only galaxies with EW[OII] larger than -3Å and EW(H) larger than 3Å at the 2 confidence level.
To maintain strong control on occasional poor wavelength calibration that can affect in particular the bluest part of our spectra, we visually inspected each spectrum of potential candidates. For spectra with doubtful measurements of EW[OII], we imposed an additional limit on the equivalent width of the EW[OIII] line. We used a subsample of high signal-to-noise 10k spectra and high confidence spectral measurements in which both EW[OII] and EW[OIII] lines were detectable in the spectra, to define this limit on the [OIII] lines. From the best-fit model solution, we inferred a threshold for the EW[OIII] of Å. Furthermore, from all of our catalogues, we removed both stars and broad-line AGNs and adopted a high-quality flag scheme for the spectroscopic redshifts ( confidence level) (for details see Lilly et al. (2007) and Lilly et al. (2009)). Although we inspected each spectrum individually, our confidence level in the redshift measurements is 100% for our post-starburst sample. We also performed quality checks of our post-starburst candidate spectra to verify the impact of residual sky lines on spectral features. We examined the reduced VIMOS spectrum for the impact of fringing effects, which may be significant at wavelengths above 8,500Å because of the thinned, back-illuminated CCDs used in VIMOS (Scodeggio et al. 2005).
The final sample presented in Sect. 3 contains spectra that passed all of the aforementioned tests.
Using the constraints described above, we obtain a sample of 74 post-starburst galaxies in the flux-limited zCOSMOS bright sample in the redshift interval . Three of them are at redshifts higher than . For one object, the computation of a precise absolute magnitude is impossible because of the lack of sufficient photometric coverage, and it is excluded from our statistical analysis (for details see in Zucca et al. (2009)).
2.3 Post-starburst spectral template
Given the difficulties in selecting this rare population of galaxies, we provide a template spectrum111This template can be accessed from the web page http://www.bo.astro.it/∼daniela/template.fits. to the community of the post-starburst galaxy population obtained by stacking 69 zCOSMOS post-starburst galaxies more massive of log() (corrected by selection effects as explained in Sect. 2.5). A description of the steps performed to obtain this template spectrum is given in the following text.
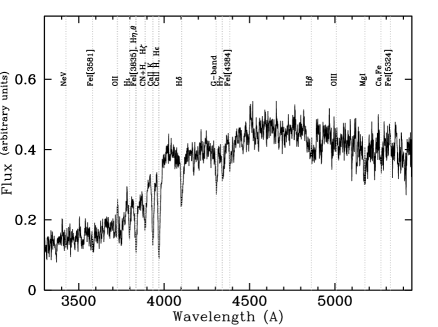
The bottom panel of Fig. 1 shows the template spectrum, which exhibits the distinctive spectral features of galaxies that have recently experienced a starburst before its star-formation was quenched prior to observations. These features can be summarized as follows:
i) The strength of the [OII] nebular emission line, which is
emitted in HII regions around O and B stars, is almost absent
(EW[OII]2.5Å) in our template spectrum. Given that [OII] is an
indicator of recent star formation (with lifetime of 107 yr), this
property indicates that the star formation during the epoch of the
observation has stopped. The H emission line is another robust
indicator of ongoing star formation, but cannot be detected with our
adopted VIMOS MR-grism observational setup, which covers
the spectral range .
ii) Another typical spectral feature of this galaxy population
is the strong absorption features of Balmer lines. Although
H and H are often filled in by nebular emission that can
make their interpretation difficult, H can be used to estimate
the stellar ages. From late-type stars to earlier-type stars, the
H strengthens. This can be achieved if A-stars dominate the
main-sequence contribution near the epoch of the observation.
iii) As noted originally by Rose (1984), the ratio of the
equivalent widths of the CaII HH to
CaII KÅ spectral lines is constant in stars later
than about F02, but increases dramatically for earlier type stars as
the CaII lines weaken and H strengthens. This spectral
property is also illustrated in our template spectrum, where the
CaII HH is deeper than the
CaII KÅ absorption lines.
iv) We note the lack of emission from [OIII] and H lines in
our template spectrum, which indicates that narrow-line Seyferts do
not represent an important component of our sample, in contrast to
other works (e.g., Yan et al. 2009).
The combined use of the two SFR estimators (H and [OII]), which are sensitive to stars of different stellar masses and lifetimes, allows us to obtain in the next section a quite precise cosmic clock of their recent ( Gyr) star-formation history, and to characterize their physical properties.
2.4 Stellar masses
Since we studied galaxies that are understood to have experienced a recent secondary burst of star formation, we used Charlot & Bruzual models with the inclusion of secondary bursts (Charlot & Bruzual in prep., or CB07). These models have been frequently used to model the complex star-formation history of a galaxy more realistically than a purely exponentially declining law (Kauffmann et al. 2003a; Brinchmann et al. 2004; Salim et al. 2005).
Stellar masses were derived by fitting stellar population synthesis models from the library of CB07 to the broad-band optical (CFHT: u, i, Ks; Subaru: B, V, g, r, i, z; Capak et al. 2007) and near-infrared (Spitzer/IRAC: 3.6m, 4.5m; Sanders et al. 2007) photometry by minimizing the chi-square test statistic for each galaxy. The estimate of the stellar mass provided by the best-fit model spectral energy distribution is the current mass contained in stars in each galaxy at the epoch of the observation obtained by integrating the star formation history over the galaxy age and subtracting the cumulative mass lost during stellar evolution.
The measurement of stellar mass included some assumptions. We used a Chabrier initial mass function (Chabrier 2003) with a lower and upper cutoff at 0.1 and 100, a dust attenuation described by the model of Charlot & Fall (2000), and metallicities between 0.1 and 2 ☉. The star-formation history was modelled by two components. The first component was a continuous star-formation model with an exponentially declining law of the form SFR(t) exp (-t/), where timescale and age t are in the range [Gyr] [1,] and t/[Gyr] . The second component was represented by random bursts superimposed on the first component that had an equal probability of occurring throughout the life of the galaxy.
Of course the results depend on the adopted assumptions and models used. For example, the assumption of a Chabrier initial mass function produces a consistent difference in the values of the stellar mass at fixed age that is within a factor of 1.7, but with a small dispersion, of those derived with the Salpeter IMF prescription (Pozzetti et al. 2007). The inherent uncertainty in the initial mass function adopted is not a global limitation for results based on stellar masses given the constancy of this rigid shift over a wide range of star formation histories, although to limit the various degeneracies a large set of grids of stellar population synthesis models were used. Further details of the stellar mass measurements can be found in Bolzonella et al. (2009) and Pozzetti et al. (2007, 2009).
2.5 Post-starburst representative sample
Since our original selection is based on a flux-limited survey, we used subsamples of galaxies complete in terms of stellar mass (adopting two independent approaches) to avoid selection biases.
In the first approach, we adopted a conservative limit to the stellar mass of log() in the redshift bin (from now on, this stellar Mass STringent criterion refers to sample ST). This stringent mass limit was defined using Mock catalogues from the Millennium simulation (De Lucia & Blaizot 2007) of the zCOSMOS bright sample (see Meneux et al. (2009) for an exhaustive explanation on the subject). We selected 18 post-starburst galaxies for this conservative mass-complete sample, or sample ST.
To maximize the quality of the statistical analysis, we also constructed a second sample, or sample COR, including galaxies more massive than log() in the redshift bin , and accounting for under-represented galaxies at high by correcting with statistical weights and a formalism (Schmidt 1968). The total volume sampled by the survey within the redshift bin explored is denoted by . The volume is the maximum volume in which each galaxy of a given magnitude is still observable. We applied the statistical weights adopted in the studies of luminosity and mass functions of the zCOSMOS sample (Zucca et al. 2009; Bolzonella et al. 2009; Pozzetti et al. 2009). These weights are the product of the inverse of the target sampling rate (TSR) and the inverse of the spectroscopic sampling rate (SSR). The target sampling rate is the ratio of the objects spectroscopically observed to the total number of objects in the parent photometric catalogue. The spectroscopic sampling rate is the ratio of the number of observed objects with reliable redshifts to the total number of observed objects, calculated in bins of apparent magnitude. The apparent magnitude dependence takes into account the decline towards fainter magnitudes, in our ability to measure a redshift. A more complex scheme that introduces a redshift dependence of SSR does not alter the final results appreciably in the redshift bin explored here (see Bolzonella et al. 2009). In the sample COR, the mass completeness limit, which depends on both redshift and mass-to-light ratio, also takes account of the colour-magnitude relation (Pozzetti et al. 2009; Bolzonella et al. 2009).
The second approach permits us to increase the number of objects (from 18 to 69) in our analysis and explore a wider redshift bin () than that of for sample ST. However, we always compare the results obtained with this MCOR sample with those obtained with the complete MST sample to validate further our conclusions.
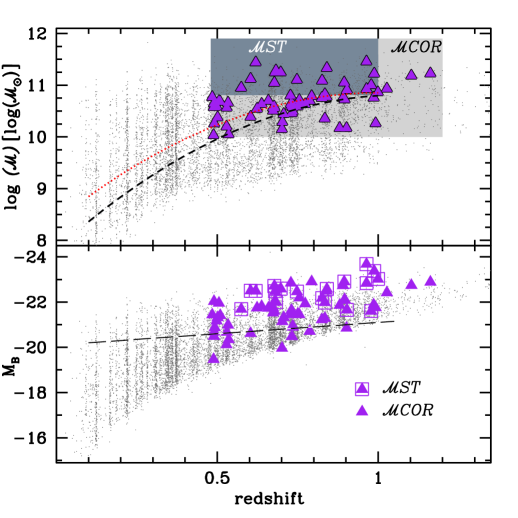
Figure 2 shows the stellar mass of the zCOSMOS bright sample as a function of redshift and, overplotted, the data of the post-starburst galaxies in our mass-complete samples (with violet, triangle symbols). We note that the conservative limit imposed by Mock catalogues agrees well with the completeness in the observed mass-to-light ratio for the global population. This limit is similar to the more conservative limit obtained for the early-type population (defined using the spectrophotometric classification described in Zucca et al. 2009). The statistical weights and mass completeness adopted are the values used in the luminosity and mass function studies by Zucca et al. (2009), Bolzonella et al. (2009), and Pozzetti et al. (2009). In the same figure, we also plot the B-band absolute magnitude as a function of redshift. It is important to note that our sample ST, which is complete in terms of stellar mass such that log(), is brighter than the evolving-luminosity limit at M (illustrated with the dashed, black line overplotted in the left panel of Fig. 2).
2.6 Comparison samples
We compiled two comparison catalogues of strongly star-forming and quiescent galaxies. For these galaxies, we also adopted consistently the same stellar mass completeness criteria, redshift flags, and confidence levels on the spectral measurements as used in defining the class of post-starburst galaxies.
The star-forming and quiescent galaxy classes were selected using a pure spectral classification. We combined measurements of the amplitude of the 4000 Å break, taken as an age estimator of the underlying stellar population, and the equivalent width of the [OII]3727 line, assumed to be an indicator of the star-formation activity. Thus, quiescent galaxies were defined to be galaxies with a zero, or negligible, star-formation rate inferred using the EW[OII], i.e., EW[OII]Å, and an old underlying stellar population described by their large 4000Å break (Dn4000) (e.g., Kauffmann et al. (2003b)). We defined a sample of strong EW[OII] emitters by constructing a catalogue of objects with EW[OII]Å and small 4000 Å break (Dn4000). From the 10k sample, we also compiled the 10k-parent catalogue of galaxies following the selection in stellar mass adopted for sample COR and sample ST, and all other criteria listed above (from now on when we use the terminology “all objects”, we refer to the 10k-parent catalogue).
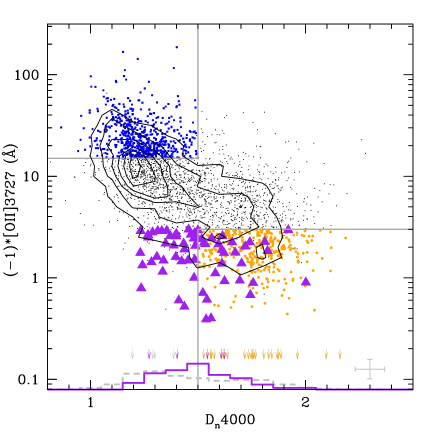
Our selected samples are displayed in Fig. 3, where the selection criteria used to classify galaxies in our comparative analysis are shown. This figure illustrates how the three classes of galaxies (highly star-forming, quiescent, and post-starburst galaxies) populate the plane of the amplitude of 4000 Å break and EW[OII]. Small points and isophotal contours in steps of 15%, with the faintest isophote level starting at 15%, show the 10k-parent galaxies level. Using criteria adopted for sample COR, we obtain a comparison sample of 295 quiescent galaxies and 174 star-forming galaxies, while we have 178 quiescent galaxies and 45 star-forming galaxies in sample ST. The 10k-parent galaxies number 1508 following the criteria of sample COR, and 665 for sample ST.
3 Results
We present the main physical properties of the mass-selected post-starburst galaxies identified in the zCOSMOS survey in attempting to obtain a coherent picture of their origin in the context of galaxy formation. Our analysis refers to galaxies of the statistically corrected, mass-complete sample at (sample COR) and the conservative mass-limited sample at (sample ST).
3.1 Robustness of our sample: dusty starburst hypothesis?
Galaxies with spectral characteristics similar to those used to define a post-starburst galaxy are often interpreted to be a system in which star formation has suddenly and almost completely stopped within the past few Gyrs. This cessation of star-formation is assumed to explain the lack of emission lines in the galaxy spectrum.
An alternative explanation, however, is that these galaxies do have emission, but that this is extinguished by a significant amount of dust. Galaxies with these characteristics should be dusty, starburst galaxies (and misclassified post-starburst objects). This is a hypothesis that should be verified especially when dealing with galaxies understood to have experienced a recent, strong burst of star formation. OB stars responsible for the [OII] emission, as other younger stellar generations, are more strongly obscured by dust than older stellar populations. This age selective dust extinction enables the true strength of the Balmer absorption lines to be measured, but only a fraction of the emission to be detected in stronger starburst galaxies (Poggianti et al. 2001, 2009). To ascertain whether our sample of post-starburst galaxies may be contaminated by dusty starburst galaxies, we performed different tests. First, we explored the dusty starburst scenario by computing both the extinction values and star-formation rate by SED fitting. Secondly, taking advantage of the available multiwavelength observations, we explored the X-ray and 1.4 GHz radio data sets (Schinnerer et al. 2007; Cappelluti et al. 2009; Brusa et al. 2009).
1) Dust extinction and SED fitting SFR. We found that post-starburst galaxies have in general low values of extinction as estimated by fitting CB07 model SEDs (median value ). The median SFR is 0.6 yr-1, and the 25% and 75% quartiles of the distribution range from 0.01 yr-1 to 4.2 yr-1. The distributions of both and SFRs for post-starburst galaxies differ at a high confidence level from the same distributions for star-forming galaxies ( and ). While post-starburst galaxies exhibit a similar cumulative distribution to quiescent galaxies, the latter galaxies have an even lower rate of star-formation activity, as expected when using the used spectroscopic criteria described in Sect. 2 to identify them ( and ). For only one post-starburst galaxy do we infer from SED fitting a high rate of star-formation activity ( yr-1) and a high extinction (). This object is one of the two post-starburst galaxies detected at both X-ray and radio 1.4 GHz frequencies, even if the radio detection is only at the confidence level (see below).
2) 1.4 GHz radio frequency. We investigated the dusty starburst hypothesis further by cross-correlating our sample with the 1.4GHz VLA-COSMOS survey (Schinnerer et al. 2007; Bondi et al. 2008). If it is not produced by AGN emission, the radio flux is indicative of the current star-formation activity (over short timescales of 108 yr) unbiased by dust (see Condon 1992, for a review).
We found that one post-starburst galaxy has a counterpart at 1.4 GHz radio frequency with a detection confidence level of and five others have possible 1.4 GHz emission at confidence level. For the entire sample of 74 post-starburst galaxies, we therefore have a detection rate of 1.31.3%, if we adopt the threshold of 4 for assuming a radio detection to be true (as adopted in Schinnerer et al. (2007) and Bondi et al. (2008)). This detection rate increases to 8.12.7%, if we adopt the less conservative threshold of 3 for radio detection.
To investigate the mean radio properties of the post-starburst galaxies, we performed a stacking analysis of the 1.4 GHz radio images. From the stacking analysis, we excluded the six post-starburst galaxies with a possible radio counterpart plus three additional sources that exhibit, within 2.5″ of their optical position, either radio emission more significant than 3 that is not associated with the post-starburst galaxy, or a negative radio peak of higher significance than 3. For the remaining 65 post-starburst galaxies, images of 40 40 pixels (corresponding to 14″ 14″) were extracted around the optical position. Finally, all the 65 images were combined to obtain a median image with a 1 radio noise of 2 Jy. A marginal detection of confidence level was found at a distance of 1.4″ from the centre of the stacked image with a radio flux of 7 Jy. To access the reliability of this detection, we repeated the stacking analysis for 5 different samples, each of them consisting of 75 random positions. The criterion used to exclude from the stacking, post-starburst galaxies with a radio detection (or a negative radio peak, see above) was applied similarly to the simulated samples. All 5 stacked images from the simulated sample had a 1 radio noise in the range 1.4-1.8 Jy. No radio detection was identified for any of the simulated stacked images.
Therefore, assuming the marginal detection in the stacked image to be real and assuming its flux of 7 Jy to be the mean radio flux of radio-quiet post-starburst galaxies, we can estimate their mean star-formation rate, or more realistically its upper limit since some objects may be AGNs. We obtained an upper limit of 8.2 yr-1 by adopting the calibration by Bell et al. (2003). The radio luminosity L1.4GHz was calculated by assuming a median redshift of .
We then explored the physical properties of the six () radio-detected post-starburst galaxies. Radio-detected post-starburst galaxies are slightly more massive and brighter than non-radio-detected post-starburst galaxies (log versus log ; M versus M). Post-starburst galaxies with a counterpart at 1.4 GHz also show slightly bluer colours ((U-B)) than non-radio-detected post-starburst galaxies ((U-B)). Although these differences are not statistically significant per se, their properties and low detection rate suggest that radio-detected post-starburst galaxies might represent the initial phase in the evolution of post-starburst galaxies, close to the peak of the starburst (the timescale of radio emission is an order of magnitude shorter than that of the phase).
3) X-ray counterparts. To characterize the multiwavelength properties of post-starburst galaxies, we also searched for their possible X-ray counterparts using the available data provided by XMM-Newton for the entire 2 deg2 of the COSMOS field (Cappelluti et al. 2009; Brusa et al. 2009) and Chandra over the inner 0.9 deg2 (Elvis et al. 2009) at considerably deeper X-ray flux levels. While only one post-starburst galaxy is detected by XMM-Newton for a matching radius of 6″, five X-ray sources (four “new” plus the XMM-Newton one) are detected by Chandra (within 4″ because of the sharper PSF) at a detection likelihood 10.8 in at least one X-ray band (see Elvis et al. 2009 and Puccetti et al. 2009 for further details) among the 54 post-starburst galaxies located in the field of Chandra mosaic. Visual inspection of all of these sources supports their likely physical association with the post-starburst galaxies under investigation. All of the five post-starburst galaxies detected by Chandra are in regions of moderate-to-high exposure time (100 ks), where more than one Chandra pointing is available (Elvis et al. 2009). However, the limited number of counts ( 9–40) in the 0.5–7 keV band prevents us from performing an adequate X-ray spectral analysis. X-ray counts were converted into fluxes (using a power-law model with photon index , as adopted in the Chandra-COSMOS catalog; Elvis et al. 2009), and then into 0.5–10 keV rest-frame luminosities (given the source spectroscopic redshifts of 0.67–1.10) of 1.1–8.6 erg s-1.
At least for the three sources with the highest X-ray counts in the hard band (above 2 keV), this luminosity range suggests a significant contribution from AGN emission. The assumption of a photon index of , which is typical of unobscured AGN emission, would decrease X-ray fluxes and luminosities by 25%. The optical spectra of these three sources with the highest X-ray counts in the hard band, might indicate that they are AGN host galaxies.
Of these five X-ray sources, two have a clear association with sub-mJy sources in the VLA catalog (Bondi et al. 2008), one of which has the highest SFR of all sources and dust extinction inferred from SED fitting.
To place constraints on the properties of the X-ray undetected post-starburst galaxies, X-ray stacking analysis was applied to the remaining 49 sources, extracting source counts from circles of 5″ radius and background counts from a region at least 10″ away from the source position. X-ray sources present in the Chandra source catalog (Elvis et al. 2009) were carefully masked. To limit the problems with the PSF at large off-axis angles, we extracted source counts using only observations where the source position was located within 8′ of the field centre (see Miyaji et al. (2008) and Kim et al. (2009) for a description of the tool adopted here). We did not find any significant signal from the stacked post-starburst galaxies using Chandra; the 3 flux upper limit to the stacked 0.5–8 keV counts is cgs, corresponding to a rest-frame 0.5–8 keV luminosity of erg s-1 at the average redshift ( 0.73) of the stacked sources. This upper limit to the stacked signal is consistent with emission from normal and starburst galaxies.
Dewangan et al. (2000) reported a detection of an active nucleus in one post-starburst galaxy selected during a search for ultrasoft sources in a ROSAT campaign, but no radio emission was detected within a radius of 15″ in the NRAO/VLA and FIRST sky surveys. In previous studies, similar counter-checks led to a detection rate of the order of 1-15%. Miller & Owen (2002) using the galaxies selected by Zabludoff et al. (1996), detected 2 in 15 post-starburst systems in radio continuum (corresponding to a star-formation rate of about 2-6 yr-1), and 1 in 56 objects were detected by Blake et al. (2004) (at 7 yr-1). Using Chandra observations of the Extended Growth Strip from DEEP2, Georgakakis et al. (2008) found an association between post-starburst galaxies at and AGN, supporting a moderate levels of AGN obscuration. Although these results are difficult to compare because of different selection criteria and different mass and luminosity ranges, these results have been used to claim that at least some “so-called post-starburst” galaxies are still actively forming stars, implying that a selection based of the blue-part of the optical spectra is imprecise. Some authors have shown that optical spectra typical of a post-starburst galaxy in the blue part of their spectrum, have substantial H emission (e.g., Liu & Kennicutt 1995). We fully agree with the statement by e.g., Miller & Owen (2002) that the minimum requirement for defining a system in their , or post-starburst phase is the coverage of both blue- and red-parts of the optical spectrum, or complementing the optical data with other wavelength data sets.
Based on our complementary radio-continuum and deep X-ray data, we found that a negligible fraction of our post-starburst galaxies, selected by using blue diagnostics of the optical spectra, have possible residual star-formation activity, and a small percentage shows a contribution from AGN emission. Thus, the main conclusion of our present study is that we have selected a robust sample of post-starburst galaxies.
3.2 Basic properties: luminosities, stellar masses, and colours
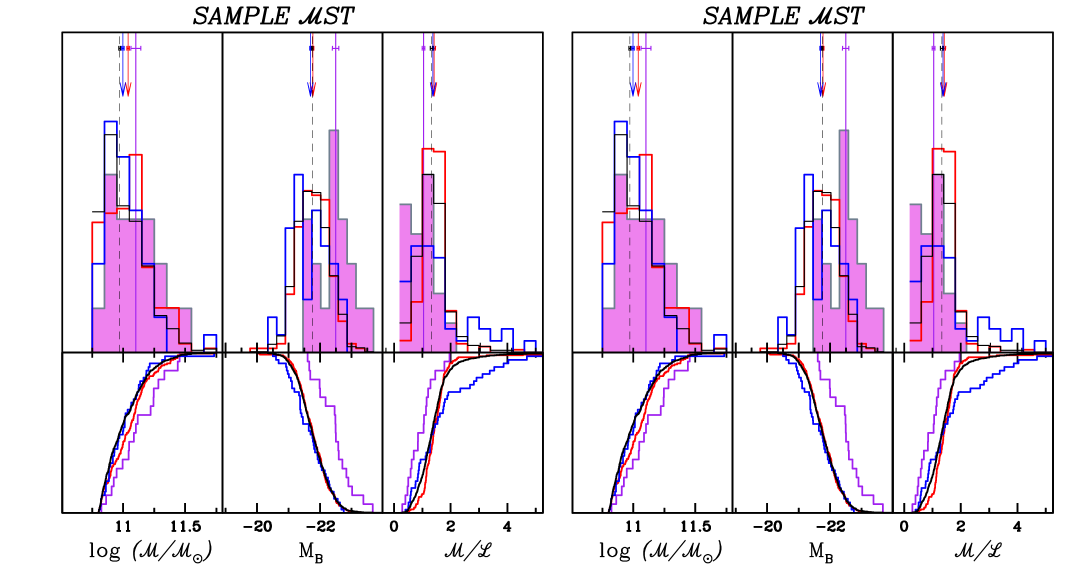
The B-band absolute magnitude distribution plotted in Fig. 4 shows that post-starburst galaxies of the conservative sample ST populate the brightest tail of our 10k-parent galaxy population. The post-starburst galaxies more massive than log() are brighter by mag than the galaxies in both our comparison classes. A similar analysis of the sample COR galaxies confirms that the post-starburst galaxy sample is systematically brighter by mag than the median brightnesses compared to median values of the other galaxies. Both these results are statistically significant at more than the level. One of the reasons for this B-band brightness excess is probably a recent burst of star formation in post-starburst galaxy candidates, as commonly concluded in past studies.
Post-starburst galaxies also populate the massive tail of the 10k-parent galaxies (see Fig. 4). Their mass distribution differs from that of the 10k-parent galaxies at % confidence level using the Kolmogorov-Smirnov test (Press et al. 1992), and our post-starburst candidates are as massive as quiescent galaxies. Our different samples selected using the MCOR criteria show the typical increasing trend in stellar mass and mass-to-light ratio expected on the basis of their galaxy classification from star-forming galaxy population to quiescent galaxies. Given the similar magnitudes and stellar masses spanned by the star-forming and quiescent galaxies selected using the MST criteria, this trend is not visible in the corresponding panels of Fig. 4. Post-starburst galaxies appear to have a brighter B-band luminosity because of a combination of a high stellar mass and relatively low mass-to-light ratio. Among the most massive galaxies (criterion ST), there is a trend for post-starburst galaxies to be the most massive objects, more massive than quiescent galaxies (at and star-forming galaxies (at ). Since our post-starburst galaxies are already so massive, we may conclude that their progenitors cannot be common star-forming galaxies that have assembled their stellar mass by means of a continuous, smooth star-formation history and that have stopped, for whatever reason, forming stars. Indeed to justify the observed stellar mass assembly of a post-starburst galaxy with a typical stellar mass of log() (see Fig. 4), a specific-SFR (SFR) of (or SFR yr-1) is required for a galaxy with a stellar mass of log() (where 10.23 is the median stellar mass found for our star-forming galaxies). This specific-SFR value is typical of an object with a high star-formation efficiency. Furthermore, we can also exclude the dry merging hypothesis, i.e., the merging of galaxy progenitors in the absence of gas, as the strength of the H absorption lines implies a recent burst of new stars, i.e., that fresh gas should have been recently available. Therefore, the possible progenitors might be the already massive, less numerous star-forming galaxies at each cosmic time, or/and the most actively star-forming sources that in a short period of cosmic time can assembly sufficient stellar mass: in other words, the ’s progenitors might be galaxies with the highest values of specific star formation rates at any epoch, assuming that the mass assembly is a process sustained by star formation activity at the observed rate, i.e., no merger events are invoked.
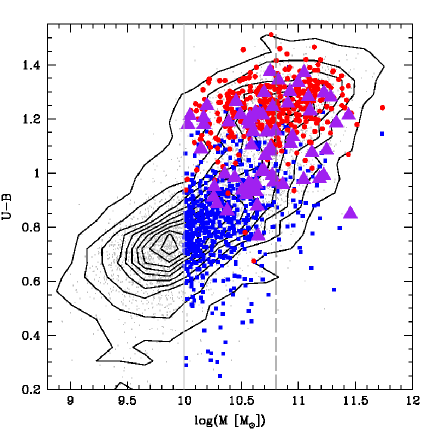
Quiescent and star-forming galaxies populate the red sequence and the blue cloud, respectively, as shown in Fig. 5 for sample COR. The peak of the distribution for quiescent galaxies is at , and star-forming galaxies are distributed around a locus of in sample COR (colours are slightly redder for star-forming galaxies in sample ST by mag, due to the higher stellar mass selection). The underpopulated region in-between the two distributions, i.e., a region called the green valley, is the locus within which our post-starburst galaxies are located. In the colour-magnitude diagram, they are on average redder than star-forming galaxies, and bluer than quiescent galaxies. Although the median distribution of colours appears to imply that the green valley is populated by post-starburst galaxies, they span a wide range of colours. This property is confirmed in Fig. 3, where the 4000 Å break histograms of the 10k-parent sample and post-starburst galaxies are shown along the x-axis (with a solid, violet line and dashed, gray line, respectively). The 4000 Å break of post-starburst galaxies ranges between quite small values (typical of star-forming galaxies) and quite high ones (characteristics of quiescent, passive galaxies), or , with a peak at .
Based on this result, selecting post-starburst-candidate galaxies such as those that exhibit stronger Balmer absorption lines than expected for their 4000 Å break, e.g., in a way similar to the criterion adopted by Wild et al. (2009), should underestimate their true fraction. Our result might justify the low detection of this class of galaxies in the VVDS field. Wild et al. find only 5 post-starburst galaxies in the VVDS field, scaling from their quoted 18 H strong galaxies with nebular emission lines to 5 properly-defined post-starburst galaxies (i.e., those objects among the 18 detected ones without nebular emission lines).
Our result indicates that post-starburst galaxies, which populate the green valley for a very short time, provide a suitable galaxy population to occupy the gap between blue and red galaxies in the colour-magnitude relation observed at any redshift from the local Universe up to . Although galaxies may represent some of the galaxies in the green valley, we do not however propose that they constitute the entire population of green-valley galaxies.
3.3 Morphologies and structural parameters
We investigated the morphological properties of post-starburst galaxies using the high spatial resolution HST/ACS F814W images (Koekemoer et al. 2007). Galaxy morphologies contain the imprints of stellar populations, gas content, and dynamical structures. Thus, if an event such as merging has occurred in the recent history of a galaxy, its signature should be observed, given that the timescale of gravitational disturbances induced by merging is similar to that of the post-starburst phase.
We used the ZEST morphological classification of Scarlata et al. (2007a) based on five non-parametric diagnostics to define early, late, and irregular morphological classes of all studied galaxies in this work. We also explored in more detail properties such as the asymmetry index, the degree of irregularities, and the concentration of the light.
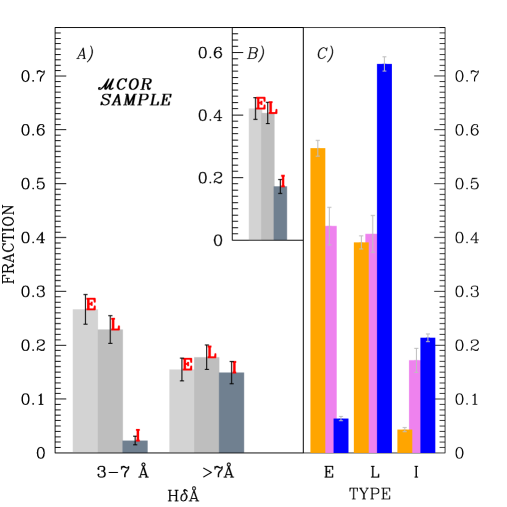
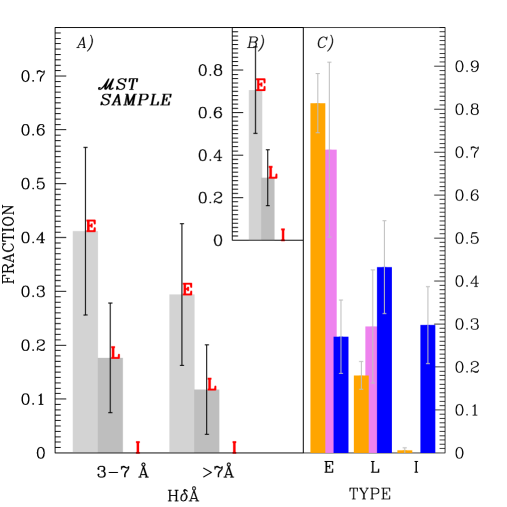
The upper panel of Fig. 6 illustrates that a similar fraction of post-starburst galaxies in the sample COR are bulge-dominated (E) and disky-dominated (L) (see panel B). How the galaxies are distributed between the so-called early- and late-type divisions is independent of their H strength shown in panel A of Fig. 6. There is, instead, an increase with H in the fraction of post-starburst galaxies in irregular systems. In panel C, we show the relative fractions of the three different morphological types (bulge-dominated, disky-dominated, and irregulars) that are post-starburst galaxies compared to the same fractions for the samples of quiescent and star-forming galaxies. As expected, star-forming galaxies are mostly disky-dominated with % having irregular morphologies, while the majority of the quiescent galaxies are bulge-dominated. Morphologically, post-starburst galaxies are a heterogeneous population, although we note that the most massive post-starburst galaxies (sample ST) are predominantly bulge-dominated systems (see lower panels of Fig. 6) and have a similar distribution among morphological types as quiescent galaxies. It is interesting to note that in the sample ST, there is no post-starburst galaxy with an irregular morphology, but we also note the low number statistics in the current sample ST.
In some studies, post-starburst galaxies are found to be mostly bulge-dominated and/or have a morphology that is consistent with being early-type (Goto & SDSS collaboration 2003; Quintero et al. 2004; Tran et al. 2004; Blake et al. 2004; Goto 2005; Balogh et al. 2005; Poggianti et al. 2009), and in some others have a high incidence of disks and spiral arms (e.g., Franx 1993; Couch et al. 1994; Dressler et al. 1994; Caldwell & Rose 1997; Dressler et al. 1999). For example, Quintero et al. (2004) visually inspected a sample of 160 galaxies from the SDSS at , and classified 90% of them as bulge-dominated systems. Yang et al. (2004) used the term “diverse morphologies” to describe five high-resolution HST images of k+a galaxies selected from the sample of Zabludoff et al. (1996), although we note that their selection did favour the bluest systems, i.e., the ones with smallest Dn4000 that have experienced most recently a significant starburst episode. Their detailed study using bulge-to-disk two-dimensional fitting decomposition of four of them identified one barred S0, two disky systems, and one unclassifiable galaxy. Their inferred central light distributions were found to have a profile similar to, but more luminous, than that of a typical early-type power-law. At higher redshifts, Tran et al. (2004) found more bulge-dominated systems in their galaxy sample than in field galaxies. The sample was selected from a program designed to study galaxy evolution in clusters, and galaxies were selected using a conservative constraint on both the H and H Balmer indices and according to the absence of [OII] emission line. A study based on visual classification of ACS/HST images by Poggianti et al. (2009) identified a higher fraction of S0 and Sa types among field post-starburst galaxies than Dressler et al. (1999) who instead found a higher fraction of later types among post-starburst galaxies.
Based on the morphological results obtained for the present post-starburst galaxy sample, we agree with the widely established result that post-starburst galaxies are morphologically a heterogeneous population. We also found an increasing fraction of early-type morphologies at increasing stellar mass in agreement with the well known mass-morphology relation (e.g., Tasca et al. 2009). We might find in the future with larger data sets spanning a wider range of galaxy properties, that the flux limits and other selection effects might play a critical role in the morphological classification, e.g., favouring an early-type assignment for brighter/massive systems as found in this work.
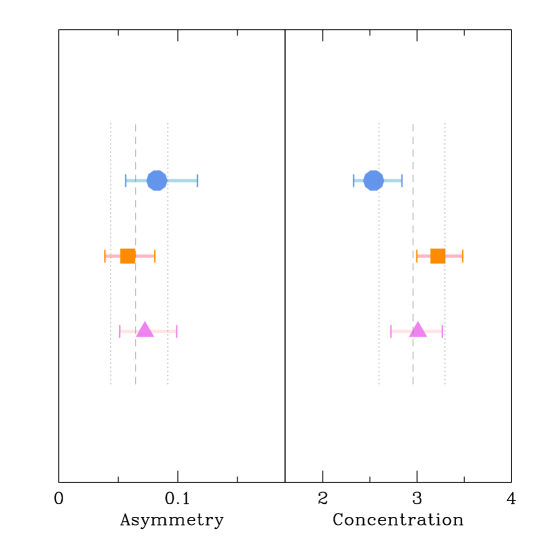
Apart from being heterogeneous in their morphologies, the second common feature used to describe post-starburst galaxies by most authors is the large fraction of asymmetries and clumpiness properties associated with them (e.g., fine structure, and tidal tails). We quantify the degree of asymmetry in the light distribution using the asymmetry coefficient computed as the difference between the image rotated through 180 degrees and the original frame following the usual prescription (e.g., Conselice et al. 2000) (for details see Scarlata et al. (2007b)). Figure 7 shows that for post-starburst galaxies in the sample COR, the median and range of the asymmetry index are intermediate between values for quiescent galaxies (and the 10k-parent sample) and star-forming galaxies. Comparing the asymmetry distributions of post-starburst galaxies with those of star-forming and quiescent galaxies, they both differ at higher than the 99.9% KS-test confidence level. Similar results are obtained for the light concentration, which is defined to be the ratio of the radius including 80% to that including 20% of the galaxy light and measures the central density of the galaxy light distribution. In Fig. 7, we show that the light concentration indices of post-starburst galaxies are typically in-between the values for quiescent and star-forming galaxies. These differences in both the morphological classification and the parameters of asymmetry and light concentration of post-starburst galaxies and that of both star-forming and quiescent galaxies, suggest that post-starburst galaxies represent an intermediate stage of galaxy evolution.
Using the ZEST scheme, the distortion of the light distribution is quantified by the clumpiness index. This index is available for galaxies classified as early- and late-types, i.e., not for irregular galaxies, which by definition are very distorted and for which the index might be associated with only the maximum degree of clumpiness. The flags for the clumpiness index range from zero, indicative of a smooth light distribution, to three, corresponding to a clumpy light distribution (see Table 2, Scarlata et al. (2007a)). We found that the majority of quiescent galaxies have a smooth light distribution (86% have flags of or ), whereas star-forming galaxies tend to have a classification consistent with having a clumpy structure (70.2% have flags or ). Post-starburst galaxies have a frequency distribution of concentrations that overall is similar to that of quiescent galaxies. This is indicative of a smooth light distribution and consistent with a picture in which the star formation experienced in the recent past by these galaxies, has ultimately faded to produce a smoother morphology.
Using Hubble Space Telescope (HST) WFPC2 images, and in agreement with our results, Caldwell et al. (1999) detected smoother morphologies in six post-starburst galaxies than in the starburst galaxies of their sample. In contrast, the latter galaxies had centrally concentrated star formation (we note, however, weak [OII] emission in two of the six objects that identify them more appropriately with the H strong galaxy class). Tran et al. (2004) detected both centrally concentrated light emission and clumpy regions in the HST WFPC2 images of five post-starburst galaxies. Although no conclusive results can be drawn because of the widely ranging properties of post-starburst galaxies, it remains plausible that they represent a transient phase between an intense centrally-concentrated burst of star-formation and a more quiescent stage of star-formation activity.
3.4 Environmental properties
In this section, we explore the typical environment of post-starburst galaxies, considering for example whether they live preferentially in overdense regions, and on which physical scales (from group- to cluster-scales). We also investigate the relative numbers of group galaxies of particular morphologies. This aspect of the post-starburst galaxy population, i.e., the study of their environment, is of particular interest insofar as it represents an attempt to shed light on the physical mechanisms responsible for quenching the star formation in this class of galaxies. Apart from the unprecedented quality and completeness of this data set, the zCOSMOS survey provides an ideal sample for studying the environmental properties because it is designed to detect structures down to the physical scales of galaxy groups with a velocity uncertainty of approximately km s-1, or (see Lilly et al. 2009).
We used the three-dimensional density estimators derived by Kovač et al. (2009) with the ZADE (Zurich Adaptive Density Estimator) algorithm. We refer to Kovač et al. (2009) for a full description of the methodology for which we provide only a brief outline. Given the current spectroscopic sampling rate (%) of the 10k sample, we attempted to study the entire volume targeted by zCOSMOS by adding the 30k photometric redshifts of all COSMOS galaxies to the presently available 10k spectroscopic redshifts. In this way using the reconstructed three-dimensional galaxy distribution, we used the density estimates based on a volume-limited catalog after application of an adaptive kernel (based in turn on nearest neighbours). This choice allowed us to account for the redshift galaxy evolution over the redshift range covered in this analysis. We used the nearest neighbour to determine the projected local galaxy density. The environment of each galaxy relative to the mean density at a given redshift () was expressed as an overdensity , where . The typical errors associated with this estimator are of the order of (see Fig. 4 of Kovač et al. 2009). As tracers, we used galaxies with magnitudes brighter than M () over the redshifts range sampled in this analysis (0.48-1). The typical comoving scales sampled range between Mpc (when we use the 5th nearest neighbour estimator) and Mpc (using the 20th nearest neighbour estimator). Several estimates of the overdensity of each galaxy are available, i.e., weighting by either stellar mass or luminosity. In this work, however, we used the number-weighted estimators, i.e., no further weighting was applied to our environmental estimators.
To investigate the role of the environment on the physical scales of groups of galaxies, we used the zCOSMOS optically-selected group catalog (Knobel et al. 2009). Both the algorithm for group detection and the group catalogues were presented in Knobel et al. (2009). We describe briefly the main points of the algorithm and refer the reader for an exhaustive description to the respective paper. Two combined group-finding algorithms (the friend-of-friend method and the Voronoi tesselation density estimator) were implemented to obtain the final catalogue of galaxy groups. This combined approach, tested with Mock catalogues, lowers the impact of systematic effects, such as spurious detections and missing groups, group fragmentation, or overmerging. Properties such as velocity dispersion, dynamical mass, and group richness, were available for each group with an associated error of the order of 20%. The bright magnitude limit (at ) of the survey explains in part the relatively small number of detected group members (the majority of them have 2-4 individual members). The final catalogue lists a total of approximately 800 groups with a completeness ranging between 70% to 90% (see Fig. 8 of Knobel et al. 2009) and a fraction of 20% being interlopers.
There are two peculiarities of the zCOSMOS density field (cf. Fig. 18 of Knobel et al. (2009)) that may affect our group-based zCOSMOS results. The first peculiar feature in the group reconstruction is a lack of group galaxies in the 10k sample compared to Mocks at . The second peculiarity is an excess of group galaxies at that is not reproduced by any of the Mock catalogues. These peculiarities might be related to a significant underdensity and overdensity observed at and , respectively, in the reconstructed three-dimensional density field by Kovač et al. (2009). Finally, we note that at , the fraction of 10k galaxies in groups is on average about 15%, and never exceeds 30%.
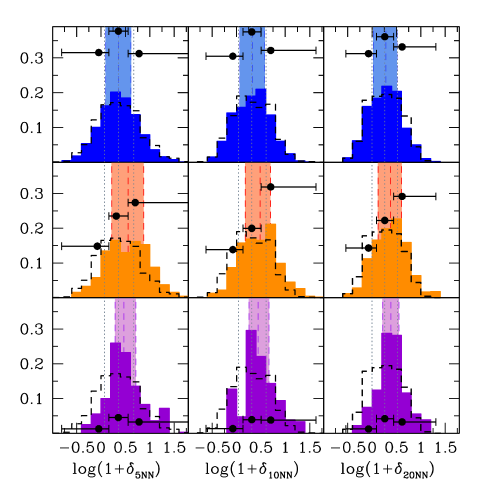
We now study the properties of post-starburst candidate galaxies in different environments, and compare their properties with those of strong EW[OII] emitters, quiescent galaxies, and the 10k-parent sample. The environmental properties estimated using the 5th, 10th, and 20th nearest neighbour for zCOSMOS post-starburst galaxies and the comparison samples are shown in Fig. 8. The typical physical scales for which our analysis was performed, sampled by the three estimators at , are , 5.5, and 8 Mpc, respectively.
In the left panel of Fig. 8, we plot the distribution of the log(1+), log(1+), and log(1+) (from the left to the right panel) for post-starburst galaxies, and for quiescent and star-forming galaxies (from bottom to the top panel). The distribution of the 10k-parent sample is overplotted for each class of galaxy (dashed line). The black circles indicate the respective ratio of each class of galaxies to the 10k-parent population as a function of the three environmental estimators computed in three equally-populated bins of galaxies.
The bottom panel of Fig. 8 shows a deficit of post-starburst galaxies with low values of overdensities (2% with log(1+)) that increases to 5% for higher overdensities. Their distribution is shifted to higher overdensities than that of the 10k-parent population. This trend is supported by the low probability (at a significance level of more than ) that the two distributions are drawn from the same 10k-parent population. As expected, the fraction of quiescent galaxies also increases at higher overdensity values, illustrating their preference to reside in denser environments than the global population of galaxies (Fig. 8, middle panel). Using the spectroscopic definition described in Sect. 2.2, the fraction of quiescent galaxies doubles from 15% in underdense regions (log(1+)) to 30% in overdense regions (). The top panel of Fig. 8 shows the frequency of highly star-forming galaxies relative to the total number of the 10k-parent galaxies in different density regions. As demonstrated in detail by Cucciati et al. (2009), but see also Iovino et al. (2009) for the complex interplay between groups and galaxy properties, there is no significant correlation between the star-forming galaxies in zCOSMOS and their environment222The possible trend of a higher fraction of star-forming galaxies being in underdense environment when using the mass-weighted overdensities has been explored in Cucciati et al. (2009), but it disappears when using number densities (as employed here).. It is useful to note that the definition of star-forming galaxies in Cucciati et al. (2009) does not differ significantly from the one adopted in this work. A star-forming galaxy was defined in Cucciati et al. (2009) to be an object with a SFR higher than yr-1, calibrated using the [OII] luminosity following Moustakas et al. (2006).
Globally, the distributions of both star-forming and quiescent galaxies have a low probability (at ) of being drawn from the same 10k-parent population.
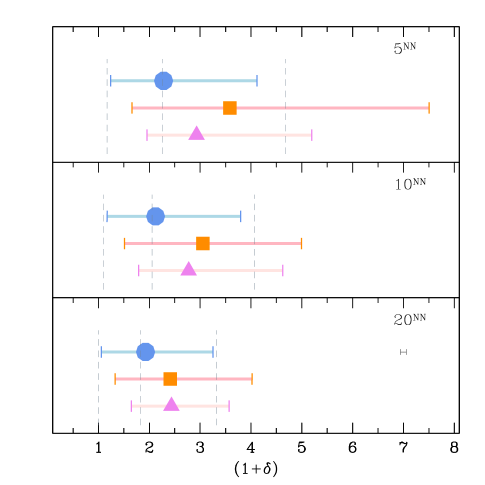
In the right panel of Fig. 8, we plot the median values of the three estimators for all the samples (post-starburst with violet-coded triangles, quiescent with orange squares, and star-forming galaxies with blue circle symbols). The first () and fourth () quartiles of each distribution are plotted to show the range in density of each population. By dashed, vertical lines, we indicate the corresponding statistical values of the 10k-parent catalogue. The typical error bar for environmental quantities in our galaxy samples is obtained by a resampling technique and plotted in the bottom right panel of Fig. 8. The representation of median values and the distribution of the central quartiles confirm also that quiescent and post-starburst galaxies reside in an overdense environment with respect to 10k-parent galaxies. We note that this environmental dependence is observed on different physical scales for both galaxy types with a statistically significance of more than 3 level, and that in addition this dependence in quiescent galaxies is stronger on progressively smaller physical scales. On the other hand, star-forming galaxies do not appear to reside in significantly different environments from the 10k-parent galaxies on all physical scales (from 8 Mpc down to Mpc).
We are now able to investigate the impact of the environment probed on group physical scales, on the properties of post-starburst galaxies. Using the optically selected sample of group galaxies by Knobel et al. (2009), we measured and compared the fraction of galaxies in each class identified as group members. In computing these fractions, we accounted for the redshift dependence of the group richness by using an effective richness (see for details Knobel et al. 2009).
Using the 10k catalogue of groups with a group defined to have either two or more than three members, post-starburst galaxies do not appear to exist preferentially in a group environment; the fraction of post-starburst galaxies in groups is comparable to that of star-forming galaxies (%) and lower than that of quiescent galaxies (using COR selection criteria). Using the more conservative criterion on mass completeness, i.e., selecting only galaxies more massive than log(), we observe that the fractions of star-forming and post-starburst galaxies in groups increase, and become similar to that of quiescent galaxies (%).
We note that the majority of both post-starburst and quiescent galaxies residing in groups have an early-type morphology (% and %, respectively), compared to % for the star-forming galaxies in sample COR. However, for smaller numbers of objects, similar values are found for sample ST, which support these findings.
Based on these results, we conclude that although post-starburst galaxies are found preferentially in overdense environments on typical scales of clusters and above, they also exist in groups and in the field. Given the results for the typical galaxy environment using nearest neighbours estimators and group catalogues, we found that on average galaxies prefer physical scales of Mpc, i.e., overdense environments similar to that of quiescent galaxies. We also identified post-starburst galaxies in groups (thus on physical scales smaller than Mpc), although they tend to share a group environment more similar to that of star-forming galaxies. Given that during the short interval of the post-starburst phase ( Gyr), a galaxy cannot be transported from an under- to an overdense environment, our results imply that the spectral features are produced by a series of mechanisms among the several proposed in the past and not necessarily related only to environment.
Similar results were obtained by Poggianti et al. (2009) at using the ESO Distant Cluster Survey, who robustly proved the higher incidence of galaxies in high density environments (in clusters and in groups with a low fraction of [OII] emitters) than in the field, and pointed out that several different processes can produce a spectrum. In contrast, Yan et al. (2009) in their study of DEEP2 data found a higher fraction of post-starburst galaxies in field rather than group environments at 1 significance level. We also note that galaxies in our groups may have a wide range of physical properties. This scatter in physical properties reflects the environmental dependence of post-starburst galaxies (e.g., Poggianti et al. 2006). As shown in detail by Poggianti et al. (2009), galaxies in groups with a low (or high) fraction of [OII] emitters have higher (lower) dependencies on environment. Finally, both merging or/and accretion events, and cluster-related mechanisms such as ram-pressure gas stripping, harassment, or strangulation, are efficient in suppressing star-formation activity in a galaxy. Multiple possible origins of galaxies have been proposed and we indeed confirm that a wide range of origins is likely.
3.5 Contribution to the mass assembly and spectral properties
The incidence of post-starburst galaxies in the general galaxy population varies between authors, depending on the environment studied, redshifts, selection methods, and properties of the various surveys. In cluster environments and at intermediate redshift, the fraction of post-starburst galaxies varies from high values, e.g., % (Dressler & Gunn 1983; Dressler et al. 1999; Dressler & Gunn 1992; Tran et al. 2003, 2004, 2007; Poggianti et al. 1999), to intermediate values (e.g., 10%, Poggianti et al. 2009), to very low values (% by Balogh et al. (1999); Yan et al. (2009)) both in the field and cluster environment at intermediate redshift. At lower redshifts, post-starburst galaxies are rare (Zabludoff et al. 1996; Blake et al. 2004; Goto 2007) and reside mostly in the field. It is clearly difficult to compare these galaxy results for parent samples selected from different environments and cosmic times and compiled with different selection criteria. We therefore established our own internal means of assessing the contribution of galaxies to galaxy stellar mass assembly and galaxy evolution in general.
We found a number density of post-starburst galaxies of Mpc-3 and a mass density of Mpc-3 over the redshift range . The errors were estimated using resampling techniques: we estimate the sample statistics using all galaxies, then remove one point at a time to estimate . We found no statistically significant evolution with redshift in either the number or mass densities of post-starburst galaxies, but given the limited number of galaxies in each redshift bin ( 10) a more solid conclusion will be drawn at the completion of the survey.
To establish the impact of the galaxy population on galaxy evolution, we estimated the total mass flux that enters the red sequence after a ( Gyr) quenching of the star-formation activity. We followed the method of Martin et al. (2007) who introduced this parameter in their study of SDSS/GALEX red and blue galaxies defined with NUV-r colours, which was subsequently used in other works, e.g., by Arnouts et al. (2007) on a SWIRE-VVDS-CFHTLS data set. We defined the flow in stellar mass by post-starburst galaxies that contribute to the red-sequence mass assembly as
| (1) |
where is the stellar mass in solar masses of galaxies in the sample COR, is the selection function ( and as introduced in Sect. 2.5), and is the maximum volume in which each galaxy of a given magnitude is still observable. We assume that the spectroscopic features are detectable for Gyr, or 1 Gyr. Our galaxies correspond to a mass flux entering the red-sequence of Mpc-3 yr-1 (or a contribution of % to the growth rate of the red-sequence estimated to be dM/dt Mpc-3 yr-1 by Pozzetti et al. (2009) and assuming Gyr, or % with Gyr). Of course, these values are in agreement with the assumption that galaxies remain on the red-sequence and any process of re-juvenation such as those proposed by Hasinger (2008), are at work.
Results from the GDDS obtained by Le Borgne et al. (2006) showed that galaxies with strong H absorption (H strong galaxies, or HDSs) decrease with cosmic time (from about 50% at to a few percent today). However, they detected only one or two post-starburst galaxies among the 25 HDSs (depending on how their error bars were treated). A strong evolution in the number density of post-starburst galaxies was found by Wild et al. (2009) (a factor of 200 higher at than in the local Universe by Quintero et al. (2004)), but on the basis of 5 post-starburst galaxies selected only with a quite conservative definition in the VVDS-F02 catalogue. Based on that sample, Wild et al. (2009) estimated that post-starburst galaxies can account for % of the growth in the red sequence in the field at . Instead, De Lucia et al. (2009) estimated that the post-starburst phase is not the dominant channel that moves galaxies from the blue star forming cloud to the red sequence in clusters at .
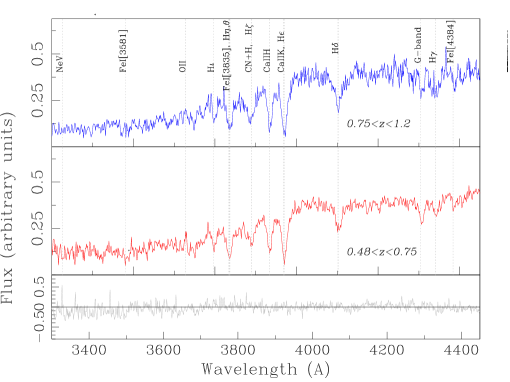
We now investigate the possible evolution in the spectral properties of our post-starburst galaxies. We use spectra of post-starburst galaxies (in sample COR) at high redshift () and low redshift (). In the three panels of Fig. 9, we show from top to bottom the composite spectra of post-starburst galaxies (in sample COR) at high redshift, low redshift, and the difference between them. The redshift bins are chosen to include a comparable number of post-starburst galaxies (40 spectra at low , and 28 at high ), although the spectra are weighted using our selection function before the combination. The median redshifts of the two composite spectra are and at low and high redshifts, respectively. We shifted our spectra to the galaxy rest-frame defined by their spectroscopic redshifts, and normalized them to the common region around 4100–4700 sampled in each spectrum. To each spectrum, we applied the weighting approach described in Sect. 2.5 obtaining a composite spectrum with a median combination.
We do not observe any significant difference between the spectral properties of post-starburst galaxies at and . The continuum of the difference spectrum is centred on zero at all wavelengths (apart from at very blue , where the difference reaches 5%). It is, however, true that there is not a very large difference in redshift between these two spectra, so negligible evolution given the uncertainty levels, may not be a surprising result.
4 Discussion
A number of studies have explored the physical properties and the relative importance of galaxies, i.e., galaxies with strong Balmer absorption lines (which are indicative of an intense star-formation epoch in the past billion years) and an absence of emission lines (a signature of lack of ongoing star formation). Even considering the different numbers cited in the literature about the incidence of galaxies among the entire galaxy population, and their apparent or true evolution in number density (which has not been confirmed in this work), they represent a minor constituent of the galaxy population in the Universe in the past 8 Gyr. These systems are physically interpreted as galaxies that have had their star formation abruptly quenched in the past billion years and subsequently migrated onto the red sequence. Thus, the importance of this galaxy population depends on its role in creating the red sequence, or in stellar mass assembly in general. Other important issues are the mechanism/s responsible for the abrupt quenching of star formation in their progenitors and the true nature of their descendants.
We have completed an analysis of high quality spectral data provided by zCOSMOS and ancillary data available for the COSMOS field of the first mass-selected sample of 69 galaxies in a wide range of environments at intermediate redshift ().
Alternative explanations of why galaxies appear to be transient objects have also been considered. Using 1.4 GHz radio and X-ray data, we have confirmed that our galaxies are unlikely to be strongly star-forming galaxies affected significantly by dust extinction and only a fraction of them may be obscured AGNs. We have also considered another concern that Balmer line strengths might be generated by some other hot population than the main-sequence turn-off stars, e.g., blue stragglers (e.g., Rose 1985, 1994) or blue horizontal branch stars (e.g., Burstein et al. 1984; Maraston & Thomas 2000; Trager et al. 2005).
In this work, we adopted a conventional definition in selecting galaxies. Although H is a robust indicator of star formation, it falls out of the optical window at intermediate redshifts and bluer diagnostics are used in assessing the star-formation activity of the post-starburst galaxy population. Yan et al. (2006) reported on the incompleteness introduced in using [OII] to identify galaxies, a criterion that could unfairly eliminate post-starburst galaxies with AGN activity. This is because the [OII] emission line is sensitive to both the star formation and AGN activity in a galaxy, and by including galaxies on the basis of the lack of an [OII] emission line, we are a priori also removing those with an AGN contribution. However, we followed the classical approach of using the [OII] diagnostic instead of the H line proposed by Yan et al. (2009), because H is a far weaker line than [OII] which can increase the uncertainty in e.g., the stellar continuum fit, and is affected by both emission and absorption. Thus, in this paper we adopt the conventional definition that involves both the [OII] emission line and H, to maximize the comparison with the majority of other works. Any impact of the galaxy population in a general context of galaxy evolution may be slightly greater than quantified here. Our incompleteness should however be minimal because the duty cycle ( yr, e.g., Condon et al. 1992) of a possible AGN in our galaxies represents a short period in the lifetime of a galaxy.
We note that any comparison with external results is possible only qualitatively, while a more objective analysis is feasible with internal comparisons within a given catalogue as pointed out by several authors. We followed this approach in our work by objectively comparing our results on galaxies with star-forming and quiescent galaxy mass-selected samples defined using spectroscopic criteria and with 10k-parent mass-selected galaxies, all extracted from the zCOSMOS bright program. The results obtained in this work are robust and corrected for effects of incompleteness.
We explored the physical properties of galaxies in terms of stellar mass, mass-to-light ratio, colour, morphology, and environment. We found that our galaxies are as massive as quiescent galaxies, but have relatively lower mass-to-light ratio and bluer colours, which ensure that they are potential contributors to the red sequence and ideal occupants of the green valley, i.e., the underpopulated region in-between the distribution of star-forming/blue galaxies and quiescent/red galaxies. We confirmed that morphologically zCOSMOS galaxies are a heterogeneous population of bulge- and disc-dominated galaxies, which become predominantly more bulge-dominated at increasing stellar mass. Despite the high incidence of asymmetries indicative of recent interaction events, our morphological results have demonstrated that not all progenitors of our galaxies are spheroidals as expected if a major merger had destroyed the disc.
Our finding that 50% of our population are passive spiral galaxies (but depending on stellar mass) and the knowledge that in distant clusters, galaxies are found to have predominantly spiral morphologies (e.g., by Dressler et al. 1999; Poggianti et al. 1999) is consistent with the timescale for morphological transformation being longer than that for the transformation in spectral properties. However, because of their high stellar masses and the large spread in their colours in the green valley, star formation in at least a fraction of galaxies may be periodically triggered by the rapid accretion of outer fresh material (as e.g., proposed by the re-juvenation hypothesis of Hasinger (2008)). Given that galaxies are found in a wide range of environments (from field to cluster scales), the mechanisms quenching star formation in galaxy progenitors and their descendants might both be diverse. Summarizing, the results obtained in the present work provides good support to the common interpretation for galaxies that they may represent a transient phase between star-forming and a quiescent stage of star-formation activity, but their subsequent evolution may be to a wide range of galaxy classes by means of many different evolutionary paths.
It is important to determine the way in which star formation is controlled and truncated in a galaxy. Star formation can experience a gradual decrease as would be consistent for example with the smooth decline in redshift () of the star formation rate, or star formation can be suddenly and violently extinguished. Given that the spectra of galaxies imply that they have had their star formation truncated suddenly in the recent past, measuring their number and mass density can help us to quantify the significance of such phenomenon in suppressing the global star formation rate. galaxies have abruptly quenched their star formation activity on a timescale shorter than a billion years, therefore their contribution represents a lower limit to the prevalence of such sudden quenching. The decline in the star formation activity in galaxies is understood to have occurred gradually with cosmic time in the past 8 Gyr, although its dependence on the stellar mass remains controversial, e.g., compare Zheng et al. (2007) and Drory & Alvarez (2008). We computed the contribution of galaxies to the mass assembly of the red-sequence in the conservative hypothesis that they remain on the red-sequence. This contribution to the growth rate of the red-sequence has been found to be in the range between 3% and 8% depending on the assumed timescale of the characteristic detectability of spectroscopic features. Considering a number of possible underestimation effects such as e.g., the removal of galaxies with obscured AGNs and the non-detection of objects because of the insufficient signal-to-noise ratio of the spectra, we conclude that although the galaxy population is not the primary contributor to the red sequence, it might not be negligible in the general context of galaxy evolution. Although sudden truncations of the star formation activity appear not to be more prevalent than smoother declines in the redshift interval , they are probably still important. In addition, a lack of sufficient temporal resolution in the star formation history cannot prevent us from speculating that the star formation might occur in episodes of moderate intensity separated by short quiescent phases as observed in nearby dwarf galaxies in which the resolved stellar populations can be studied in great detail (Tolstoy et al. 2009). In this scenario, the spectral features are common in the life of each galaxy, but observed only in a small fraction of the entire galaxy population given their short lifetime.
5 Conclusions
We have explored the physical properties of the first mass-selected sample of galaxies at intermediate redshift () in a wide range of environments. We selected this galaxy population, interpreted to represent a link between star-forming/blue galaxies and quiescent/red galaxies, from the spectroscopic program zCOSMOS related to the largest multiwavelength survey completed to date, COSMOS.
Our results can be summarized as follows:
-
1.
galaxies occupy the brightest tail of the luminosity distribution. They can be as massive as typical quiescent galaxies and populate the so-called “green valley” in the colour versus luminosity (or stellar mass) distribution.
-
2.
A fraction (%) of these galaxies have radio and/or X-ray counterparts implying an upper limit to the SFR of yr-1. These results suggest a possible contribution from obscured AGNs.
-
3.
galaxies morphologically represent a heterogeneous population with a similar incidence of bulge-dominated and disky galaxies, independent of the strength of their H absorption line, but dependent on stellar mass in a way reminiscent of the well-known mass-morphology relation (i.e., the most massive post-starburst galaxies are predominantly bulge-dominated systems). We reported a high incidence of asymmetries in HST/ACS images, supporting the hypothesis that these galaxies have experienced interaction/merger processes in their recent past, although we are unable to ascertain whether these processes are entirely responsible for the quenching of the galaxy star-formation activity.
-
4.
galaxies reside preferentially in quite rich environments on physical scales of Mpc and have morphological early-to-late type ratios in groups that are similar to those of quiescent galaxies, although we also found galaxies in underdense regions. We concluded that several different mechanisms, not necessarily related to a specific environment, quench star-formation activity in galaxies on short timescales ( Gyr).
-
5.
We measured a number density of galaxies of Mpc-3 and a mass density of Mpc-3 over the redshift range . With the current data set, we did not find statistical evolution in either any of the aforementioned quantities in the redshift interval explored, nor by comparison with the local values of Quintero et al. (2004). We were also unable to determine any evolution in the spectral properties between and .
-
6.
We studied the contribution of galaxies to the mass assembly of the red-sequence. This contribution can be as high as % ( Mpc-3 yr-1) given a growth rate in the red-sequence of dM/dt Mpc-3 yr-1 (as estimated by Pozzetti et al. 2009 for the same data) and assuming a detectability of spectroscopic features of Gyr. Although galaxies may not be the primary source of growth to the red sequence, they are likely to be important to galaxy evolution. Furthermore, sudden truncations in star formation do not appear to be the primary means of quenching the star formation activity compared to more gradual means, but appear nevertheless to be important to the decline in the global star formation activity. On the other hand, lacking sufficient temporal resolution, we cannot exclude the scenario where the sudden quenching of star formation and the regime in which the star formation occurs in episodes of moderate intensity separated by short quiescent phases are the rule in general galaxy evolution. It is worth noting indeed that in nearby dwarf galaxies when the resolved stellar populations are studied in great detail, the star formation history of these galaxies appears to consist of repeated periods of star formation (Tolstoy et al. 2009). More solid results on this and other subjects will be obtained using the larger 20k zCOSMOS sample.
6 Acknowledgments
This work has been supported in part by the grant ASI/COFIS/WP3110 I/026/07/0. We thank the referee for providing constructive comments.
References
- Arnouts et al. (2007) Arnouts, S., Walcher, C. J., Le Fèvre, O., et al. 2007, A&A, 476, 137
- Balogh et al. (2005) Balogh, M. L., Miller, C., Nichol, R., Zabludoff, A., & Goto, T. 2005, MNRAS, 360, 587
- Balogh & Morris (2000) Balogh, M. L. & Morris, S. L. 2000, MNRAS, 318, 703
- Balogh et al. (1999) Balogh, M. L., Morris, S. L., Yee, H. K. C., Carlberg, R. G., & Ellingson, E. 1999, ApJ, 527, 54
- Barger et al. (1996) Barger, A. J., Aragon-Salamanca, A., Ellis, R. S., et al. 1996, MNRAS, 279, 1
- Barnes & Hernquist (1992) Barnes, J. E. & Hernquist, L. 1992, ARA&A, 30, 705
- Bell et al. (2003) Bell, E. F., McIntosh, D. H., Katz, N., & Weinberg, M. D. 2003, ApJS, 149, 289
- Blake et al. (2004) Blake, C., Pracy, M. B., Couch, W. J., et al. 2004, MNRAS, 355, 713
- Bolzonella et al. (2009) Bolzonella, M., Kovač, K., Pozzetti, L., et al. 2009, ArXiv e-prints 0907.0013
- Bondi et al. (2008) Bondi, M., Ciliegi, P., Schinnerer, E., et al. 2008, ApJ, 681, 1129
- Borch et al. (2006) Borch, A., Meisenheimer, K., Bell, E. F., et al. 2006, A&A, 453, 869
- Bower et al. (1998) Bower, R. G., Kodama, T., & Terlevich, A. 1998, MNRAS, 299, 1193
- Brinchmann et al. (2004) Brinchmann, J., Charlot, S., White, S. D. M., et al. 2004, MNRAS, 351, 1151
- Brinchmann & Ellis (2000) Brinchmann, J. & Ellis, R. S. 2000, ApJ, 536, L77
- Brusa et al. (2009) Brusa et al. 2009, in prep.
- Bundy et al. (2006) Bundy, K., Ellis, R. S., Conselice, C. J., et al. 2006, ApJ, 651, 120
- Burstein et al. (1984) Burstein, D., Faber, S. M., Gaskell, C. M., & Krumm, N. 1984, ApJ, 287, 586
- Caldwell & Rose (1997) Caldwell, N. & Rose, J. A. 1997, AJ, 113, 492
- Caldwell et al. (1999) Caldwell, N., Rose, J. A., & Dendy, K. 1999, AJ, 117, 140
- Cappelluti et al. (2009) Cappelluti et al. 2009, in prep.
- Cayatte et al. (1990) Cayatte, V., van Gorkom, J. H., Balkowski, C., & Kotanyi, C. 1990, AJ, 100, 604
- Chabrier (2003) Chabrier, G. 2003, PASP, 115, 763
- Chang et al. (2001) Chang, T.-C., van Gorkom, J. H., Zabludoff, A. I., Zaritsky, D., & Mihos, J. C. 2001, AJ, 121, 1965
- Charlot & Fall (2000) Charlot, S. & Fall, S. M. 2000, ApJ, 539, 718
- Condon (1992) Condon, J. J. 1992, ARA&A, 30, 575
- Conselice et al. (2000) Conselice, C. J., Bershady, M. A., & Jangren, A. 2000, ApJ, 529, 886
- Couch et al. (1994) Couch, W. J., Ellis, R. S., Sharples, R. M., & Smail, I. 1994, ApJ, 430, 121
- Couch & Sharples (1987) Couch, W. J. & Sharples, R. M. 1987, MNRAS, 229, 423
- Cucciati et al. (2009) Cucciati et al. 2009, submitted to A&A
- De Lucia & Blaizot (2007) De Lucia, G. & Blaizot, J. 2007, MNRAS, 375, 2
- De Lucia et al. (2009) De Lucia, G., Poggianti, B. M., Halliday, C., et al. 2009, MNRAS, 1379
- Dewangan et al. (2000) Dewangan, G. C., Singh, K. P., Mayya, Y. D., & Anupama, G. C. 2000, MNRAS, 318, 309
- Dressler & Gunn (1983) Dressler, A. & Gunn, J. E. 1983, ApJ, 270, 7
- Dressler & Gunn (1992) Dressler, A. & Gunn, J. E. 1992, ApJS, 78, 1
- Dressler et al. (1994) Dressler, A., Oemler, A. J., Sparks, W. B., & Lucas, R. A. 1994, ApJ, 435, L23
- Dressler et al. (1999) Dressler, A., Smail, I., Poggianti, B. M., et al. 1999, ApJS, 122, 51
- Drory & Alvarez (2008) Drory, N. & Alvarez, M. 2008, ApJ, 680, 41
- Elvis et al. (2009) Elvis, M., Civano, F., Vignali, C., et al. 2009, ApJS, 184, 158
- Fontana et al. (2004) Fontana, A., Pozzetti, L., Donnarumma, I., et al. 2004, A&A, 424, 23
- Franx (1993) Franx, M. 1993, ApJ, 407, L5
- Franzetti et al. (2007) Franzetti, P., Scodeggio, M., Garilli, B., et al. 2007, A&A, 465, 711
- Georgakakis et al. (2008) Georgakakis, A., Nandra, K., Yan, R., et al. 2008, MNRAS, 385, 2049
- Giovanelli & Haynes (1985) Giovanelli, R. & Haynes, M. P. 1985, ApJ, 292, 404
- Goto (2005) Goto, T. 2005, MNRAS, 357, 937
- Goto (2007) Goto, T. 2007, MNRAS, 377, 1222
- Goto & SDSS collaboration (2003) Goto, T. & SDSS collaboration. 2003, in Bulletin of the American Astronomical Society, Vol. 35, Bulletin of the American Astronomical Society, 1249
- Gunn & Gott (1972) Gunn, J. E. & Gott, J. R. I. 1972, ApJ, 176, 1
- Hammer et al. (1997) Hammer, F., Flores, H., Lilly, S. J., et al. 1997, ApJ, 481, 49
- Hasinger (2008) Hasinger, G. 2008, A&A, 490, 905
- Hopkins et al. (2007) Hopkins, P. F., Bundy, K., Hernquist, L., & Ellis, R. S. 2007, ApJ, 659, 976
- Iovino et al. (2009) Iovino et al. 2009, ArXiv e-prints 0909.1951
- Kauffmann et al. (2003a) Kauffmann, G., Heckman, T. M., White, S. D. M., et al. 2003a, MNRAS, 341, 33
- Kauffmann et al. (2003b) Kauffmann, G., Heckman, T. M., White, S. D. M., et al. 2003b, MNRAS, 341, 54
- Kaviraj et al. (2007) Kaviraj, S., Kirkby, L. A., Silk, J., & Sarzi, M. 2007, MNRAS, 382, 960
- Kim et al. (2009) Kim et al. 2009, in prep.
- Knobel et al. (2009) Knobel, C., Lilly, S. J., Iovino, A., et al. 2009, ApJ, 697, 1842
- Koekemoer et al. (2007) Koekemoer, A. M., Aussel, H., Calzetti, D., et al. 2007, ApJS, 172, 196
- Koopmann & Kenney (2004) Koopmann, R. A. & Kenney, J. D. P. 2004, ApJ, 613, 866
- Kovač et al. (2009) Kovač, K., Lilly, S. J., Cucciati, O., et al. 2009, ArXiv e-prints 0903.3409
- Lamareille et al. (2006) Lamareille, F., Contini, T., Le Borgne, J.-F., et al. 2006, A&A, 448, 893
- Larson et al. (1980) Larson, R. B., Tinsley, B. M., & Caldwell, C. N. 1980, ApJ, 237, 692
- Le Borgne et al. (2006) Le Borgne, D., Abraham, R., Daniel, K., et al. 2006, ApJ, 642, 48
- Lilly et al. (2007) Lilly, S. J., Le Fèvre, O., Renzini, A., et al. 2007, ApJS, 172, 70
- Lilly et al. (2009) Lilly, S. J., LeBrun, V., Maier, C., et al. 2009, ApJS, 184, 218
- Liu & Kennicutt (1995) Liu, C. T. & Kennicutt, Jr., R. C. 1995, ApJS, 100, 325
- Maraston & Thomas (2000) Maraston, C. & Thomas, D. 2000, ApJ, 541, 126
- Martin et al. (2007) Martin, D. C., Wyder, T. K., Schiminovich, D., et al. 2007, ApJS, 173, 342
- Meneux et al. (2009) Meneux, B., Guzzo, L., de la Torre, S., et al. 2009, ArXiv e-prints 0906.1807
- Mignoli et al. (2009) Mignoli, M., Zamorani, G., Scodeggio, M., et al. 2009, A&A, 493, 39
- Miller & Owen (2002) Miller, N. A. & Owen, F. N. 2002, AJ, 124, 2453
- Miyaji et al. (2008) Miyaji, T., Griffiths, R. E., & C-COSMOS Team. 2008, in AAS/High Energy Astrophysics Division, Vol. 10, AAS/High Energy Astrophysics Division
- Moustakas et al. (2006) Moustakas, J., Kennicutt, Jr., R. C., & Tremonti, C. A. 2006, ApJ, 642, 775
- Norton et al. (2001) Norton, S. A., Gebhardt, K., Zabludoff, A. I., & Zaritsky, D. 2001, ApJ, 557, 150
- Poggianti et al. (2009) Poggianti, B. M., Aragón-Salamanca, A., Zaritsky, D., et al. 2009, ApJ, 693, 112
- Poggianti et al. (2001) Poggianti, B. M., Bressan, A., & Franceschini, A. 2001, ApJ, 550, 195
- Poggianti et al. (1999) Poggianti, B. M., Smail, I., Dressler, A., et al. 1999, ApJ, 518, 576
- Poggianti et al. (2006) Poggianti, B. M., von der Linden, A., De Lucia, G., et al. 2006, ApJ, 642, 188
- Pozzetti et al. (2007) Pozzetti, L., Bolzonella, M., Lamareille, F., et al. 2007, A&A, 474, 443
- Pozzetti et al. (2009) Pozzetti, L., Bolzonella, M., Zucca, E., et al. 2009, ArXiv e-prints 0907.5416
- Press et al. (1992) Press, W. H., Teukolsky, S. A., Vetterling, W. T., & Flannery, B. P. 1992, Numerical recipes in FORTRAN. The art of scientific computing (Cambridge: University Press, 1992, 2nd ed.)
- Quintero et al. (2004) Quintero, A. D., Hogg, D. W., Blanton, M. R., et al. 2004, ApJ, 602, 190
- Rose (1984) Rose, J. A. 1984, AJ, 89, 1238
- Rose (1985) Rose, J. A. 1985, AJ, 90, 1927
- Rose (1994) Rose, J. A. 1994, AJ, 107, 206
- Salim et al. (2005) Salim, S., Charlot, S., Rich, R. M., et al. 2005, ApJ, 619, L39
- Scarlata et al. (2007a) Scarlata, C., Carollo, C. M., Lilly, S., et al. 2007a, ApJS, 172, 406
- Scarlata et al. (2007b) Scarlata, C., Carollo, C. M., Lilly, S. J., et al. 2007b, ApJS, 172, 494
- Schinnerer et al. (2007) Schinnerer, E., Smolčić, V., Carilli, C. L., et al. 2007, ApJS, 172, 46
- Schmidt (1968) Schmidt, M. 1968, ApJ, 151, 393
- Scodeggio et al. (2005) Scodeggio, M., Franzetti, P., Garilli, B., et al. 2005, PASP, 117, 1284
- Scoville et al. (2007) Scoville, N., Aussel, H., Brusa, M., et al. 2007, ApJS, 172, 1
- Springel et al. (2005) Springel, V., Di Matteo, T., & Hernquist, L. 2005, MNRAS, 361, 776
- Tasca et al. (2009) Tasca, L. A. M., Kneib, J.-P., Iovino, A., et al. 2009, A&A, 503, 379
- Tolstoy et al. (2009) Tolstoy, E., Hill, V., & Tosi, M. 2009, ArXiv e-prints 0904.4505
- Toomre & Toomre (1972) Toomre, A. & Toomre, J. 1972, ApJ, 178, 623
- Trager et al. (2005) Trager, S. C., Worthey, G., Faber, S. M., & Dressler, A. 2005, MNRAS, 362, 2
- Tran et al. (2003) Tran, K.-V. H., Franx, M., Illingworth, G., Kelson, D. D., & van Dokkum, P. 2003, ApJ, 599, 865
- Tran et al. (2007) Tran, K.-V. H., Franx, M., Illingworth, G. D., et al. 2007, ApJ, 661, 750
- Tran et al. (2004) Tran, K.-V. H., Franx, M., Illingworth, G. D., et al. 2004, ApJ, 609, 683
- Tremonti et al. (2004) Tremonti, C. A., Heckman, T. M., Kauffmann, G., et al. 2004, ApJ, 613, 898
- Vergani et al. (2008) Vergani, D., Scodeggio, M., Pozzetti, L., et al. 2008, A&A, 487, 89
- Wild et al. (2009) Wild, V., Walcher, C. J., Johansson, P. H., et al. 2009, MNRAS, 395, 144
- Worthey & Ottaviani (1997) Worthey, G. & Ottaviani, D. L. 1997, ApJS, 111, 377
- Yan et al. (2009) Yan, R., Newman, J. A., Faber, S. M., et al. 2009, MNRAS, 398, 735
- Yan et al. (2006) Yan, R., Newman, J. A., Faber, S. M., et al. 2006, ApJ, 648, 281
- Yang et al. (2004) Yang, Y., Zabludoff, A. I., Zaritsky, D., Lauer, T. R., & Mihos, J. C. 2004, ApJ, 607, 258
- Yang et al. (2008) Yang, Y., Zabludoff, A. I., Zaritsky, D., & Mihos, J. C. 2008, ApJ, 688, 945
- Zabludoff et al. (1996) Zabludoff, A. I., Zaritsky, D., Lin, H., et al. 1996, ApJ, 466, 104
- Zheng et al. (2007) Zheng, X. Z., Bell, E. F., Papovich, C., et al. 2007, ApJ, 661, L41
- Zucca et al. (2009) Zucca, E., Bardelli, S., Bolzonella, M., et al. 2009, ArXiv e-prints 0909.4674