Resolving the Stellar Outskirts of M81:
Evidence for a Faint, Extended
Structural Component
111Based on data collected
at Subaru telescope, which is operated by the
National Astronomical Observatory of Japan.
Abstract
We present a wide field census of resolved stellar populations in the northern half of M81, conducted with Suprime-Cam on the 8-m Subaru telescope and covering an area square degrees. The resulting color-magnitude diagram reaches over one magnitude below the red giant branch (RGB) tip, allowing a detailed comparison between the young and old stellar spatial distributions. The surface density of stars with ages Myr is correlated with that of neutral hydrogen in a manner similar to the disk-averaged Kennicutt-Schmidt relation. We trace this correlation down to gas densities of , lower than typically probed with flux. Both diffuse light and resolved RGB star counts show compelling evidence for a faint, extended structural component beyond the bright optical disk, with a much flatter surface brightness profile. The star counts allow us to probe this component to significantly fainter levels than is possible with the diffuse light alone. From the colors of its RGB stars, we estimate this component has a peak global metallicity at deprojected radii 32 – 44 kpc assuming an age of 10 Gyr and distance of 3.6 Mpc. The spatial distribution of its RGB stars follows a power-law surface density profile, , with . If this component were separate from the bulge and from the bright optical disk, then it would contain of M81’s total V-band luminosity. We discuss the possibility that this is M81’s halo or thick disk, and in particular highlight its similarities and differences with these components in the Milky Way. Other possibilities for its nature, such as a perturbed disk or the faint extension of the bulge, cannot be completely ruled out, though our data disfavor the latter. These observations add to the growing body of evidence for faint, complex extended structures beyond the bright disks of spiral galaxies.
Subject headings:
galaxies: individual (M81) – galaxies: stellar content – galaxies: evolution – galaxies: structure1. Introduction
The stellar outskirts of spiral galaxies hold vital clues to their formation and evolution. Under the framework of the CDM cosmology, the halos of massive spiral galaxies arise largely from the merging and accretion of smaller sub-halos (Bullock & Johnston 2005). The stellar populations of spiral galaxy halos are, thus, directly linked to the properties of the sub-halos and the accretion history (e.g., Bullock & Johnston 2005; Font et al. 2006). Furthermore, the merging and accretion that is especially common in CDM at high redshift could be important in determining the properties of thick disks, which can dominate the total disk light at large radii and scale heights and which mounting evidence suggests are common in spiral galaxies (e.g., Abadi et al. 2003; Brook et al. 2004; Dalcanton & Bernstein 2002; Yoachim & Dalcanton 2006).
Observing the outskirts of spiral galaxies is challenging because these regions are very faint, typically at least several magnitudes below the sky level, or . Reliable surface brightness measurements at these faint levels require accurate flat-fielding, sky-determination, PSF modeling, and bright-star masking. Diffuse light studies of halos and thick disks are usually limited to edge-on systems in which the thin disk light can be minimized by looking away from the midplane. For example, by stacking the images of over 1000 edge-on galaxies in the Sloan Digital Sky Survey (SDSS), Zibetti et al. (2004) reached an -band surface brightness . They found a halo of excess emission around the stacked disk with an axis ratio of and projected intensity distribution , with . In a related study, Zibetti & Ferguson (2004) examined the extraplanar light distribution around a nearly edge-on disk galaxy in the Hubble Ultra Deep Field (HUDF) and found evidence for a halo with similar structural properties as the SDSS stacked halo. These structural properties are very similar to those of the Milky Way (MW) halo (Bell et al. 2008, and references therein), suggesting that such halos are common around disk galaxies. However, the colors of the stacked SDSS and HUDF halos were much redder than expected for typical halo populations, suggesting an unusual stellar initial mass function (IMF), very high metallicity, or significant scattered light from the disk (Zibetti et al. 2004; Zackrisson et al. 2006; de Jong 2008).
Studies of the diffuse light around galaxies have also revealed evidence that thick disks are common (e.g., Burstein 1979; Tsikoudi 1979; Shaw & Gilmore 1990; de Grijs & van der Kruit 1996; Morrison et al. 1997; Neeser et al. 2002). Dalcanton & Bernstein (2002) obtained optical and near-infrared images of many bulgeless edge-on disk galaxies reaching . From the color maps, vertical color gradients, and faint isophote shapes, they argued for the presence of red stellar envelopes around all their galaxies with surface brightnesses, spatial distributions, mean ages, and metallicities similar to the MW thick disk. The uniformity in these properties is surprising if they were assembled from satellites with different masses, gas fractions, histories, and orbital properties, as expected in some hierarchical structure formation models (e.g. Abadi et al. 2003; Brook et al. 2004). However, the ages and metallicities were very uncertain because of the unknown star formation histories, the shallow depth of the near-infrared images, and the inherent difficulties of sky-subtracting and flat-fielding in the infrared. Further analysis by Yoachim & Dalcanton (2008b, a) has indeed revealed a variety of thick disk kinematics and compositions amongst the low-mass galaxies in the Dalcanton & Bernstein (2002) sample. The properties of the higher-mass galaxies’ thick disks were more difficult to constrain because their thin disk light was too dominant in the regions with adequate signal.
The best current method to study the faint outer regions of galaxies is to resolve their stellar populations. This allows one to directly probe fainter surface brightness levels and to place tighter constraints on age and metallicity than is possible with diffuse light. For example, Mouhcine et al. (2005) studied a sample of nearby spiral galaxies with the Wide Field and Planetary Camera 2 (WFPC2) on board the Hubble Space Telescope (HST). They found the red giant branch (RGB) metallicity in the outskirts of these galaxies, as inferred from the colors of their RGB stars, to be positively correlated with galaxy luminosity, qualitatively consistent with theoretical expectations for stellar spheroids in CDM (Font et al. 2006) and monolithic collapse scenarios (Larson 1974). Their conclusions were complicated, however, by the small field-of-view of HST and the possibility of multiple populations along the line-of-sight. Indeed, when selected kinematically, halo stars in the three Local Group spirals do not show a significant correlation (Chapman et al. 2006; Kalirai et al. 2006; Ferguson et al. 2007; Mouhcine et al. 2007; McConnachie et al. 2006).
Ground-based, wide-field mapping of resolved stellar populations over large portions of nearby galaxies is an essential complement to pencil-beam HST-based studies. This approach is necessary for understanding their global structure, which may exhibit population gradients and inhomogeneities on a variety of scales. For example, the INT and MegaCam surveys of M31 (Ibata et al. 2001; Ferguson et al. 2002; Ibata et al. 2007) have revealed a giant stellar stream and multiple other substructures distributed throughout M31’s halo which are undetectable with diffuse light and most easily seen in the spatial distribution of RGB stars. These substructures have sizes and metallicity variations on scales much larger than HST’s field-of-view.
To place the most statistically significant constraints on theoretical galaxy formation models, we must increase the number of systems whose individual old and intermediate age stars have been resolved over large portions of their outer disks and halos. This means going beyond the Local Group, a task which has only recently become possible thanks to the advent of wide-field imagers on large telescopes (e.g. Bland-Hawthorn et al. 2005; Davidge 2008a, b). At a distance of 3.6 Mpc, corresponding to (Freedman et al. 1994), M81 is the nearest massive spiral like the MW and M31, yet it is still close enough to resolve its low-mass giant stars. With a Hubble morphological class of Sab and T-type of 2 (de Vaucouleurs et al. 1991), a total dynamical mass inside 20 kpc of , and peak circular rotation velocity (Gottesman & Weliachew 1975), M81 is similar in many respects to the MW and M31. It is therefore an essential system for testing our understanding of the formation of massive spirals.
M81 is also the largest member of the nearest interacting galaxy group. Its two brightest neighbors, M82 and NGC 3077, lie within a projected distance of 60 kpc. The disturbed nature of the system is most easily visible when observing the 21 cm emission line of neutral hydrogen. Maps of the HI content throughout the system show extended tidal streams and debris between the galaxies (Gottesman & Weliachew 1975; Yun et al. 1994). The computer simulation of Yun (1999) explains many of these tidal features as being the result of close encounters between M81 and each of its neighbors Myr ago. The stellar contents of the most prominent debris, Arp’s Loop and Holmberg IX (HoIX), have been studied with WFPC2 by Makarova et al. (2002) and with the Advanced Camera for Surveys (ACS) by de Mello et al. (2008), Sabbi et al. (2008), and Weisz et al. (2008). These authors concluded these objects may be tidal dwarf galaxies, new stellar systems that formed in gas stripped from interacting galaxies.
A few papers have examined the large-scale, young resolved stellar content around M81 (e.g. Durrell et al. 2004; Davidge 2008b, 2009). They identified several groupings of O-B stars and red supergiants which formed within the last Myr and which are located in M81’s spiral arms and tidal tails. In this paper, we present wide-field imaging of M81 obtained with the Suprime-Cam instrument on the 8-m Subaru telescope. Our data reach over one magnitude below the RGB tip. This limiting depth is fainter than previous ground-based data in M81, and enables a detailed, yet global view of both young and old stellar structure around this galaxy. We present evidence for a faint extended structural component beyond the bright optical disk whose overall structure and metallicity we can constrain because we resolve its stellar constituents. In §2, we outline the observations and data reduction and, in §3, we present the color-magnitude diagrams of point sources and non-M81 contaminants. We examine the 2-dimensional stellar spatial distribution in §4 and the radial surface brightness and stellar density profiles in §5. We discuss possible interpretations in §6 and summarize the results in §7.
Throughout this paper, we adopt for M81’s disk an inclination of , and position angle (measured N through E) of . At a distance of 3.6 Mpc, 1 arcmin 1 kpc in projection. The radius of the galaxy is 13.8 arcmin (de Vaucouleurs et al. 1991).
2. Observations and Data Reduction
The observations were obtained with the Suprime-Cam instrument (Miyazaki et al. 2002) on the 8-m Subaru telescope on the nights of January 7 – 8, 2005 (S04B, PI=N. Arimoto). This instrument consists of 10 CCDs of 2048x4096 pixels arranged in a 2x5 pattern, with a pixel scale of 0.2 arcsec and a total field of view of approximately 34x27 arcmin (including long edge inter-chip gaps of 16 – 17 arcsec and short edge gaps of 5 – 6 arcsec).
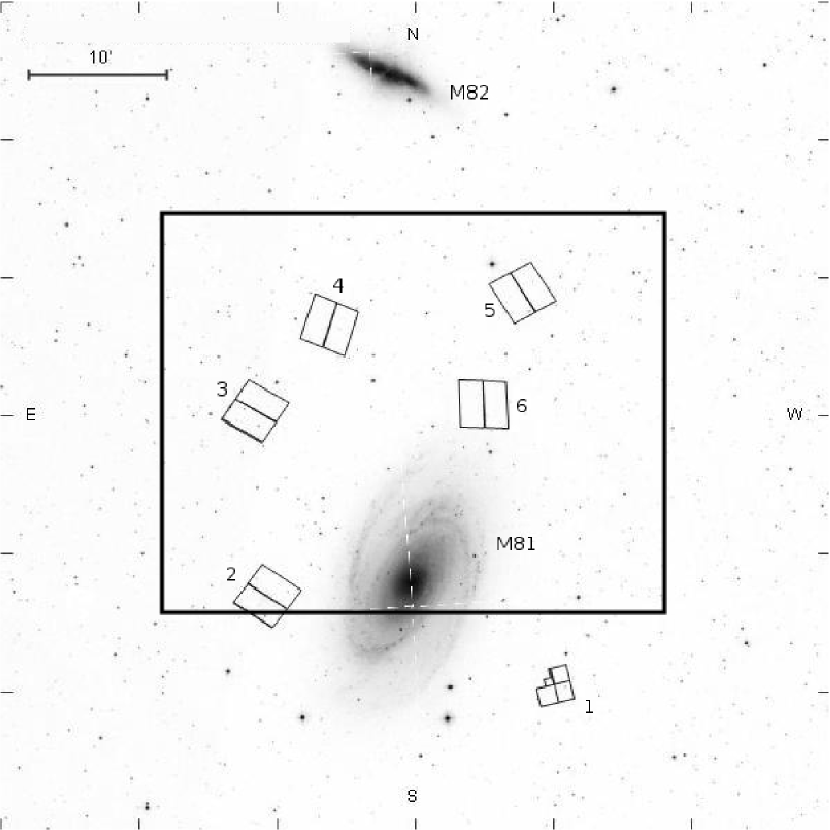
The original aim was to cover M81 using two field centers, one to the north and another to the south of its nucleus at . Weather conditions limited the amount of good-quality data obtained to the more northerly field centered at (J2000.0). The large rectangular box in Fig. 1 outlines the size and location of this field relative to M81, to M82, and to several other fields imaged with WFPC2 and ACS which are the most relevant to our current study of M81’s stellar outskirts. The HST fields are labeled 1 – 6 and were studied by (1) Tikhonov et al. (2005) and Mouhcine et al. (2005), (2) Sabbi et al. (2008) and Weisz et al. (2008), (3) de Mello et al. (2008), (4) and (5) de Jong et al. (2008), and (6) Williams et al. (2008).
We obtained a set of 10 images of M81 in the Johnson filter with individual exposure times of 630s on each night, and 20 images in the Sloan filter with exposure times of 215s on the night of Jan. 7th. All observations were recorded under non-photometric conditions through patchy thin cirrus. Comparison of expected throughput with subsequent calibration based on SDSS photometry for this region indicated that the average attenuation for these images was 10%. The set of 10 -band images obtained on Jan. 7th in relatively poor seeing () were later rejected from the analysis. The remaining -band images were taken in an average seeing of while the -band images had an average seeing of . To fill in the chip gaps and facilitate the removal of cosmic rays and bad pixels, individual images were dithered by arcsec, resulting in a mosaic with total field of view 36x28 arcmin. Flat-field and interchip gain variations were removed with master flats obtained by combining 12 and 11 twilight sky flats in the and filters, respectively. After flat-fielding, remaining large scale variations in dark sky level, measured directly from stacked dark sky images at several different positions obtained during this run, were less than 1% of sky. An -band fringe frame acquired from an earlier Suprime-Cam imaging run was used to help assess the degree of dark sky fringing present, but this was found to be negligible in our data, so this extra image processing step was not required.
After converting the raw data to multi-extension FITS format, all images and calibration frames were run through a variant of the data reduction pipeline developed for the INT Wide Field Survey 222http://www.ast.cam.ac.uk/w̃fcsur/. The main steps we used in producing a detected object catalogue, including background estimation, object detection, parameter estimation, and morphological classifcation, are described in more detail in Irwin (1985, 1997), Irwin & Lewis (2001), and Irwin et al. (2004). Here we present a brief overview of these steps.
Prior to deep stacking, catalogues were generated for each individual processed science image to both refine the astrometric calibration and asses the data quality. For astrometric calibration, we found that a Zenithal polynomial projection (Greisen & Calabretta 2002) provided a good prescription for the World Coordinate System (WCS) and included all the significant telescope radial field distortions. We used this in conjunction with a 6-parameter linear plate model per detector to define the required astrometric transformations. The 2MASS point source catalogue (Cutri 2003) was used for the astrometric reference system.
The individual image qualities were then assessed using the average seeing and ellipticity of stellar images, as well as sky level and sky noise determined from the object cataloging stage. As a result of this assessment, the set of V-band exposures taken on Jan. 7th, in much poorer seeing conditions, were not included in the final V-band stack. Images were stacked at the detector level using the updated WCS information to accurately align them with respect to a reference image. The background level in the overlap area between each stacked image and the reference was adjusted additively to compensate for sky variations during the exposure sequence and the final stack included seeing weighting, confidence (i.e. variance) map weighting, and clipping of cosmic rays.
Next, we generated detector-level catalogues from the stacked images and updated the WCS astrometry in the FITS image extensions prior to mosaicing all detectors together.333 Mosaicing the ensemble to form a single large image minimizes the impact of lower total effective exposure times in the overlap regions between detectors, particularly toward their edges. Residual astrometric errors over the whole stacked array were typically , greatly simplifying this process. Slight offsets in underlying sky level between the stacked detector images caused small (typically 0.1–0.2% of sky), but still visible, discontinuities in the final mosaics. These offsets were due to small color equation differences in the detectors and the relatively blue color of the twilight sky compared to dark sky and unresolved diffuse light from M81. We corrected these offsets iteratively by visual inspection of a 4x4 blocked version of the mosaics using a pre-assigned keyword in each relevant detector FITS extension designed for this purpose.
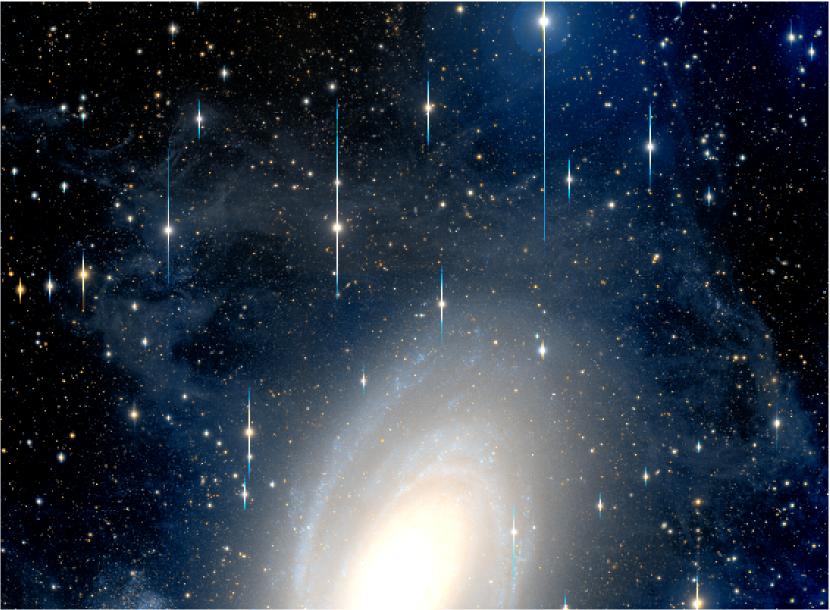
Fig. 2 shows a color composite image constructed from the and mosaics, where north is up and east is to the left. The image has a linear intensity scaling and a color mapping similar to that of Lupton et al. (2004) with for the blue channel, for red, and the average for green. The edges were cropped due to the slightly different field coverage in the final stacked mosaics.
The background light variation over these mosaics was rather complex and varied on relatively short angular scales. Therefore, as an alternative to our default method of background estimation and removal, we also used an independent method prior to cataloging in the crowded central region of M81. This step used a filter based on an iterative, non-linear unsharp masking and clipping algorithm to progressively remove fine details to a user-chosen scale length. An example of the benefits of this approach is shown in Fig. 1 of McConnachie et al. (2007), where complex background variations due, in that case, to scattered light were effectively removed. Comparison with photometry generated in a more conventional way demonstrated that even for the brightest unsaturated stars this aggressive filtering made less than 1% difference to their measured fluxes and had completely negligible effect on fainter stars. The significant advantages were that if this filtering step was run prior to mosaicing it obviated the need for detector-level adjustments and it greatly simplified subsequent object detection and flux estimation.
Object fluxes were estimated using “soft-edged” apertures of radius FWHM, which, for relatively uncrowded images, deliver 80-90% of the signal-to-noise of a perfect PSF fit in a fraction of the time (e.g., Irwin 1997; Naylor 1998). A significant portion of the detected objects in these images were background galaxies, for which aperture photometry was more useful than PSF-fitting. Therefore, a series of apertures ranging from 1/2 to 4 times the FWHM were additionally used as the basis for the morphological classification in a curve-of-growth analysis. We also used these apertures to compute stellar aperture corrections for the primary flux measure. The PSF varies in a rather subtle way over such wide-field images, and even though aperture photometry is not as sensitive to this variation as PSF-fitting, we still used the different aperture fluxes to check and correct for it.
Beyond M81’s bright optical disk, the typical object separation increases from at a deprojected radius arcmin to at arcmin. To mitigate the effects of crowding, which are more important at arcmin, the pipeline employed two extra refinements to the flux measurement. First, the object detection information for neighboring regions was used to flag those pixels corrupted by external groups of detected objects. Second, object fluxes from a pixel image blend of overlapping sources were solved for simultaneously via least-squares fitting of the aperture fluxes, i.e. equivalent to a top-hat shaped PSF, using fixed input coordinates. With this approach, bad pixels and regions of extremely low confidence were also readily flagged and avoided appropriately. Direct comparison of the pipeline-generated photometry with full PSF-fitting over a broad range of images for other projects has shown that in all but the most densely crowded regions, like the centers of globular clusters, similar quality results are achieved.
Due to the non-photometric observing conditions, we brought our flux measurements onto a Vega-like system (Johnson and Cousins ) by matching stars in our catalog with those in the SDSS, after applying the Lupton transformation equations provided on the SDSS website 444http://www.sdss.org/dr6/algorithms/sdssUBVRITransform.html. Only stars with photometric errors in the transformed system mag were used in the matching. The resulting photometric zero-point is accurate to mag, which is adequate for our study.
The final catalog contains 40,000 objects with stellar, or probable stellar, classifications in both passbands (hereafter referred to as point sources), meaning their image shape parameters lie within of the main stellar locus. Relaxing this criterion in makes little difference to our results, but relaxing it in actually increases contamination from unresolved background galaxies since the seeing in was significantly better. The morphological classification algorithm categorized objects as background galaxies, which we discuss in more detail below.
3. Color-Magnitude Diagram
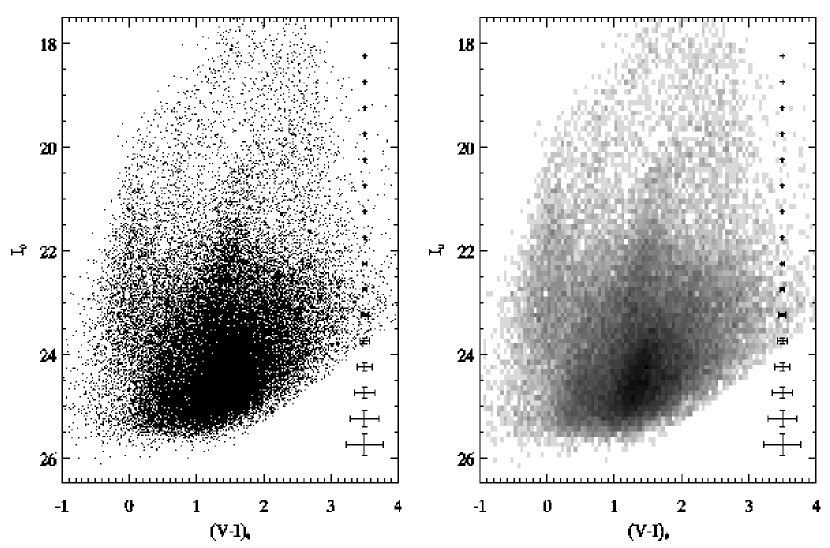
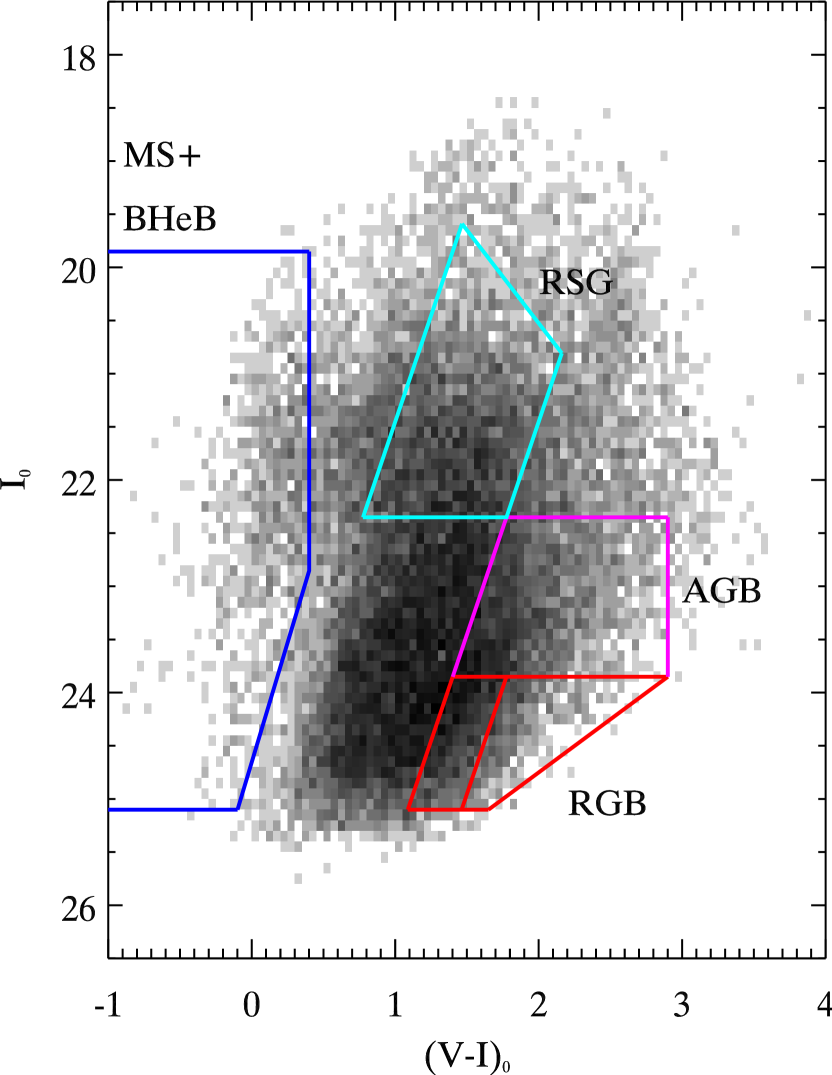
Fig. 3 shows the final point source catalog as a color-magnitude diagram (CMD) in the left panel and as a Hess diagram in the right panel. The Hess diagram is a 2-dimensional histogram showing the source density on a logarithmic intensity scaling. There are several clear stellar sequences visible, which we discuss in more detail below. On the right-hand side of each panel are the median photometric errors reported by the data reduction pipeline for all point sources in 0.5 mag-wide bins, where the color errors are the V- and -band errors added in quadrature. The median -band error is 0.1 at and at = 25 while the median color error is 0.1 at and at = 25.0. These errors reflect Poisson noise in the sources and the sky level. They do not account for systematic color and magnitude shifts or for correlated errors in both bands, which can occur in heavily crowded regions, but by restricting most of the point source analysis to M81’s outskirts, we do not expect this to be a serious issue. We also note that point sources are saturated at and .
The extinction maps of Schlegel et al. (1998) indicate a variable extinction across our field, with of point sources having values at least 0.01 mag in excess of the median (0.08) and a total range of 0.05 – 0.12. Henceforth, we apply extinction corrections on a star-by-star basis using the Schlegel et al. (1998) maps and Cardelli et al. (1989) extinction law, for which and . Schlegel et al. (1998) removed extragalactic objects from their maps down to a certain flux limit and replaced them with median values from the surrounding sky. By examining their mask maps, one can see that the inner arcmin in projected radius around M81 (including HoIX and part of Arp’s Loop) was indeed processed in this manner. Thus, the star-by-star correction does not include extinction internal to M81, but this should not be a serious problem since we focus on the RGB stars, which should be the least affected by internal extinction (Zaritsky 1999), and our CMD selection boxes (described below) are larger than the expected amount of internal extinction. For instance, the spectro-photometric study of M81’s diffuse light by Kong et al. (2000) found an average throughout M81’s bright optical disk, suggesting there may be mag of internal reddening within this region.
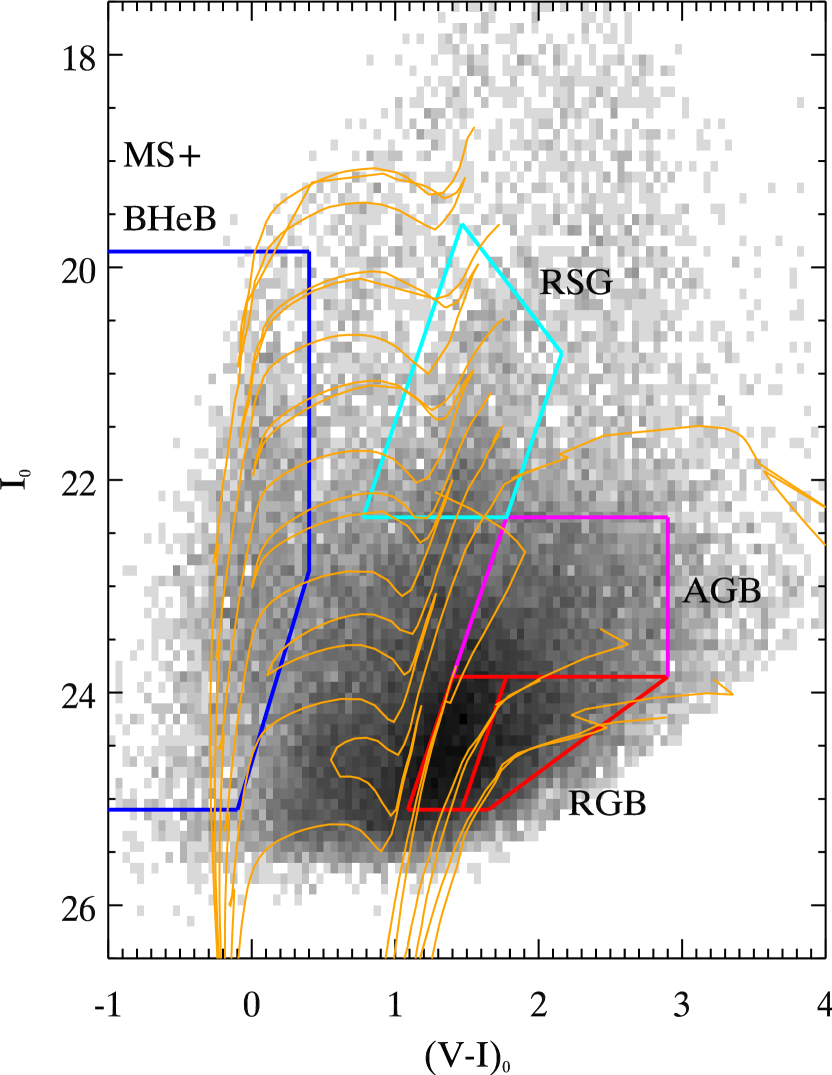
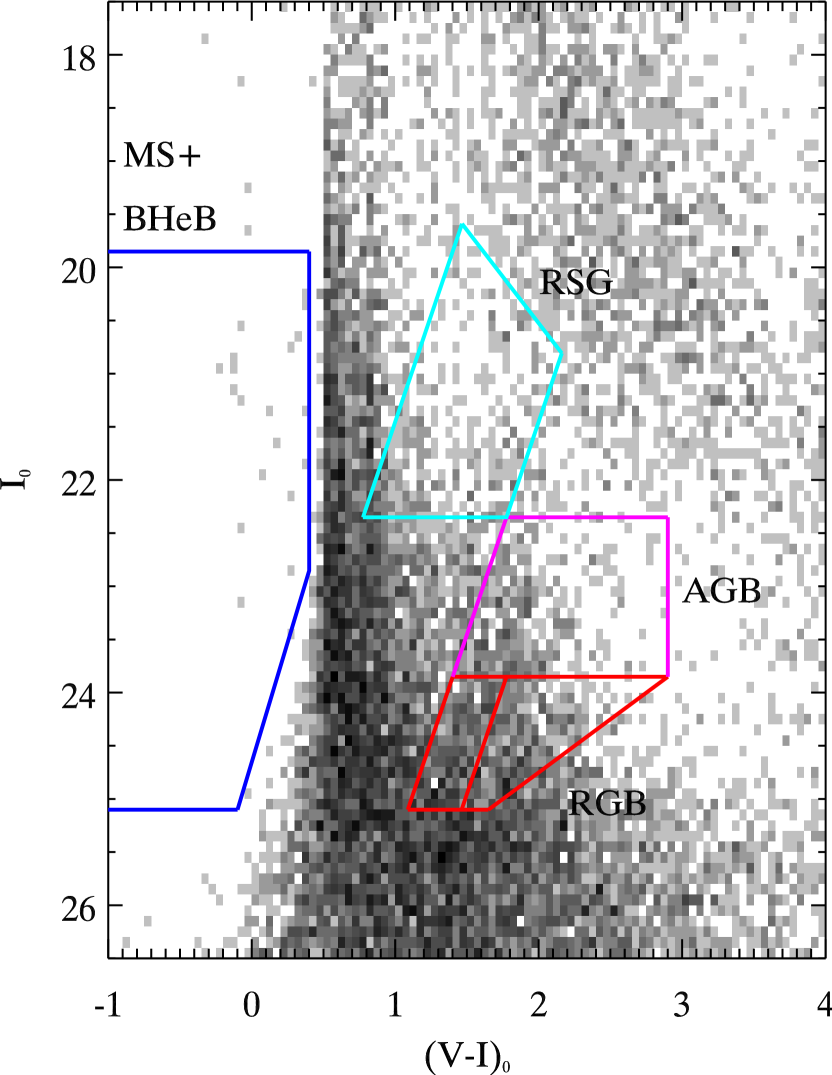
In Fig. 4, we show the point source Hess diagram overlaid with isochrones from Marigo et al. (2008) with the circumstellar dust option turned off. The young isochrones at have ages of 10.0, 17.8, 31.6, 56.2, 100, and 178 Myr and a metallicity [M/H] . We use this metallicity as a fiducial value because the young stars sampled by our field exist in a variety of environments with [M/H] ranging from to 0.0 (Zaritsky et al. 1994; de Mello et al. 2008; Sabbi et al. 2008; Davidge 2008b). The three old isochrones at have a common age of 10 Gyr and [M/H] = –1.3, –0.7, –0.4. The discontinuities in the asymptotic giant branch (AGB) are explained in Marigo et al. (2008) and are caused by changes in the opacity tables at the transition to the thermally pulsing phase.
In what follows, we will focus on several particular CMD regions (outlined in Fig. 4) which isolate stars in different evolutionary stages at M81’s distance. The blue lines in Fig. 4 mark the region occupied by main sequence stars Myr old and by blue helium burning stars at the hottest extension of the blue loop phase (MS+BHeB) with ages Myr. Stars within the cyan polygon are red supergiants (RSGs) with ages in the range Myr. The tip of the RGB lies at , so stars within the red lines are mainly RGB stars with ages Gyr. Note that there could be some contamination of the RGB box by young, red helium burning stars with masses of , particularly if they have [M/H] . The magenta lines enclose AGB stars above the RGB tip, which tend to have somewhat younger ages ( Gyr) than the RGB stars (Martínez-Delgado et al. 1999; Gallart et al. 2005).
We have also divided the RGB box into “metal-poor” ([M/H] ) and “metal-rich” ([M/H] ) subregions. There could be some overlap in the metallicities probed by these subregions, but they are broader in color than the photometric errors, and so are useful in identifying any population gradients. Some of the most metal-poor ([M/H] ) and metal-rich ([M/H] ) RGB stars may fall outside the total RGB box, but extending it further to the blue or red would increase contamination from MW foreground stars and unresolved background galaxies, and increase uncertainties due to incompleteness. Comparing the number of RGB stars with [M/H] in the Williams et al. (2008) CMD (field 6 in Fig. 1 at arcmin) to the number in our Subaru CMD reveals that most of these stars are too faint to be detected in our data. However, our detailed RGB analysis focuses on exterior regions where significantly fewer metal-rich RGB stars are expected to exist, a point substantiated in §5.
As can be seen in Fig. 5 – 7, these selection boxes sample regions of the CMD that are likely to maximize the number of M81 stars relative to the number of foreground MW stars and background galaxies. Fig. 5 shows the foreground star Hess diagram predicted by the Besançon model (Robin et al. 2003) for a field with the same area and line of sight as ours. The stellar colors and magnitudes have been scattered using a simple exponential function to mimic the increase of photometric error with magnitude seen in the real data. The Besançon model predicts that the number of foreground stars is of all point sources over the magnitude limits of the observed CMD. Since applying completeness corrections would only decrease this already small percentage, we do not use this model to correct the stellar number counts for MW stars.
At bright magnitudes (), morphological classification effectively removes background galaxies, but they can still be a significant source of contamination at faint magnitudes, especially when observing from the ground. To check the effectiveness of our classification algorithm, Fig. 6 shows the Hess diagram of the objects classified as extended. The CMD selection boxes are overlaid to facilitate comparison with the other CMDs presented here. The extended objects are concentrated in a broad diagonal band, the bulk of which lies at bluer colors than the RGB and AGB selection boxes. Importantly, the extended objects are distributed differently from the point sources, with no obvious stellar sequences aside from some misclassified MS+BHeB stars located in spatially crowded regions where their PSFs overlap significantly. This fact suggests that the algorithm has correctly classified the majority of detected M81 stars. The surface density of point sources within the total RGB box is over 2 times higher at all radii than the surface density of extended objects in the same box. Nevertheless, some compact background galaxies can be mistaken for point sources and these contaminants become increasingly important at large galactocentric distances.
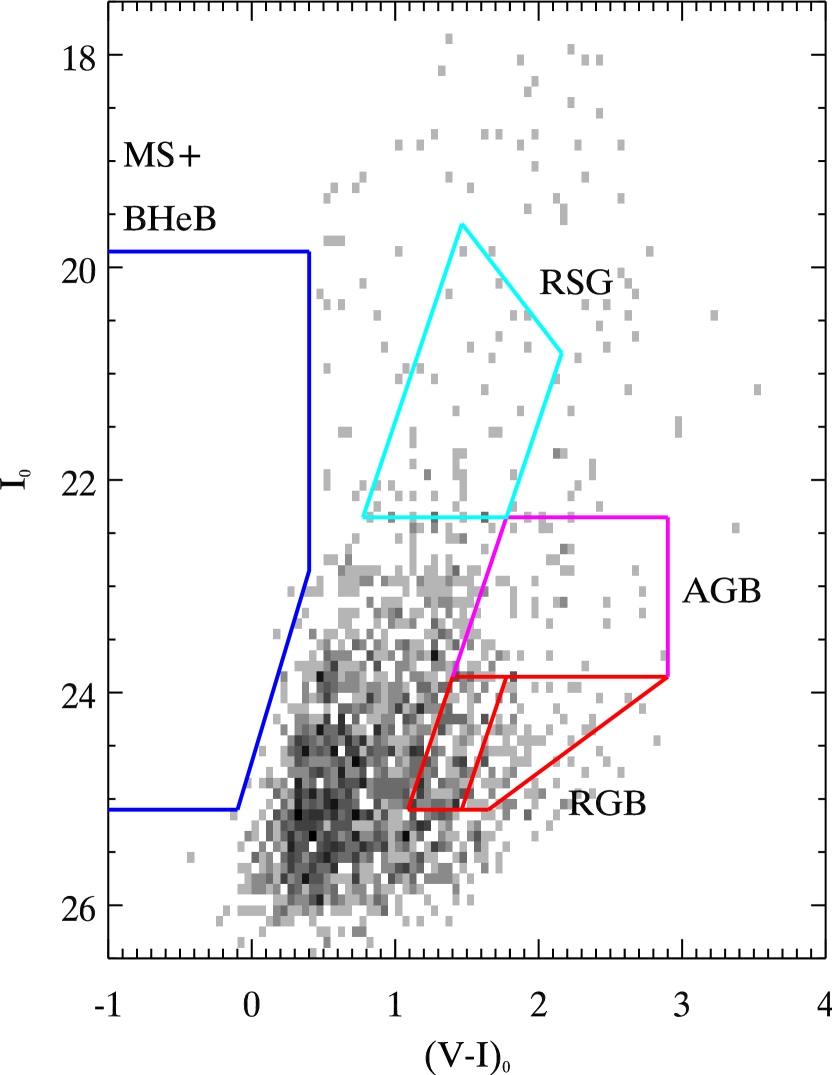
The large spatial extent of M81 and various tidal features throughout Suprime-Cam’s field-of-view make it difficult to estimate the contamination from background galaxies misclassified as point sources using just the M81 mosaics themselves. However, we can estimate this level from images of the edge-on spiral galaxy, NGC 4244, taken during the same observing run. Fig. 7 shows the Hess diagram of a control field extracted from an area of 112 arcmin2 at vertical heights kpc above NGC 4244’s disk, assuming a distance of 4.4 Mpc (Seth et al. 2005). This area corresponds to the total field-of-view around M81. Extinction corrections were applied to each object individually using the Schlegel et al. (1998) maps, which indicate a median of 0.02. The control field has sources distributed in the CMD in a similar manner as the extended objects of the M81 field. The most densely populated region lies in the same diagonal band at . The CMD selection boxes avoid this region while still sampling as much of M81’s stellar populations as possible. The surface densities of objects within the boxes in the contaminant CMD are listed in Table 1 with Poisson errors. The contaminant surface density in the total RGB box is less than the corresponding point source density at all radii, reaching a maximum fraction of at a deprojected radius arcmin.
We also estimated background contamination by downloading from the HST archive two M81 fields observed with ACS (SNAP 10523, PI: de Jong) at arcmin. These two fields were observed in the and filters and are indicated as fields 4 and 5 in Fig. 1. We performed the data reduction using the ACS module of the DOLPHOT package 555DOLPHOT is an adaptation of the photometry package HSTphot (Dolphin 2000). It can be downloaded from http://purcell.as.arizona.edu/dolphot/. following the basic steps outlined in the DOLPHOT manual. We defined objects as point sources if they were classified by DOLPHOT as ’good stars’ with and crowding parameter in both filters, and if the overall and . Magnitudes in the ACS filter system were transformed to the Johnson-Cousins system using the equations in Sirianni et al. (2005). We matched point sources in our Subaru catalog with point sources in the ACS catalogs by applying small, constant offsets in right ascension and declination and then counted the number of unmatched point sources in our catalog, presumed to be unresolved background galaxies. Note that this method assumes the ACS point-source catalogs themselves have no contamination from unresolved background galaxies. Reassuringly, the resulting background surface densities in each of the CMD selection boxes (see Table 1) were consistent with those derived from the NGC 4244 data to within . Compared to the NGC 4244 background, the ACS background is higher in the total RGB box, but the ratio of metal-poor/metal-rich RGB background is the same. The ACS background is also higher in the MS+BHeB box, but lower in the AGB and RSG boxes.
| CMD | NGC4244 | ACS |
|---|---|---|
| region | () | () |
| MS+BHeB | ||
| RSG | ||
| AGB | ||
| Metal-poor RGB | ||
| Metal-rich RGB | ||
| Total RGB |
We decided to use the NGC 4244 data to subtract the background from the radial density profiles presented below, since they sample an area 5 times greater than the ACS fields, are free from the uncertainties in the object matching, and rely on the same instrument, filters, data reduction procedure, and morphological classification as the M81 data presented here. This approach assumes a negligible contribution from stars and globular clusters in NGC 4244’s halo 20 kpc above the plane and that the background galaxy and foreground star populations (at the magnitudes we are probing) are statistically equivalent to those around M81. At , the background galaxies have a median (Ilbert et al. 2006). At this redshift, kpc, and the entire Suprime-Cam field-of-view samples a projected volume Mpc wide, large enough to gather a statistically representative sample of background galaxies regardless of position on the sky. Cosmic variance may be more of a concern here, since we are not able to use Suprime-Cam’s entire field-of-view. However, cosmic variance is more likely to affect the ACS background, which covers much less area. With regards to foreground contamination, NGC 4244 is separated from M81 by deg and lies at a higher Galactic latitude, but both galaxies are significantly above the MW plane. Indeed, the Besançon model predicts only fewer foreground stars towards NGC 4244 than towards M81, within the CMD selection boxes. Our general conclusions are unchanged if we adopt the ACS background estimates, but to be conservative, we adopt the differences between the ACS and NGC 4244 estimates as systematic errors, which are added in quadrature with the Poisson noise in the latter.
Another important issue is estimating the completeness rate of our Subaru catalog. The standard method is to run artificial star tests, in which thousands of stars with known magnitudes and colors are inserted into the original images, which are then re-processed. However, this method requires detailed knowledge of the PSF and how it varies across the field-of-view. Since we have used optimized aperture photometry that is insensitive to these variations, and given the complexities of the mosaicing and data reduction, we have elected not to run artificial star tests. Instead, we have used two alternative methods to probe the completeness rate of our catalog.
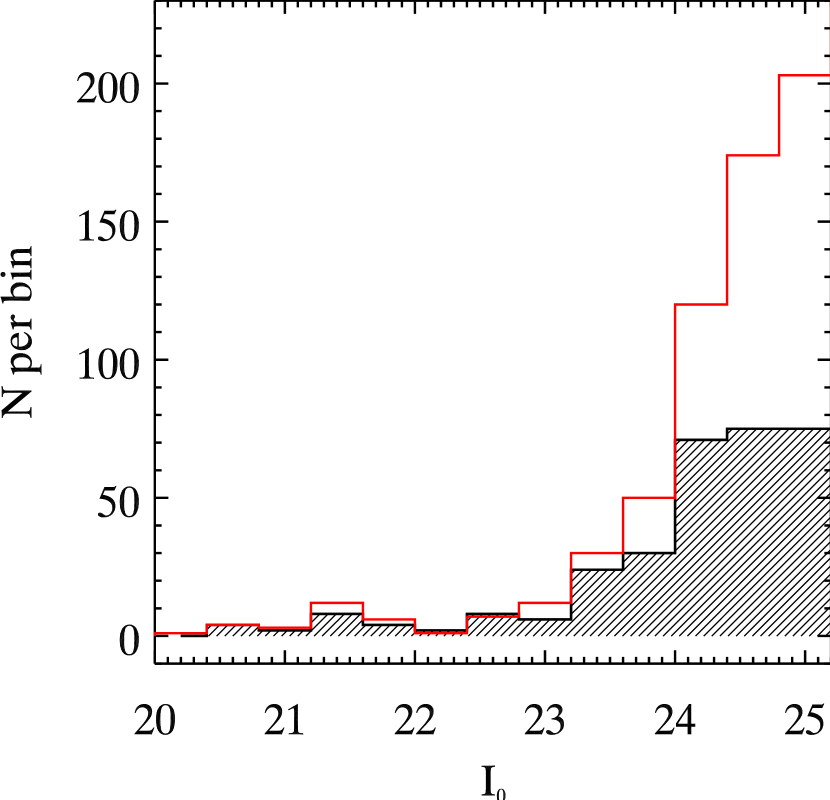
First, the completeness rate can be estimated by comparing the number of point sources in the Subaru and ACS catalogs. Fig. 8 shows the dereddened luminosity functions of all point sources in the two ACS background fields (open histogram) and the matched point sources in the Subaru catalog (hatched histogram). This figure shows that in the range arcmin and for , the Subaru catalog is complete relative to the ACS catalog. In addition, the number counts in the CMD selection boxes indicate that each box is complete relative to the ACS catalog, with a statistical uncertainty of 5% or more depending on the number of sources in each box.
Second, we use the Subaru luminosity function (LF) peak as a proxy for the completeness level. It is only an approximate indicator of this level because it depends on the true shape of the LF. Nevertheless, for our entire catalog, this peak occurs at , consistent with the above estimate. Table 2 lists the LF peak magnitude for several different color ranges. This table shows that all of the MS+BHeB and RSG boxes and most of the AGB box lie brighter than the LF peak, while about half the metal-poor RGB box and most of the metal-rich RGB box lie fainter than the peak. We note that restricting our analysis to stars brighter than the LF peak makes no significant difference to our conclusions, but we use the entire CMD boxes, anyway, to decrease Poisson noise. Thus, one should be mindful of the different completeness levels for the metal-poor and metal-rich RGB stars when examining their relative distributions.
| LF peak | |
|---|---|
| range | magnitude |
| -1.0 - 0.5 | 25.15 |
| 0.5 - 1.0 | 24.85 |
| 1.0 - 1.5 | 24.55 |
| 1.5 - 2.0 | 24.45 |
| 2.0 - 2.5 | 24.05 |
| 2.5 - 3.0 | 23.35 |
4. Two-Dimensional Spatial Distribution
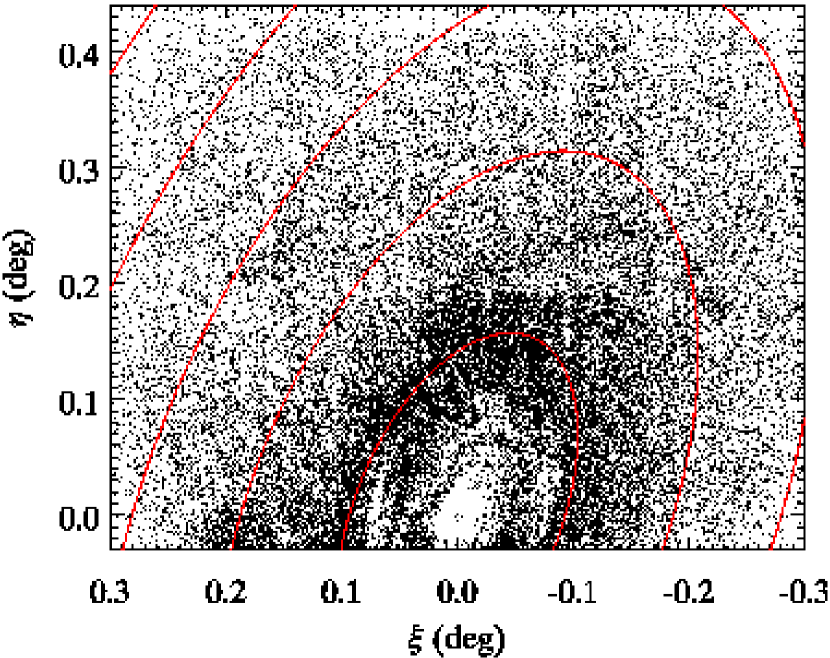
Fig. 9 displays the tangent plane projection of all point sources with and . The ellipses correspond to deprojected radii of 10, 20, 30, 40, and 50 arcmin (recall that ). No correction for contaminants has been made. The diffraction spikes of a few highly saturated stars appear as thin vertical white stripes. Visual inspection reveals significant substructure associated with spiral arms in M81’s disk and the tidal features, HoIX at and Arp’s Loop at . The hole in the central region is due to saturation and stellar crowding.
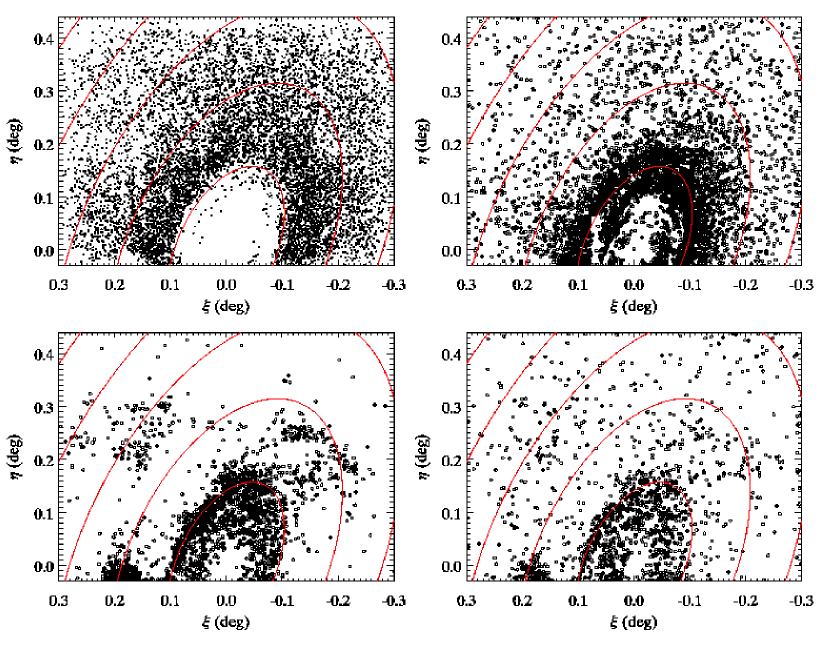
Going clockwise from top left, Fig. 10 shows the spatial maps of RGB, AGB, RSG, and MS+BHeB stars. No correction for contaminants has been made. From these maps, one can see that most of the overdensities observed in Fig. 9 are due to star formation in the last 100 Myr. There are no stellar groupings in the RGB and AGB maps that can be unequivocally linked to groupings in the MS+BHeB or RSG maps. Indeed, the RGB and AGB stellar distributions are smooth except near the chip edges and mosaic corners, where the completeness rate is lower due to different field centers and vignetting. These regions are therefore excluded from the radial stellar density profiles discussed in §5.
In their ACS images of Arp’s Loop at (0.16,0.23), de Mello et al. (2008) found that the RGB stars were broadly distributed like the youngest stars, except for a couple O-B associations, which may be too young to have formed RGB stars. Our stellar maps, which reveal the stellar distribution on a larger scale than the HST images, appear to contradict this finding because there is no clear broad overdensity of RGB stars associated with Arp’s Loop. This fact is consistent with the idea that Arp’s Loop was initially entirely gaseous tidal debris that began forming stars Myr ago, around the time of the last close encounters between M81, M82, and NGC 3077. It is possible that young, red He-burning stars were contaminating the de Mello et al. (2008) RGB sample, but there is no obvious reason why their sample would suffer more from this contamination than ours. It is also possible that the completeness rate in our maps is not exactly uniform across this part of Arp’s Loop. This is obviously the case for HoIX, where the crowding is so severe that it appears as a hole in the RGB star map, so we are unable to comment on the assertion of Sabbi et al. (2008) that most of its RGB stars belong to M81.
One of the stellar concentrations identified by Davidge (2008b), TDO 3, lies within our field-of-view at (-0.13,0.25) and appears as an overdensity of MS+BHeB and RSG stars. TDO 3 is clearly associated with the northernmost spiral arm, which may be tidally driven (Yun et al. 1994), but neither of these objects necessarily are, or will become, distinct tidal dwarf galaxies, as may be the case for Arp’s Loop and HoIX. The CMD of TDO 3 suggests an age spread of several tens of Myr with the youngest stars Myr old, consistent with the estimates of Davidge (2008b). We are also able to confirm his tentative detection of a stellar grouping east of Arp’s Loop at (0.25,0.24), with a similar age as TDO 3.
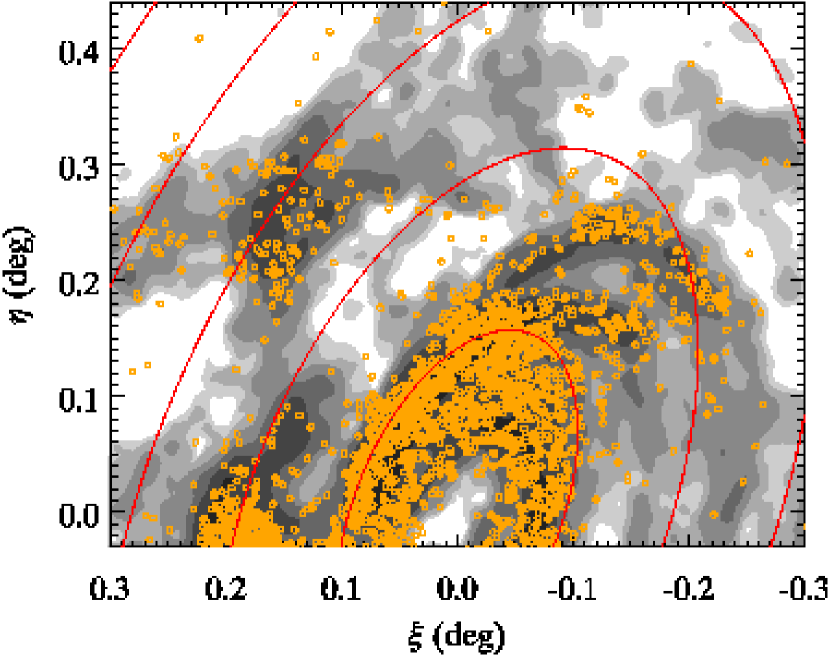
Fig. 11 shows the distribution of MS+BHeB stars overlaid on the HI column density map of Yun et al. (1994). The contour levels increase by factors of two with the lowest (white) covering densities (or ). The young stars closely trace the HI for column densities . Few young stars exist in regions with lower column density. This seems consistent with a simple star formation threshold gas surface density, but it could also be caused by a star formation rate in these low-density regions that is too small to produce the high-mass stars we have resolved.
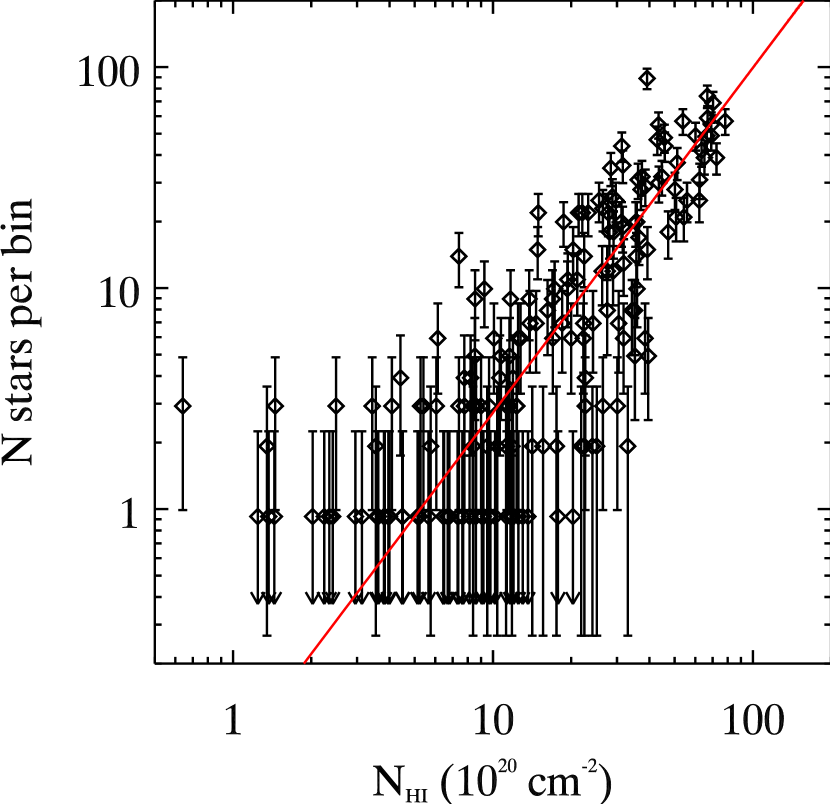
To investigate the correlation between HI and MS+BHeB stars in more detail, we divided the field into square bins 1.7 arcmin ( kpc) on a side and counted the number of these stars in each bin. For reference, the beam size of the radio observations was arcmin. Fig. 12 shows the background corrected number counts as a function of mean HI column density within each region. Errors with downward pointing arrows indicate regions with only one young star. A maximum likelihood fit yields a best fit slope of 1.6 and 2 confidence interval of . Increasing or decreasing the area of each bin by a factor of 4 increases or decreases the slope by , respectively.
Our measured slope is roughly consistent with expectations from the canonical Kennicutt-Schmidt (KS) relation, which has a slope of 1.4 (Kennicutt 1998), but that relation was derived for disk-averaged quantities rather than individual regions. Our slope is within the range (1.2 – 3.5) derived for small regions or azimuthally averaged rings in disk galaxies (Wong & Blitz 2002; Boissier et al. 2003; Kennicutt 2007). Recent theoretical work on star formation in galactic disks predicts the KS relation to steepen at low gas densities, due to a star formation threshold, decreasing molecular fraction, or flaring of the gas disk (Schaye & Dalla Vecchia 2008; Robertson & Kravtsov 2008). Since we have neglected molecular gas, a detailed comparison to these studies is unwarranted. We simply note that our data are consistent with a single slope down to gas densities of , lower than typically probed using flux as a star formation tracer and lower than most estimates of the star formation threshold, which include molecular gas. Note also that incompleteness may cause some of the fainter MS+BHeB stars to be preferentially missed in the most crowded regions with the highest gas densities, possibly biasing our measured slope downward. Nevertheless, it is encouraging that we recover a reasonable slope using an independent method sensitive to a wider age range than flux (100 Myr vs. 10 Myr).
5. Radial Profiles
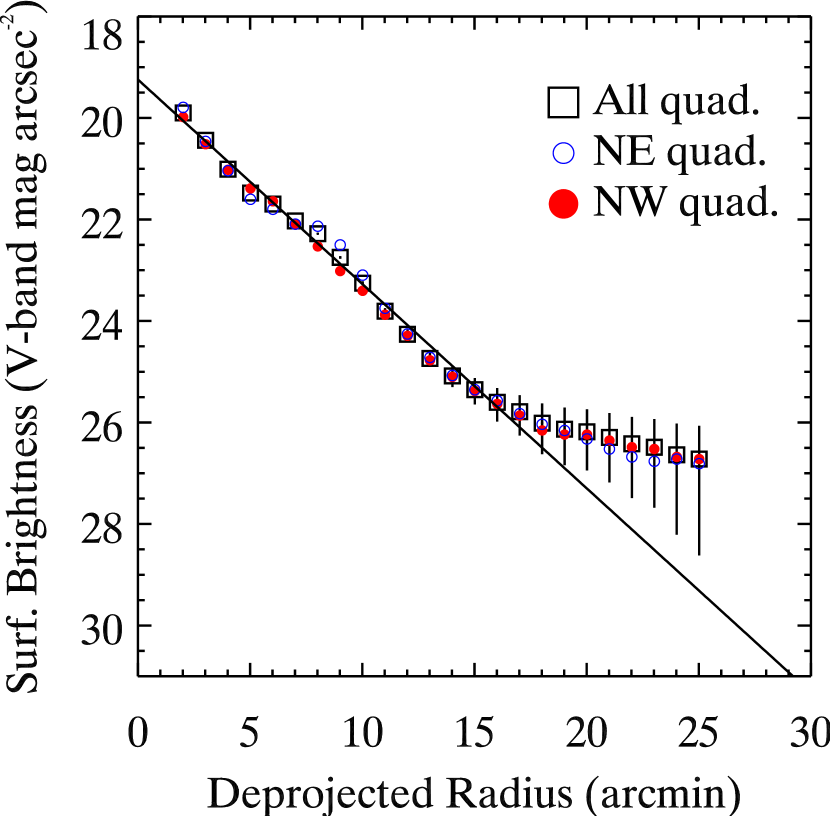
We derived the V-band diffuse light surface brightness profile of M81 using the IRAF ellipse task with elliptical annuli of constant center, position angle, and inclination and after masking saturated stars. In each elliptical annulus, the median pixel value was computed after two clipping iterations. The sky value was estimated as the average median pixel value of 13 3x3 arcmin boxes near the edges of the mosaic. Squares in Fig. 13 show the sky-subtracted profile. The error bars include read noise, Poisson noise in the total signal, and the standard deviation of the 13 median sky values. Open circles represent the NE quadrant and filled circles represent the NW quadrant (relative to M81’s nucleus and following the convention where north is up and east is to the left). The error bars on the circles are omitted for clarity. The median extinction of all point sources, , was subtracted from the profiles. Inside arcmin, the bulge is saturated, so there are no data points there.
The diffuse light surface brightness profile traces M81’s exponential disk out to arcmin, farther than previous studies (Kent 1987; Möllenhoff 2004; Willner et al. 2004). The exponential scale-length inside 17 arcmin (shown by the solid line) is arcmin, in good agreement with 2.53 arcmin found by Mollenhoff (2004), who performed a bulge-disk decomposition inside arcmin and over all 4 quadrants. The bump in the NE profile at arcmin is due to a spiral arm. There is a clear flattening in the profiles at arcmin, but the uncertainties make the precise location and amount of flattening somewhat ambiguous.
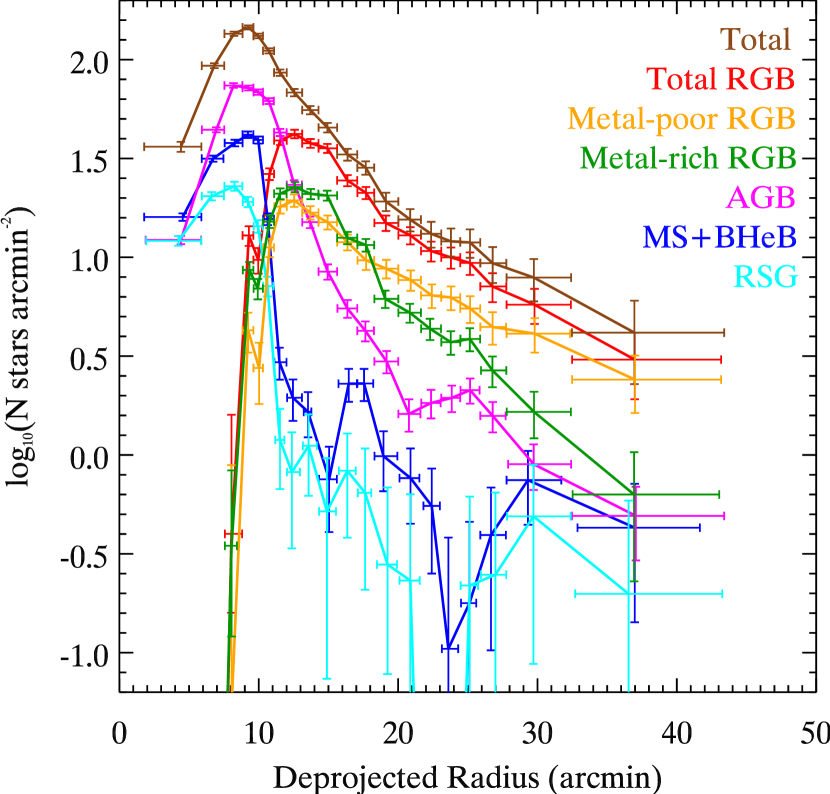
In Fig. 14, we show the background-subtracted surface density of stars in each of the CMD selection boxes described in §3. The lines are color-coded so that the total RGB box is red, metal-poor RGB box is orange, metal-rich RGB box is green, AGB box is magenta, MS+BHeB box is blue, and RSG box is cyan. The top profile is the total of all the boxes. Each point in the profiles is the mean of all stars within a bin. We chose the bin widths so they would have approximately the same number of total stars. The vertical error bars include Poisson noise and systematic uncertainty in the background, while the horizontal error bars denote the full radial range of stars in each bin. To count stars and pixel area, we used only those pixels with the highest weights in the confidence maps (i.e., with contributions from all dithered images). We also applied a small crowding correction factor to the profiles, typically amounting to , following the prescription in Irwin & Trimble (1984). This correction factor breaks down in the most crowded regions where the stellar PSFs significantly overlap, resulting in a turnover in the density profiles at arcmin. Therefore, we limit most of the resolved star analysis to radii beyond this turnover.
The young star profiles (MS+BHeB and RSG) exhibit the most substructure, as expected from their 2-D spatial distribution. The broad bump at arcmin is due to HoIX and the most northern spiral arm. Beyond 12 arcmin, the vast majority of the young stars are located in HoIX, Arp’s Loop, and the northern two spiral arms. The sharp drop in the young star profiles at arcmin approximately coincides with the star formation threshold radius in M81 measured by Martin & Kennicutt (2001) at arcmin. They obtained this value from the drop in the azimuthally averaged surface brightness profile over the whole disk, but asymmetries cause systematic azimuthal variations in , of a few arcmin (Martin & Kennicutt 2001). Like the young stars, the azimuthally averaged radial profile of HI flux shows a peak at about 8 arcmin, with a pronounced hole near the nucleus and a steep gradient beyond 8 arcmin, so the peak in the young star profiles at this radius may be real rather than an artifact of incompleteness.
The total star count profile in Fig. 14 confirms the behavior of the diffuse light profile, with a steep inner slope between 10 and 19 arcmin and shallower outer slope beyond 19 arcmin. The break radius lies somewhat farther out than inferred from the diffuse light profile, but this difference is not significant given the uncertainties in the latter. The fact that this transition to a flatter radial falloff is seen in both diffuse light and star count analyses means it is genuine and not due to background uncertainties or completeness variations.
The RGB stars dominate the total number counts outside arcmin, so the total RGB profile has a similar flattening as the total star profile. Interestingly, the metal-poor RGB component has a shallower slope than the metal-rich component. The appearance of such a trend could have a number of causes. First, the background counts in the metal-poor RGB box would have to be underestimated by a factor of , or if the metal-rich RGB box background were simultaneously overestimated by a factor of . Since these factors are much larger than the differences between the NGC 4244 and ACS contamination estimates and their statistical uncertainties, we consider it unlikely that the observed population gradient is due to an error in the background subtraction. It could be conceivable that the completeness of the metal-rich RGB box has a stronger dependence on galactocentric radius than the metal-poor RGB box because the metal-rich stars are fainter in the V-band. However, correcting for such a difference would actually enhance the population gradient by making the metal-rich profile rise even more sharply to smaller radii. Another possibility is that the photometric errors could be scattering an increasing fraction of stars from the metal-poor RGB box to the metal-rich box as radius decreases and the stellar crowding increases. This also is unlikely because the median errors change by mag for radii 15 arcmin and this amount is much smaller than the widths of the CMD boxes.
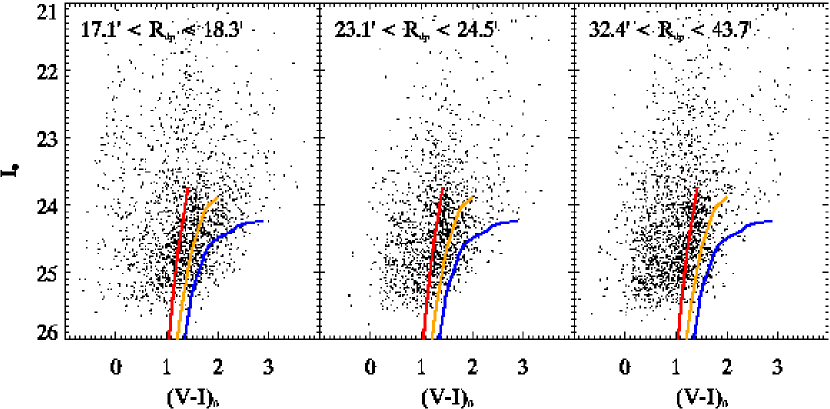
The veracity of the population gradient apparent in the RGB density profiles is supported by Fig. 15, which compares the CMDs for three different radial ranges (indicated in the top of each panel), moving outwards in radius and starting where the two RGB boxes have roughly the same surface density. The similarity between the faint envelopes of the CMDs testifies further to the stability of the photometric errors and completeness rate over this radial range. Overplotted on the CMDs are theoretical RGBs from Marigo et al. (2008) for [M/H] –1.3, –0.7, and –0.4 and an age of 10 Gyr. Most of the sources at and are unresolved background galaxies. Each CMD has roughly the same number of objects, so the area covered by each and, consequently, the number of background galaxies progressively increases with radius.
There is a clear excess of sources in all three CMDs where we would expect to find an RGB population. The color distribution of these sources shifts to the blue as radius increases. In the innermost CMD, these sources are distributed roughly evenly between the isochrones, but in the outermost CMD, the highest density of sources lies between the –1.3 and –0.7 isochrones, indicating a peak . A similar result holds, but shifted downward by dex, if we use the Dartmouth isochrones (Dotter et al. 2007) with the same age. Splitting the difference between the stellar models, we estimate the extended component has a peak metallicity in the range arcmin. If the RGB stars were as young as 2 Gyr, then their metallicities would shift upward by dex. Because of the age-metallicity degeneracy, we cannot completely rule out age effects, but we consider it unlikely that the observed trend is entirely due to an age spread, as no single metallicity can span the full color range of the total RGB selection box.
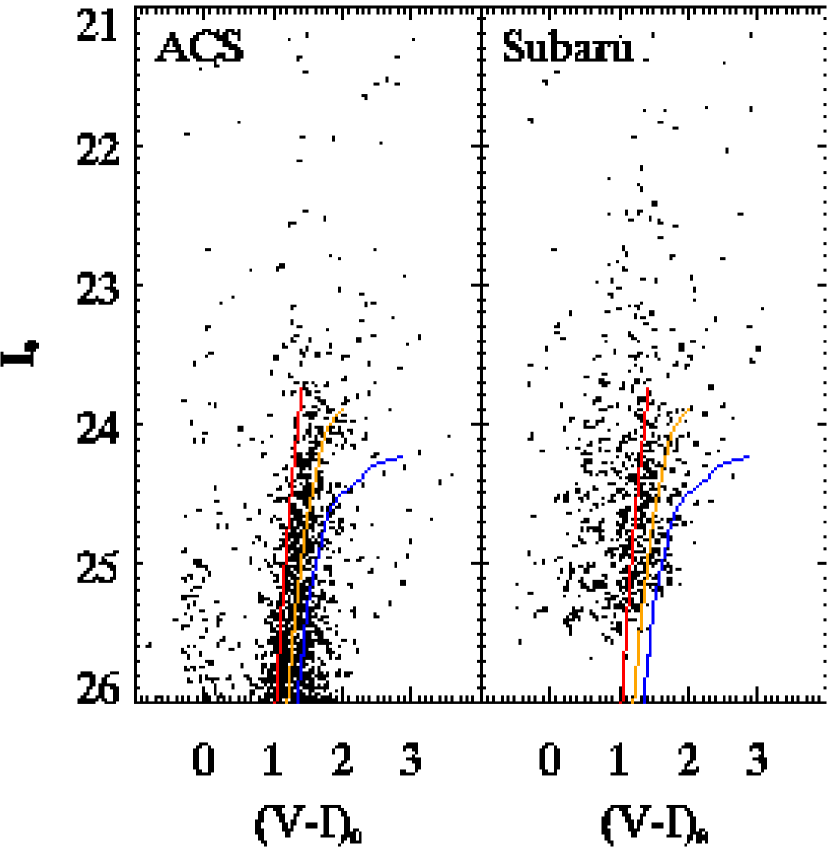
As discussed in §3, the Subaru point source catalog contains some unresolved background galaxies and completeness becomes an important issue for RGB metallicities [M/H] , raising the question of whether background contamination, incompleteness, or systematic color-magnitude shifts are biasing our metallicity estimate. We address this question by comparing in Fig. 16 the ACS and Subaru CMDs for the two ACS background fields. The CMDs contain point sources from the same two regions on the sky (fields 4 and 5 in Fig. 1), but the sources are not cross-matched. Thus, the Subaru CMD contains true stars and unresolved background galaxies which, as previously discussed, are expected to mainly inhabit a region blueward of the RGB. The CMDs appear reasonably similar, and there is no obvious sign in the ACS CMD of any significant metal-rich RGB population at this distance ( arcmin) that could have been missed by the Subaru catalog. Based on the above considerations, we assign an uncertainty of dex to our metallicity estimate for the extended component.
Using RGB star counts in several WFPC2 fields across M81, Tikhonov et al. (2005) presented evidence for a flattening in stellar surface density at arcmin. Their study, however, relied on only two fields beyond this radius on opposite sides of the galaxy (field 1 in Fig. 1 and another coincident with field 3). From the color of the RGB, they derived [Fe/H] in four of their fields at arcmin and [Fe/H] in field 1 of Fig. 1, lying at arcmin. Mouhcine et al. (2005) also analyzed field 1 and derived [Fe/H] . The differences between their metallicity estimates and ours are not surprising because their estimates come from regions with a dominant or non-negligible contribution from the bright optical disk, which is more metal-rich than the extended component. Moreover, the extended component itself may have a metallicity gradient, so our estimate strictly applies to the region arcmin.
6. Discussion
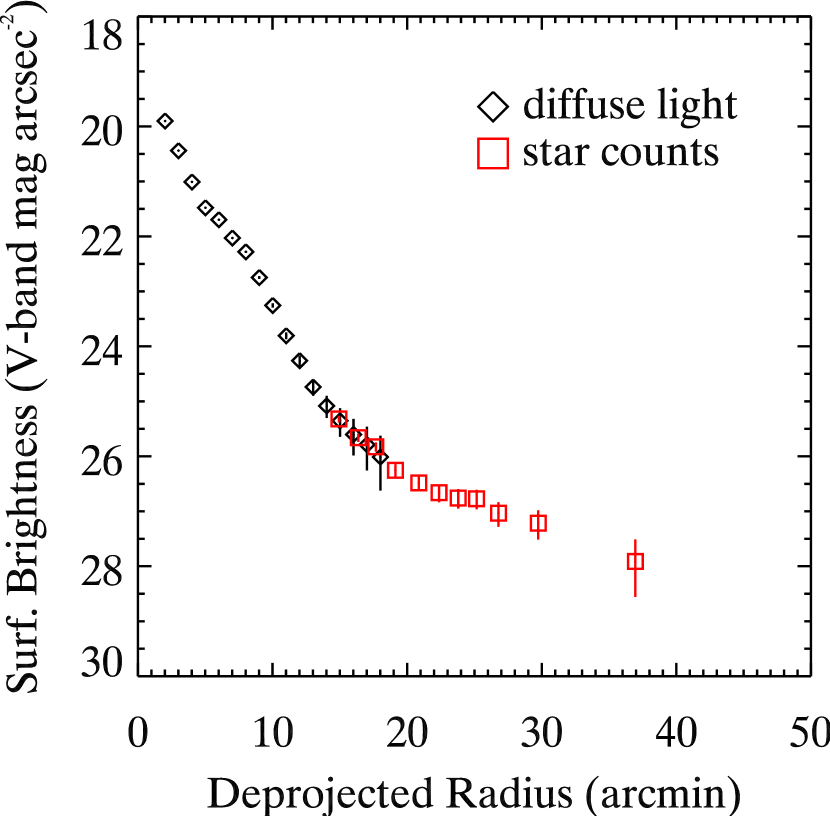
Taking a similar approach as Irwin et al. (2005), we construct a composite surface brightness profile by using the diffuse light and total star count profiles in the regions where they are each most reliable. That is, within the bright optical disk, where the effects of incompleteness are most severe, we use the diffuse light profile because it is insensitive to these effects. In the outer regions, where the sky background dominates the diffuse light, but where the completeness rate is the highest and varies the least, we use the star counts, which have a higher contrast over the background than the diffuse light. The overlapping region allows us to bring the star counts onto the same absolute luminosity scale as the diffuse light. By merging the diffuse light and resolved star count profiles in this way, we can trace M81’s surface brightness over a larger radial range and to fainter magnitudes than is possible with either profile alone.
The resulting composite V-band light profile (Fig. 17) shows even more clearly the presence of two regimes, a steep inner gradient for arcmin and a shallower outer gradient at larger radii. As shown in §5, the inner profile gradient follows an exponential with arcmin. Fitting the total star counts beyond 20 arcmin yields arcmin and . These fits maximize the extended component’s contribution at small radii because they ignore the bright optical disk.
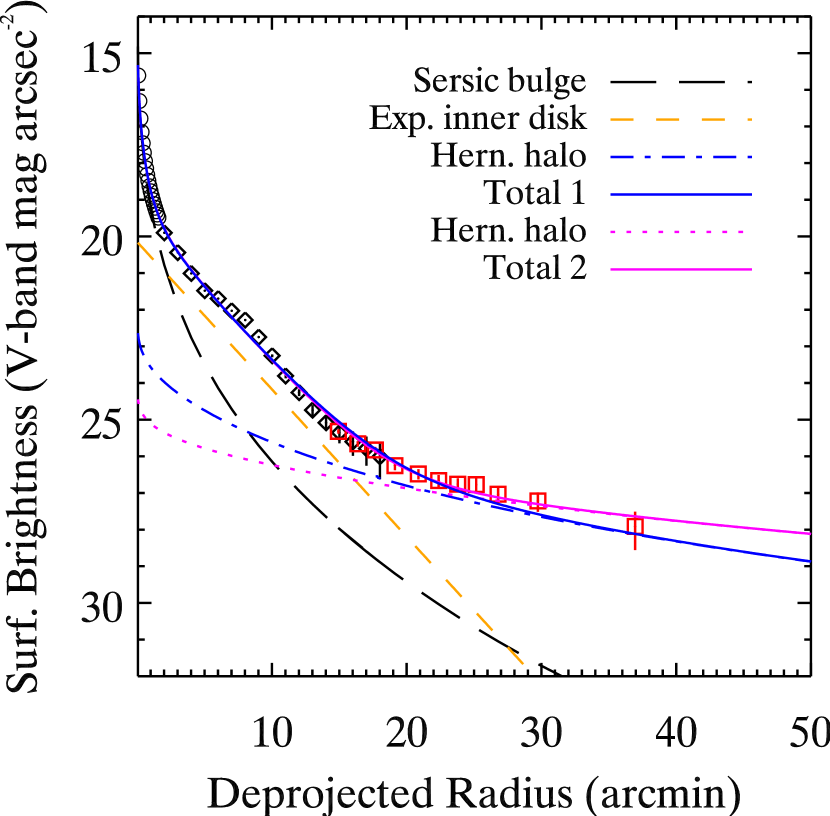
In Fig. 18, we show two possible 3-component decompositions of the composite light profile. The point symbols and error bars are the same as in Fig. 17. To represent the bulge region, we have added the profile of Möllenhoff (2004). In doing so, we assume his model is a good description of the true V-band light distribution. His total light profile inside 2 arcmin is shown as circles and his Sérsic bulge component (with and arcmin) is the long-dashed line. The bright optical disk with scale-length arcmin is the short-dashed line. Because of background uncertainties and the limited radial baseline, the total profile’s shape parameters cannot be very well constrained in a simultaneous 3-component fit. Instead, we begin by using the halos of the MW and M31 as benchmarks for comparison under the assumption that the extended component is M81’s halo. Later, we consider other possibilities such as a thick disk.
Numerous studies over the years have found that the MW stellar halo has a peak [Fe/H] (or [M/H] for a typical ), and a power-law volume density distribution with exponent (see the recent reviews by Helmi [2008] and Geisler et al. [2007]). Newberg & Yanny (2006) also found the distribution of halo F-turnoff stars in the SDSS followed a Hernquist profile with best-fit scale radius kpc 666 We recall that of the half-mass radius and of the (projected) half-light radius of a Hernquist profile (Hernquist 1990)..
Several recent studies have found evidence for an extended halo in M31 with metallicities in the range –0.7 to –1.5 (Reitzel & Guhathakurta 2002; Kalirai et al. 2006; Chapman et al. 2006; Richardson et al. 2009). In their photometric study of the southern quadrant of M31, Ibata et al. (2007) showed that this component could be fit by a Hernquist profile with kpc or an exponential profile with scale-length kpc out to 150 kpc. Fitting the minor axis profile in regions devoid of spatial substructures, they estimated a projected power-law exponent of .
Two Hernquist profiles with the same scale radii as the MW and M31 halos translated to M81’s distance are represented by the dot-dashed and dotted lines, respectively, in Fig. 18. To plot these profiles, we assumed M81’s extended component is spherically symmetric and multiplied the deprojected radius in the appropriate formulae by a geometrical factor of , to approximately account for deprojecting the halos with M81’s inclination, deg (Regan & Vogel 1994). The two Hernquist profiles provide an adequate description of the data, but are virtually indistinguishable over the observed radial range. Extending the survey out to arcmin would offer the best chance of ruling out one Hernquist model or the other. Integrating the profiles out to 100 arcmin, M81’s halo would contain of its total V-band luminosity, or . Uncertainties in the diffuse light sky subtraction in the range arcmin translate to a systematic uncertainty of about in our luminosity estimate, since this was the region used to normalize the star counts to absolute V-band luminosity. Nevertheless, M81’s extended component appears to be more luminous than the MW and M31 halos, which have (Carney et al. 1990; Ibata et al. 2007).
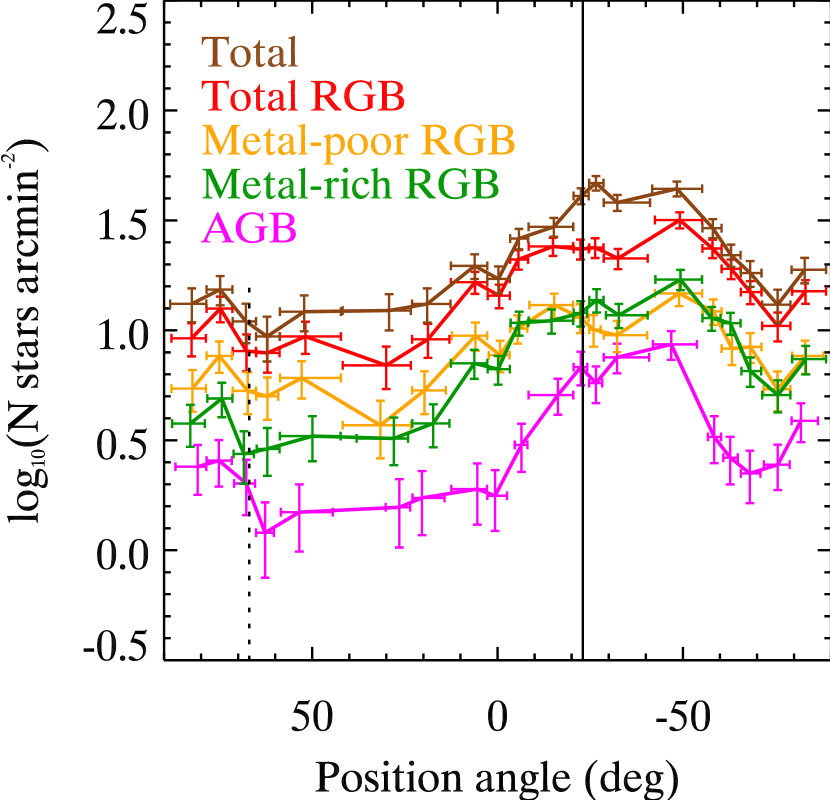
As we have discussed, the total star counts beyond arcmin are dominated by metal-poor RGB stars. If this metal-poor RGB component is M81’s halo, then it should display a more circular morphology projected on the sky than the metal-rich RGB component. We test this possibility in Fig. 19, where we examine the background-subtracted azimuthal variation in stellar surface density in a circular annulus around M81’s nucleus. To minimize the effects of crowding on the profiles and maximize the baseline in position angle, we include only stars with projected radii of 12 – 18 arcmin. This range spans deprojected radii of about 15 – 30 arcmin in total, with the precise sampled depending on the position angle. The solid and dotted vertical lines mark M81’s major and minor axes, respectively.
The profiles have a roughly sinusoidal shape, as expected for a disk morphology with M81’s inclination and position angle. The profile of the metal-poor RGB component appears marginally flatter than the metal-rich component, suggesting it could contain a superposition of disk and halo populations, or a disk structure with a larger scale height or lower inclination than the bright optical disk. Applying a K-S test on the azimuthal distributions of the metal-poor and metal-rich RGB stars (in the annulus) gives a probability of 0.1% that they are drawn from the same parent distribution. The fact that the maxima of the curves are offset from the major axis is probably caused by the northern spiral arms, which host strong star formation west of the major axis.
One may wonder whether the most recent close encounters with M82 and NGC 3077 caused any measurable asymmetries in the density distribution of M81’s halo. These encounters supposedly occurred Myr ago, which is much less than the halo crossing time of 1 Gyr, so there should not have been enough time for the halo to reach a new equilibrium. We have examined the stellar density profiles on both sides of M81, finding similar trends as seen in Fig. 14. This fact suggests the encounters did not signficantly disturb the halo, but additional data are needed at other position angles and reaching larger radii to confirm this suggestion. A survey of M81’s southern region, particularly along the minor axis, would help further constrain the interaction history and any role it had in shaping the halo (and disk).
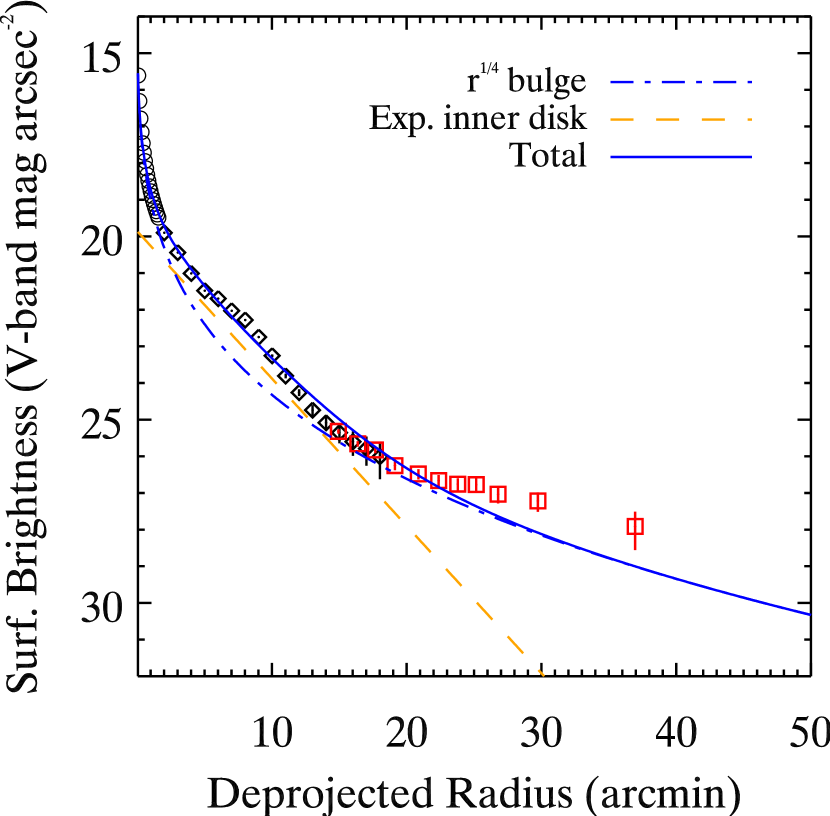
Fig. 20 tests the possibility that the extended component is the faint extension of M81’s bulge. In this figure, the dashed line is the exponential disk with arcmin, the dot-dashed line is our best-fitting law with effective radius arcmin and the solid line is the sum of both components. In this case, the bulge contributes of the total V-band luminosity. The data favor the Hernquist profiles over the law because the latter has a slope that is too steep at large radii. The law would also imply a significant metallicity gradient in M81’s bulge, as Kong et al. (2000) estimated [M/H] inside 2 arcmin. Fitting a Sérsic law yields and arcmin, but does not significantly improve the fit quality.
Rather than a halo or bulge, M81’s extended component may be some type of disk structure. Both metal-poor and metal-rich RGB stars may belong to a single perturbed disk component with a negative metallicity gradient and a change in intrinsic orientation and/or scale-length at arcmin. Alternatively, the extended component may be more analagous to the MW’s thick disk or M31’s extended disk (Ibata et al. 2005), with distinct dynamics and formation history from the dominant inner disk. The MW’s thick disk has a scale-length roughly larger than the thin disk, or kpc (Jurić et al. 2008), it has a mean metallicity (Gilmore et al. 1995; Robin et al. 1996; Soubiran et al. 2003; Allende Prieto et al. 2006), and it contains of the total disk light (Buser et al. 1999; Chen et al. 2001; Larsen & Humphreys 2003). In comparison, M81’s extended component is less centrally concentrated, has a slightly lower metallicity, but has a similar luminosity. We note that the MW’s thick disk has been studied mainly within a few kpc of the solar cylinder, so it is difficult to draw firm conclusions from this comparison.
Regardless of the disk/spheroid nature of the extended component, M81 seems to be a nearby example of the so-called anti-truncated galaxy class identified by Erwin et al. (2005) and Pohlen & Trujillo (2006). Some of the anti-truncated envelopes found by Erwin et al. (2005) had rounder isophotes than the inner disks, suggesting a transition to a spheroidal component for those particular galaxies, but Pohlen & Trujillo (2006) could not reliably measure the outer isophote shapes in their sample. It is also worth noting that the break in M81’s profile occurs at a larger radius than nearly all the anti-truncated galaxies in Pohlen & Trujillo (2006).
The results presented here may also have important ramifications for studies of the star formation history (SFH) in M81. For field 6 in Fig. 1, Williams et al. (2008) derived a SFH in which of stars formed prior to 8 Gyr ago. In light of our results, the stellar population in the Williams et al. (2008) field is actually a mixture of the inner disk and extended component, which at this distance on the major axis could contribute to the total V-band luminosity. We suggest, therefore, that if the extended component is an old spheroid or thick disk, then it could be responsible for some of the star formation in their oldest age bin ( Gyr), meaning M81’s outer disk is younger than inferred from the total SFH. More generally, these considerations highlight the complications that can arise in pencil-beam studies when multiple galactic structural components lie along the same line-of-sight. Studies of the outer disks of massive spirals may contain a non-negligible “contamination” from their spheroids or thick disks and vice-versa.
7. Summary
Using Suprime-Cam on the Subaru telescope, we have conducted the first wide field mapping of both young ( Myr) and old ( Gyr) resolved stellar populations around M81, reaching projected distances of kpc. Throughout the surveyed region, the surface density of young stars ( Myr) traces the HI column density in a manner similar to the Kennicutt-Schmidt relation, but we are able to probe the relation over a much wider range of gas densities than is normally possible with imaging. We find no strong evidence for a population of RGB stars in Arp’s Loop over and above the background M81 population. This is consistent with the idea that Arp’s Loop was initially completely gaseous tidal debris that began forming stars around the time of the last significant gravitational interaction of the M81 group Myr ago.
Both diffuse light and resolved star counts show evidence for an extended structural component beyond the bright optical disk with a much flatter surface brightness profile, but the star counts allow us to probe this component to fainter levels than is possible with the diffuse light alone. This component begins to dominate at arcmin and , and continues out to the last measured point at arcmin and . This flattening is accompanied by a shift in RGB color toward the blue, which we interpret as a shift to lower metallicity.
The extended component shares some similarities with the MW’s halo and thick disk, but has some important differences, as well. If this extended component is Gyr old, then it has a peak metallicity at radii kpc assuming a distance of 3.6 Mpc. This metallicity is slightly higher than the MW’s halo, but lower than the MW’s thick disk. In the radial and azimuthal range probed by our data, the surface density profile of the extended component follows a power-law with an exponent of , similar to the MW’s halo, but much shallower than the MW’s thick disk. If it is separate from M81’s bulge and thin disk, then it contains of M81’s total V-band luminosity, which is similar to the MW’s thick disk, but several times more luminous than the MW’s halo. Caution must be exercised when making such comparisons, however, since these structures have been isolated with different selection techniques and probed at different galactocentric distances.
Other interpretations for the extended component, such as a perturbed thin disk, remain viable. An interaction induced disturbance occurring Gyr ago seems an unlikely cause for this component, as it appears in both the NE and NW quadrants relative to the galaxy’s nucleus. If this component is the faint extension of the bulge, a possibility which our data disfavor relative to a halo or thick disk, then the bulge would contain over half of the total V-band luminosity and must have a significant metallicity gradient, from super-solar in the nucleus to about 10 times less than solar at a projected radius of kpc.
Further progress in understanding this structure in M81 requires mapping the resolved RGB stars over a wider area. This includes extending the radial baseline to properly test different structural models, and probing more position angles to check for asymmetries that may have occurred as a result of gravitational interactions with its galactic neighbors. Kinematic information for individual RGB stars in this component would also be important for constraining its nature, but this must await future generations of ground-based telescopes and spectrographs.
References
- Abadi et al. (2003) Abadi, M. G., Navarro, J. F., Steinmetz, M., & Eke, V. R. 2003, ApJ, 597, 21
- Allende Prieto et al. (2006) Allende Prieto, C., Beers, T. C., Wilhelm, R., Newberg, H. J., Rockosi, C. M., Yanny, B., & Lee, Y. S. 2006, ApJ, 636, 804
- Bell et al. (2008) Bell, E. F., et al. 2008, ApJ, 680, 295
- Bland-Hawthorn et al. (2005) Bland-Hawthorn, J., Vlajić, M., Freeman, K. C., & Draine, B. T. 2005, ApJ, 629, 239
- Boissier et al. (2003) Boissier, S., Prantzos, N., Boselli, A., & Gavazzi, G. 2003, MNRAS, 346, 1215
- Brook et al. (2004) Brook, C. B., Kawata, D., Gibson, B. K., & Freeman, K. C. 2004, ApJ, 612, 894
- Bullock & Johnston (2005) Bullock, J. S. & Johnston, K. V. 2005, ApJ, 635, 931
- Burstein (1979) Burstein, D. 1979, ApJ, 234, 829
- Buser et al. (1999) Buser, R., Rong, J., & Karaali, S. 1999, A&A, 348, 98
- Cardelli et al. (1989) Cardelli, J. A., Clayton, G. C., & Mathis, J. S. 1989, ApJ, 345, 245
- Carney et al. (1990) Carney, B. W., Latham, D. W., & Laird, J. B. 1990, AJ, 99, 572
- Chapman et al. (2006) Chapman, S. C., Ibata, R., Lewis, G. F., Ferguson, A. M. N., Irwin, M., McConnachie, A., & Tanvir, N. 2006, ApJ, 653, 255
- Chen et al. (2001) Chen, B., et. al. 2001, ApJ, 553, 184
- Cutri (2003) Cutri, R. M. e. a. 2003, NASA/IPAC Infrared Science Archive, 2MASS All Sky Catalog of point sources, http://irsa.ipac.caltech.edu/applications/Gator/
- Dalcanton & Bernstein (2002) Dalcanton, J. J. & Bernstein, R. A. 2002, AJ, 124, 1328
- Davidge (2008a) Davidge, T. J. 2008a, AJ, 136, 2502
- Davidge (2008b) —. 2008b, PASP, 120, 1145
- Davidge (2009) —. 2009, AJ, 697, 1439
- de Grijs & van der Kruit (1996) de Grijs, R. & van der Kruit, P. C. 1996, A&AS, 117, 19
- de Jong (2008) de Jong, R. S. 2008, MNRAS
- de Jong et al. (2008) de Jong, R. S., Radburn-Smith, D. J., & Sick, J. N. 2008, in ASP Conf. Ser. 396, ed. J. G. Funes & E. M. Corsini (San Francisco, CA: ASP), 187
- de Mello et al. (2008) de Mello, D. F., Smith, L. J., Sabbi, E., Gallagher, J. S., Mountain, M., & Harbeck, D. R. 2008, AJ, 135, 548
- de Vaucouleurs et al. (1991) de Vaucouleurs, G., de Vaucouleurs, A., Corwin, Jr., H. G., Buta, R. J., Paturel, G., & Fouque, P. 1991, Third Reference Catalogue of Bright Galaxies (New York: Springer)
- Dolphin (2000) Dolphin, A. E. 2000, PASP, 112, 1383
- Dotter et al. (2007) Dotter, A., Chaboyer, B., Jevremović, D., Baron, E., Ferguson, J. W., Sarajedini, A., & Anderson, J. 2007, AJ, 134, 376
- Durrell et al. (2004) Durrell, P. R., Decesar, M. E., Ciardullo, R., Hurley-Keller, D., & Feldmeier, J. J. 2004, in IAU Symp. 217, Recycling Intergalactic and Interstellar Matter, ed. P.-A. Duc, J. Braine, & E. Brinks (San Francisco: ASP), 90
- Erwin et al. (2005) Erwin, P., Beckman, J. E., & Pohlen, M. 2005, ApJ, 626, L81
- Ferguson et al. (2007) Ferguson, A., Irwin, M., Chapman, S., Ibata, R., Lewis, G., & Tanvir, N. 2007, in Island Universes: Structure and Evolution of Disk Galaxies, ed. R. S. de Jong (Dordrecht: Springer), 239
- Ferguson et al. (2002) Ferguson, A. M. N., Irwin, M. J., Ibata, R. A., Lewis, G. F., & Tanvir, N. R. 2002, AJ, 124, 1452
- Font et al. (2006) Font, A. S., Johnston, K. V., Bullock, J. S., & Robertson, B. E. 2006, ApJ, 646, 886
- Freedman et al. (1994) Freedman, W. L., et al. 1994, ApJ, 427, 628
- Gallart et al. (2005) Gallart, C., Zoccali, M., & Aparicio, A. 2005, ARA&A, 43, 387
- Gilmore et al. (1995) Gilmore, G., Wyse, R. F. G., & Jones, J. B. 1995, AJ, 109, 1095
- Gottesman & Weliachew (1975) Gottesman, S. T. & Weliachew, L. 1975, ApJ, 195, 23
- Greisen & Calabretta (2002) Greisen, E. W. & Calabretta, M. R. 2002, A&A, 395, 1061
- Hernquist (1990) Hernquist, L. 1990, ApJ, 356, 359
- Ibata et al. (2005) Ibata, R., Chapman, S., Ferguson, A. M. N., Lewis, G., Irwin, M., & Tanvir, N. 2005, ApJ, 634, 287
- Ibata et al. (2001) Ibata, R., Irwin, M., Lewis, G., Ferguson, A. M. N., & Tanvir, N. 2001, Nature, 412, 49
- Ibata et al. (2007) Ibata, R., Martin, N. F., Irwin, M., Chapman, S., Ferguson, A. M. N., Lewis, G. F., & McConnachie, A. W. 2007, ApJ, 671, 1591
- Ilbert et al. (2006) Ilbert, O., et al. 2006, A&A, 457, 841
- Irwin & Lewis (2001) Irwin, M. & Lewis, J. 2001, NewA Rev., 45, 105
- Irwin (1985) Irwin, M. J. 1985, MNRAS, 214, 575
- Irwin (1997) Irwin, M. J. 1997, in 7th Canary Islands Winter School, ed. J. M. Espinoza (Cambridge: Cambridge Univ. Pr.), 35
- Irwin et al. (2005) Irwin, M. J., Ferguson, A. M. N., Ibata, R. A., Lewis, G. F., & Tanvir, N. R. 2005, ApJ, 628, L105
- Irwin et al. (2004) Irwin, M. J., et al. 2004, in Vol. 5493, Society of Photo-Optical Instrumentation Engineers (SPIE) Conference Series, ed. P. J. Quinn & A. Bridger, 411–422
- Irwin & Trimble (1984) Irwin, M. J. & Trimble, V. 1984, AJ, 89, 83
- Jurić et al. (2008) Jurić, M., et al. 2008, ApJ, 673, 864
- Kalirai et al. (2006) Kalirai, J. S., et al. 2006, ApJ, 648, 389
- Kennicutt (1998) Kennicutt, Jr., R. C. 1998, ARA&A, 36, 189
- Kennicutt (2007) Kennicutt, Jr., R. C. e. a. 2007, ApJ, 671, 333
- Kent (1987) Kent, S. M. 1987, AJ, 93, 816
- Kong et al. (2000) Kong, X., et al. 2000, AJ, 119, 2745
- Larsen & Humphreys (2003) Larsen, J. A. & Humphreys, R. M. 2003, AJ, 125, 1958
- Larson (1974) Larson, R. B. 1974, MNRAS, 169, 229
- Lupton et al. (2004) Lupton, R., Blanton, M. R., Fekete, G., Hogg, D. W., O’Mullane, W., Szalay, A., & Wherry, N. 2004, PASP, 116, 133
- Makarova et al. (2002) Makarova, L. N., et al. 2002, A&A, 396, 473
- Marigo et al. (2008) Marigo, P., Girardi, L., Bressan, A., Groenewegen, M. A. T., Silva, L., & Granato, G. L. 2008, A&A, 482, 883
- Martin & Kennicutt (2001) Martin, C. L. & Kennicutt, Jr., R. C. 2001, ApJ, 555, 301
- Martínez-Delgado et al. (1999) Martínez-Delgado, D., Aparicio, A., & Gallart, C. 1999, AJ, 118, 2229
- McConnachie et al. (2007) McConnachie, A. W., Arimoto, N., & Irwin, M. 2007, MNRAS, 379, 379
- McConnachie et al. (2006) McConnachie, A. W., Chapman, S. C., Ibata, R. A., Ferguson, A. M. N., Irwin, M. J., Lewis, G. F., Tanvir, N. R., & Martin, N. 2006, ApJ, 647, L25
- Miyazaki et al. (2002) Miyazaki, S., et al. 2002, PASJ, 54, 833
- Möllenhoff (2004) Möllenhoff, C. 2004, A&A, 415, 63
- Morrison et al. (1997) Morrison, H. L., Miller, E. D., Harding, P., Stinebring, D. R., & Boroson, T. A. 1997, AJ, 113, 2061
- Mouhcine et al. (2007) Mouhcine, M., Rejkuba, M., & Ibata, R. 2007, MNRAS, 381, 873
- Mouhcine et al. (2005) Mouhcine, M., Rich, R. M., Ferguson, H. C., Brown, T. M., & Smith, T. E. 2005, ApJ, 633, 828
- Naylor (1998) Naylor, T. 1998, MNRAS, 296, 339
- Neeser et al. (2002) Neeser, M. J., Sackett, P. D., De Marchi, G., & Paresce, F. 2002, A&A, 383, 472
- Newberg & Yanny (2006) Newberg, H. J. & Yanny, B. 2006, J. Phys.: Conf. Ser., 47, 195
- Pohlen & Trujillo (2006) Pohlen, M. & Trujillo, I. 2006, A&A, 454, 759
- Regan & Vogel (1994) Regan, M. W. & Vogel, S. N. 1994, ApJ, 434, 536
- Reitzel & Guhathakurta (2002) Reitzel, D. B. & Guhathakurta, P. 2002, AJ, 124, 234
- Richardson et al. (2009) Richardson, J. C., et al. 2009, MNRAS, 396, 1842
- Robertson & Kravtsov (2008) Robertson, B. E. & Kravtsov, A. V. 2008, ApJ, 680, 1083
- Robin et al. (1996) Robin, A. C., Haywood, M., Creze, M., Ojha, D. K., & Bienayme, O. 1996, A&A, 305, 125
- Robin et al. (2003) Robin, A. C., Reylé, C., Derrière, S., & Picaud, S. 2003, A&A, 409, 523
- Sabbi et al. (2008) Sabbi, E., Gallagher, J. S., Smith, L. J., de Mello, D. F., & Mountain, M. 2008, ApJ, 676, L113
- Schaye & Dalla Vecchia (2008) Schaye, J. & Dalla Vecchia, C. 2008, MNRAS, 383, 1210
- Schlegel et al. (1998) Schlegel, D. J., Finkbeiner, D. P., & Davis, M. 1998, ApJ, 500, 525
- Seth et al. (2005) Seth, A. C., Dalcanton, J. J., & de Jong, R. S. 2005, AJ, 129, 1331
- Shaw & Gilmore (1990) Shaw, M. A. & Gilmore, G. 1990, MNRAS, 242, 59
- Sirianni et al. (2005) Sirianni, M., et al. 2005, PASP, 117, 1049
- Soubiran et al. (2003) Soubiran, C., Bienaymé, O., & Siebert, A. 2003, A&A, 398, 141
- Tikhonov et al. (2005) Tikhonov, N. A., Galazutdinova, O. A., & Drozdovsky, I. O. 2005, A&A, 431, 127
- Tsikoudi (1979) Tsikoudi, V. 1979, ApJ, 234, 842
- Weisz et al. (2008) Weisz, D. R., Skillman, E. D., Cannon, J. M., Dolphin, A. E., Kennicutt, Jr., R. C., Lee, J., & Walter, F. 2008, ApJ, 689, 160
- Williams et al. (2008) Williams, B. F., et al. 2008, AJ, 137, 419
- Willner et al. (2004) Willner, S. P., et al. 2004, ApJS, 154, 222
- Wong & Blitz (2002) Wong, T. & Blitz, L. 2002, ApJ, 569, 157
- Yoachim & Dalcanton (2006) Yoachim, P. & Dalcanton, J. J. 2006, AJ, 131, 226
- Yoachim & Dalcanton (2008a) —. 2008a, ApJ, 683, 707
- Yoachim & Dalcanton (2008b) —. 2008b, ApJ, 682, 1004
- Yun (1999) Yun, M. S. 1999, in IAU Symp. 186, Galaxy Interactions at Low and High Redshift, ed. J. E. Barnes & D. B. Sanders (Paris: IAU), 81
- Yun et al. (1994) Yun, M. S., Ho, P. T. P., & Lo, K. Y. 1994, Nature, 372, 530
- Zackrisson et al. (2006) Zackrisson, E., Bergvall, N., Östlin, G., Micheva, G., & Leksell, M. 2006, ApJ, 650, 812
- Zaritsky (1999) Zaritsky, D. 1999, AJ, 118, 2824
- Zaritsky et al. (1994) Zaritsky, D., Kennicutt, Jr., R. C., & Huchra, J. P. 1994, ApJ, 420, 87
- Zibetti & Ferguson (2004) Zibetti, S. & Ferguson, A. M. N. 2004, MNRAS, 352, L6
- Zibetti et al. (2004) Zibetti, S., White, S. D. M., & Brinkmann, J. 2004, MNRAS, 347, 556