Double and single pion photoproduction within a dynamical coupled-channels model
Abstract
Within a dynamical coupled-channels model that has already been fixed by analyzing the data of the and reactions, we present the predicted double pion photoproduction cross sections up to the second resonance region, GeV. The roles played by the different mechanisms within our model in determining both the single and double pion photoproduction reactions are analyzed, focusing on the effects attributable to the direct mechanism, the interplay between the resonant and nonresonant amplitudes, and the coupled-channels effects. The model parameters that can be determined most effectively in the combined studies of both the single and double pion photoproduction data are identified for future studies.
pacs:
13.75.Gx, 13.60.Le, 14.20.GkI Introduction
The spectrum and structure of low-lying nucleon and resonances (collectively referred as ) are primordial information for any understanding of the nonperturbative QCD domain. Consequently, a great effort has been made at the Excited Baryon Analysis Center (EBAC) during the past few years to extract the properties of from the world data on and data bl04 .
It is well acknowledged nowadays that a proper extraction and further interpretation of properties require the construction of reaction models that maintain the unitarity of most relevant channels and can correlate the vast amount of data for both the single and double meson production reactions. Among the existing theoretical approaches, the one taken at EBAC tries to encompass the aforementioned by considering the interactions among the , , , and channels within a multichannel, multiresonance framework msl07 . After constraining the hadronic part of the model by fitting jlms07 the scattering data, we have performed our first studies of single pion photoproduction jlmss08 and electroproduction reactions jklmss09 .
As discussed in our previous works, the hadronic part of the model was constrained mostly using experimental data. This means that the couplings of the to the , and channels, which are the quasi-two-body channels of the , are necessarily not well constrained in the current version of the model. To this extent, double pion photoproduction reactions are important for understanding the way couple to the channel, and thus to refine our global dynamical coupled-channels framework. In Ref. kjlms09 , we carried out such a study for reactions with the predicted cross sections in reasonable agreement with the available data. In this work, we extend that work to investigate double pion photoproduction reactions by comparing our predictions with the total cross sections data a68 ; b95 ; wo00 ; la01 ; a03 ; ah03 ; ah05 and invariant mass distributions wo00 ; la01 ; be04 . We first present the predictions of our model for the double pion photoproduction reactions up to GeV. We then analyze how the discrepancies with the data are sensitive to which of the electromagnetic parameters of the model, as a step toward performing the combined fits of the world data on reactions.
Most of the previous investigations of the double pion photoproduction reactions employed the tree-diagram models gomez95 ; ochi97 ; nacher00 ; fix05 , emphasized the roles of certain resonances on specific double pion photoproduction reactions, or focused on the very near threshold region using chiral perturbation theory ch1 ; ch2 . In our approach, we do not make such simplifications. We perform the full coupled-channels calculations and include all channels and states determined in Refs. jlms07 ; jlmss08 .
The basic formulas used in this work are presented in Sec. II. In Sec. III we present the predictions of the current model and analyze the contributions from the direct mechanism and the transitions from to the unstable , and states. In Sec. IV we scrutinize the contribution of each of the helicity amplitudes on both single pion and double pion photoproduction reactions. A summary and some conclusions are given in Sec. V.
II Basic formulas
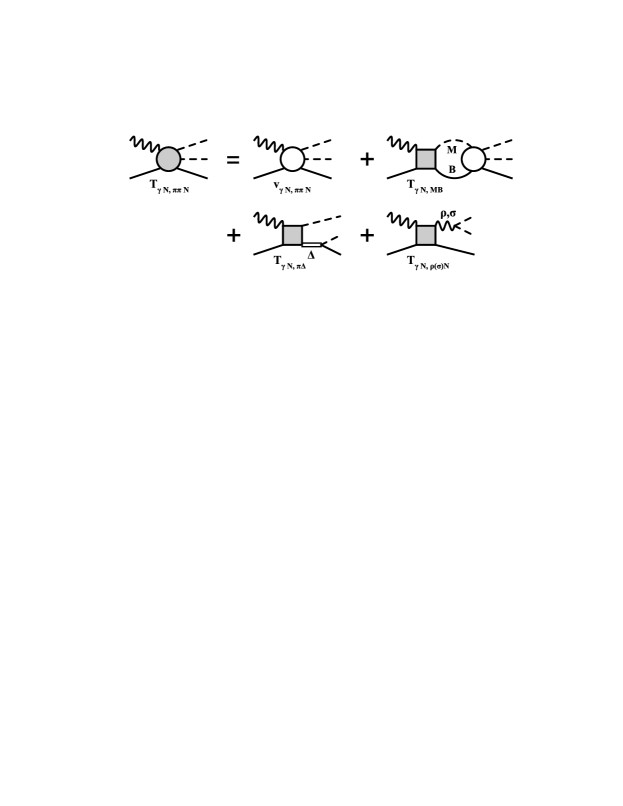
Within the EBAC dynamical coupled-channels (EBAC-DCC) model, the amplitude consists of four pieces msl07 (see Fig. 1):
| (1) |
with
| (2) |
with,
| (3) | |||||
| (4) | |||||
| (5) |
Here , , and describe the , , and decays, respectively; () are the meson-baryon Green’s functions. represents the direct transition potentials illustrated in Fig. 2. The processes described by are not contained in the , and thus there is no double counting.

The transition amplitudes can be divided into the so-called nonresonant and resonant amplitudes (suppressing angular momentum, isospin, and momentum indices),
| (6) |
with
| (7) |
and
| (8) |
In Eq. (7), represents the transition potential derived from tree diagrams of a set of phenomenological Lagrangians describing the interactions among , , , , , , , and (1232) fields. The details are given explicitly in Appendix F of Ref. msl07 . The dressed vertex function appearing in Eq. (8) is defined by
| (9) |
where denotes the bare vertex within the EBAC-DCC model and is parametrized as
| (10) |
where is defined by the mass .
Within our model, the meson-baryon Green function , the hadronic nonresonant amplitude , the dressed propagator , and the dressed vertex function are purely hadronic processes. We take these hadronic pieces from the model constructed from analyzing the data of scattering jlms07 , and keep them fixed throughout this paper.
The calculation of the terms with , defined by Eqs. (3)-(5), is straightforward. However, the calculation of the second term of , defined by Eq. (2), is much more complex. To simplify the calculation, we employ the same prescription as in the calculation of the reactions kjlms09 . This is based on the observation that the processes illustrated in Figs. 2(a)-2(d) can be written as
| (11) |
where is the sum of the all processes illustrated in Figs. 2(a)-2(d), is the two-body potential, and is the vertex function. Taking account of only a part of that can be approximately expressed as , Eq. (2) can be written as
Here in the last step we have used the relation . We use Eq. (LABEL:eq:tpipin-dir2) which can be calculated with all parameters taken from our previous analysis of reactions.
The formulas for calculating total cross sections and invariant mass distributions from our amplitudes can be found in Ref. kjlms09 and are not shown here.
III Analysis of the direct reaction mechanisms and the coupled-channels effect
With the parameters determined from our previous analysis of reactions jlms07 ; jlmss08 , the results presented in this section are pure predictions within the current model developed in EBAC. We first present our results of the double pion photoproduction reactions, and then examine how the reactions mechanisms within our model determine the cross sections.
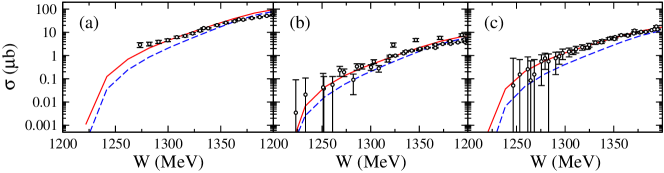
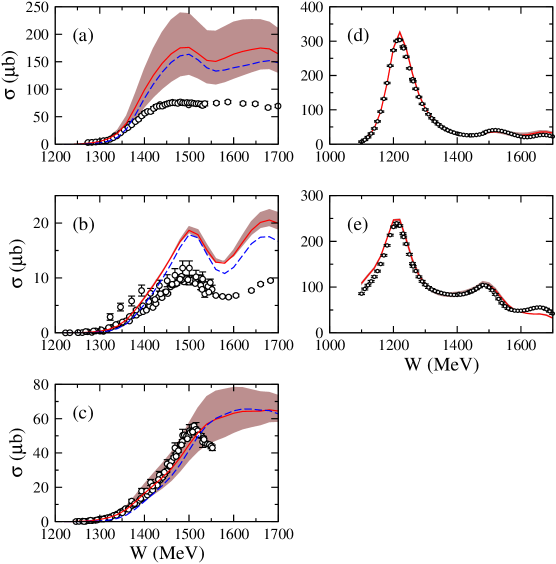
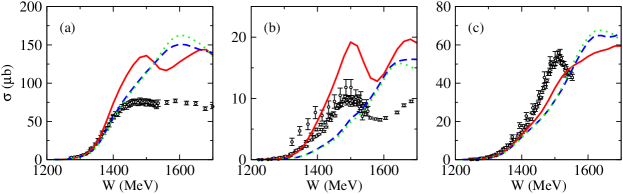
In Fig. 3, we find that our current model (red solid curve) has a good agreement with the total cross sections in the energy region up to GeV. We observe that the direct amplitude can greatly improve the model to reproduce the near threshold behavior of the total cross section data. Its effects in higher are shown in Figs. 4(a), 4(b), and 4(c). The red solid curves are the predictions from our full calculations and the blue dashed curves are from turning off the term (the bands in the figure will be explained later in this paper). We see that the effect of is sizable on [Fig. 4(a)] and [Fig. 4(b)], and negligible on [Fig. 4(c)]. It is clear that its inclusion does not change the energy dependence of the total cross sections for any of the considered reactions.
Although the threshold behavior is in general well reproduced as can be seen in Fig. 3, our predictions at higher shown in Fig. 4 clearly overestimate the experimental data above GeV in both and reactions, while the results of are good up to GeV. However, our current model reproduces the reactions quite well in the considered energy region, as seen in the right panels of Fig. 4. This fact indicates that there exist reaction processes which have significant effect on the observables of , but not of .
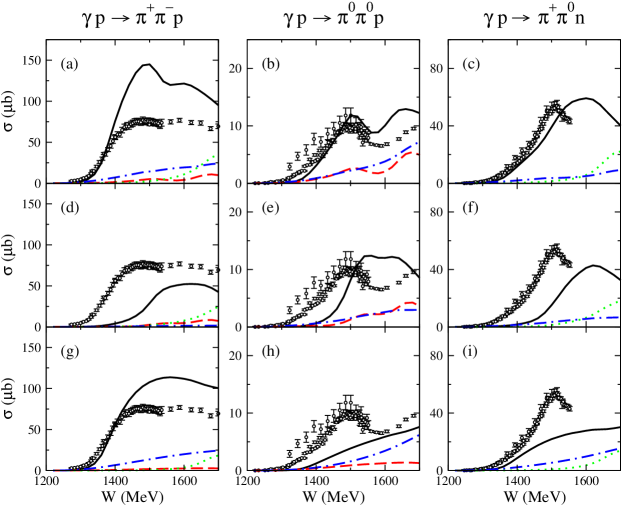
To get some insights into our disagreement with the data and to guide our future combined analysis of all reactions, we examine which mechanisms are most relevant to our calculations in this energy region. We first examine the contributions of each process appearing in Eqs. (2)-(5). The results from the full amplitude are shown in the top row of Fig. 5: (black solid), (red dashed), (green dotted), and (blue dash-dotted). The figures in the left, middle, and right columns are of the , , and total cross sections, respectively.
We also show in the middle (bottom) row of Fig. 5 the results for which the full two-body amplitude in Eqs. (3)-(5) and (LABEL:eq:tpipin-dir2) is replaced with its resonant (nonresonant) part (). Thus we can examine the relative importance between different mechanisms in resonant and nonresonant amplitudes separately. Note that the curves describing the () process are not seen in the () total cross sections because the corresponding terms do not contribute because of isospin selection rules. In Figs. 5(a)-5(c), we clearly see that the full processes (black solid curves) have the largest contribution compared to the other processes. By comparing Figs. 5(a) and 5(g), we further find that the large discrepancy with the data is attributable mainly to the nonresonant amplitude. The dominance of the nonresonant in all three reactions can also be seen in the bottom panels of Fig. 5.
Most of the nonresonant transition matrix elements considered in our model depend on the coupling constant (see Ref. msl07 for the details). We thus examine how our predictions are sensitive to this coupling strength. This is illustrated in Fig. 4 where we have presented bands, which are generated by varying included in the transition matrix elements by . Clearly such changes in have a great influence on (top) and (bottom), and less of an influence on (middle). Within our dynamical coupled-channels model, the process also enters in the single pion photoproduction reactions as a consequence of the unitarity, and thus its change consistently affects the single pion photoproduction observables, too. As can be seen in the right panels of Fig 4, its importance turns out to be very minor in the total cross sections. The bands from varying in by are not visible. From this observation, in the remainder of this paper we will use a 20% smaller value for the appearing in the electromagnetic potentials. The value turns out to be very close to that of the quark model.
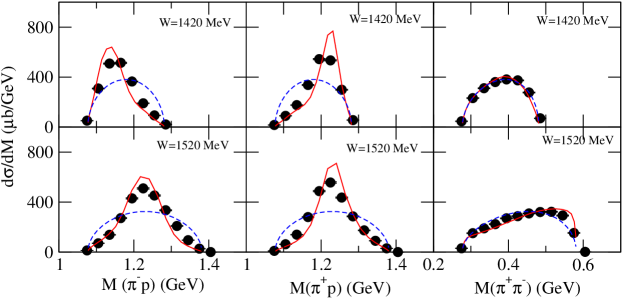
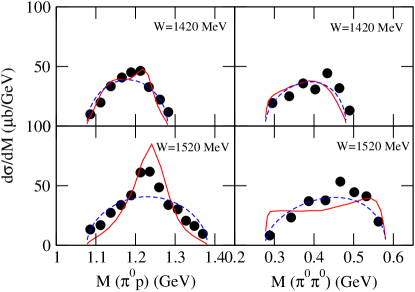
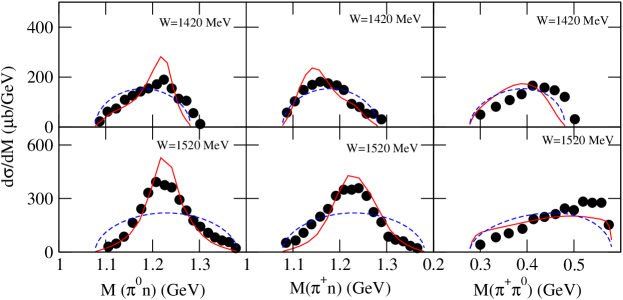
In Figs. 6-8, we show the predicted invariant mass distributions of , , and , respectively. To compare with the shapes of the data, the overall magnitudes of our predictions (red solid curves) are normalized to have the same integrated values of the data. We can see that the shapes of the predicted invariant mass distributions are in reasonable agreement with the data for all cases considered, while deviations are seen in several invariant mass distributions (right panels of Figs. 6-8).
This is found to be attributable to the fact that the distributions are dominated by the in the process, while the distributions involve the interferences among all of the amplitudes. The results of the invariant mass distributions have provided useful information for improving our current model. In particular, the deviations from the data in the distributions of the channel at high invariant mass (right panels of Fig.8) suggest that the parameters associated with the channels will need to be modified.
The most relevant novelty of the present study is the use of a dynamical coupled-channels model. In Fig. 9, we show the coupled-channels effects associated with the electromagnetic interactions on the total cross sections, which is demonstrated here for the first time in the investigations of double pion photoproduction reactions. The red solid curves are our full results. The green dotted curves are the results in which only the diagonal part () is taken in the summation of Eqs. (7) and (9), and the blue dashed curves are obtained by further setting and . These correspond to examining the coupled-channels effect associated with the electromagnetic interactions. (Note again that the pure hadronic part of the amplitudes is fixed with the model determined in Ref. jlms07 throughout this paper.) In the considered energy region up to GeV, we find that the blue dashed and green dotted curves almost overlap with each other but both of them are quite different from our full results (red solid curves). This suggests that the structure in the total cross sections is attributable mostly to the couplings between reaction channels.
Before closing this section, we comment on the recent measurements of the polarization observables. It was shown in Refs. st05 ; kr09 that existing reaction models have significant discrepancies in the beam-helicity asymmetry measured at CLAS st05 and more recently at MAMI kr09 . We have observed that our current model also produces similar discrepancies to that of other works shown in Refs. st05 ; kr09 . These results indicate that the polarization observables will provide critical information on constraining reaction models and understanding the states.
IV Effects of resonances
The bare helicity amplitudes, defined in Eq. (10), are free parameters in our framework. They quantify the photoexcitation of the core states and, together with their dressed counterparts, are to be interpreted by means of microscopic models (e.g., quark models, lattice QCD calculations). Although are taken to be real numbers, the dressed helicity amplitudes, which have in general a sizable contribution from the second term in Eq. (9), are complex numbers. This second term contains the meson-cloud contribution to the vertex, which is to a large extent fixed from the strong interaction sector.
In this section we present the effect on the single and double pion photoproduction observables of variations on the bare helicity amplitudes, which affect directly the dressed ones, see Eq. (9). This will be done by presenting results computed by varying the initial value of the bare helicity amplitudes listed in Table 1, by . The results are presented as bands in the figures, these bands are generated by filling the region enclosed by curves from two calculations using and .
Before proceeding to showing our results, we comment on the bare helicity amplitudes presented in Table 1. Those values are not exactly the same as those of our previous analysis jlmss08 . There we did not provide any measure of the uncertainty in the bare helicity amplitudes that resulted from fitting the photoproduction data. In the current paper we have varied the binning of the data and thus some of the less constrained helicities resulting from the fit are varied. In the following we will quantify the effect of such variations, providing a clear indicator of the dependence of our results for both single and double pion production on the helicity amplitudes.
IV.1 S-wave s
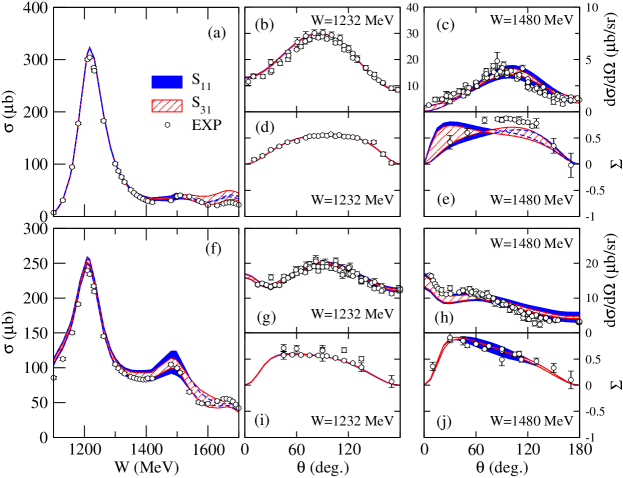
We start the comparison with the and (1620). In Fig. 10 we show the effect of varying their helicity amplitudes on the single pion photoproduction data. The sample data we consider are the total cross sections (left panels) for and and differential cross sections and polarization data in the region (middle panels) and in the MeV region (right panels).
First we note that the change in helicity amplitudes for the resonance plays an important role in building the peak near the MeV region for both total cross sections[see Figs. 10(a) and 10(f)] and correspondingly in the differential cross section near the MeV region [see Figs. 10(c) and 10(h)]. The gives a prominent contribution in the whole energy region above the (1232) region, as indicated by the oblique-lined bands. The also affects the forward peaking of the differential cross section data around MeV [see Fig. 10(h)]. Their influence on the photon asymmetry is sizable and qualitatively similar for both resonances, being negligible in the region.
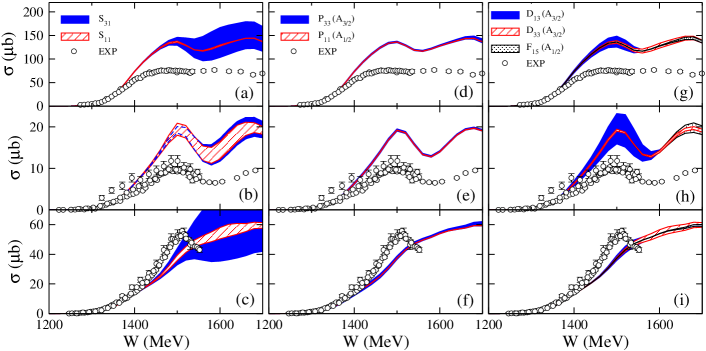
Now we turn to the double pion photoproduction reactions, see left column of Fig. 11. First, as expected, and the same occurs for all resonances considered, the helicities have no influence on the near threshold behavior. Second, both S-wave resonances play a relevant role for the considered reactions. Modifying the of the (1535), the total cross sections for and can vary up to , although there is no qualitative change in the energy dependence of the total cross sections [see Figs. 11(b) and 11(c)]. The case is similar, but actually affects all the reactions. A smaller value of the helicity amplitude is suggested by these results. Within our model, none of the peaks seen in the total cross section data can be ascribed solely to S-wave resonances.
IV.2 P-wave s
The helicity amplitudes of the (1232) resonance are essentially fixed by analyzing data near its nominal mass, as has long been known. In Fig. 12 we fully confirm this. The effect of variations on both and of the is well localized around its peak but reaches up to 300 MeV above it in the reaction [see Figs. 12(a)-12(e)]. This can also be seen in their influence on the photon asymmetry at MeV. The mostly affects the perpendicular angles, while the affects the forward and backward angles. The Roper resonance plays a minor role, with no sizable trace in the observables.
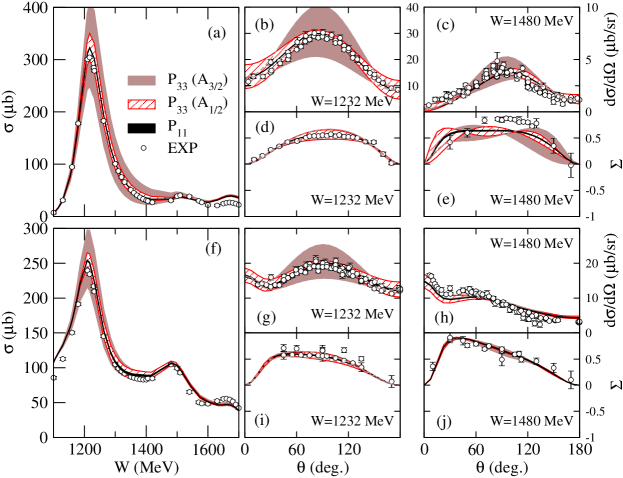
In the double pion photoproduction case, however (see middle column of Fig. 11), the transition processes of both and play almost no role in the entire considered region. Let us point out that we refer here to the influence of the as an s-channel exchange, the importance of the in this reaction is of course large, as pointed out in Sec. III, where we show that most of the reaction flows through the channel.
IV.3 D and F-wave s
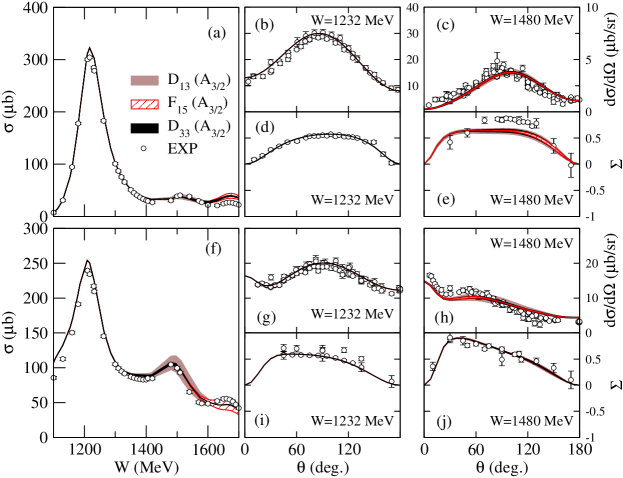
Let us first study the influence of the helicity amplitudes on the single pion photoproduction. The is responsible for part of the second peak near 1500 MeV in the total cross sections [see Fig. 13(f)]. The (1680) contributes to the third peak in both total cross sections. In the middle and right panels of Fig. 13, we see that none of the changes of , and helicity amplitudes affect much the and observables.
wave resonances have long been advocated as being responsible for most of the structure observed in the total cross sections for . The first peak in the total cross sections has been explained in tree level calculations thanks to the (1520) ochi97 ; gomez95 ; fix05 and to interferences with the nacher00 . In our coupled-channels model we confirm the very important role played by the (1520), which builds up a large fraction of the first peak in the reaction [see the right panels in Fig. 11]. On the other hand its effect is also sizable on the total cross section, producing an overprediction of this observable in our model. As in the tree-diagram models of Refs. ochi97 ; gomez95 ; fix05 the peak structure in this reaction is always much more pronounced in the models than in the experimental data. Effects of the are sizable only on the , similar to what was reported in Ref. nacher00 , but they do not produce a peak structure as the experimental data show.
V Summary and conclusions
Within the dynamical coupled-channels model constructed from analyzing the single pion production reactions jlms07 ; jlmss08 , we have investigated the total cross sections and the invariant mass distributions for the double pion photoproduction reactions off the proton in the energy region up to GeV. In the low-energy region up to GeV, our results agree well with the total cross sections data, in which the direct process plays a crucial role for the reproduction of the data. Above GeV, our current model starts to overestimate the data for and . We have found that the process is most relevant for the reactions and is a major origin of the overestimation in the total cross section. Our model reproduces well the shapes of the invariant mass distributions data except for several invariant mass distributions of and . We expect that this deviation provides useful information to improve our current model. Also, we have demonstrated the coupled-channels effects on the double pion photoproduction case, which is of similar size to the case.
It is noted that our current model describes the single pion photoproduction observables in the same energy region quite well. We thus have examined the origins of our disagreements with the data by considering both the single and the double photoproduction reactions. We have found that the coupling constant in the transition matrix element plays an important role. If we reduce its strength determined in Ref.jlms07 by 25 % to a value close to the quark model value, the magnitude of the total cross section is drastically reduced, while the corresponding changes in the single pion photoproduction observables are negligible. This finding indicates that a smaller value of will be needed in a combined analysis of the world data of reactions.
We have also investigated the sensitivity of each process to the and reactions. The , and processes are found to have significant influence on both the single and the double pion photoproduction observables. In particular, will be key to fixing the overestimation at the first peak of around GeV. As for the wave resonances, the process is critical for describing the observables up to GeV, while it plays almost no role for the total cross sections and invariant mass distributions of reactions. The process just has a negligible contribution to the observables considered in this paper. This result for the is consistent with the recent analysis in Ref. elsa . The states that are found to be important in determining the single and double photoproduction reactions are indicated in the second and third columns of Table 1.
The results in this paper show clearly that in general the analysis of the single pion production reactions is not enough to pin down the amplitudes associated with the electromagnetic interactions. To extract the reliable information on the states below GeV, at least one needs to perform simultaneous analysis of the single and double pion production reactions. Currently, this is one of the main efforts at EBAC.
Acknowledgements.
The authors would like to thank Dr. V. Mokeev for sending the invariant mass distribution data from CLAS. This work is supported by the U.S. Department of Energy, Office of Nuclear Physics Division, under Contract No. DE-AC02-06CH11357, and Contract No. DE-AC05-06OR23177 under which Jefferson Science Associates operates Jefferson Lab, by the Japan Society for the Promotion of Science, Grant-in-Aid for Scientific Research(C) 20540270; and by a CPAN Consolider INGENIO CSD 2007-0042 contract and Grant No. FIS2008-1661 (Spain). This work used resources of the National Energy Research Scientific Computing Center, which is supported by the Office of Science of the U.S. Department of Energy under Contract No. DE-AC02-05CH11231.References
- (1) V. Burkert and T.-S. H. Lee, Int. J. of Mod. Phys. E13, 1035 (2004).
- (2) A. Matsuyama, T. Sato, and T.-S. H. Lee, Phys. Rep. 439, 193 (2007).
- (3) B. Juliá-Díaz, T.-S. H. Lee, A. Matsuyama, and T. Sato, Phys. Rev. C 76, 065201 (2007).
- (4) B. Juliá-Díaz, T.-S. H. Lee, A. Matsuyama, T. Sato, and L. C. Smith, Phys. Rev. C 77, 045205 (2008).
- (5) B. Juliá-Díaz, H. Kamano, T.-S. H. Lee, A. Matsuyama, T. Sato, N. Suzuki, Phys. Rev. C 80, 025207 (2009).
- (6) H. Kamano, B. Juliá-Díaz, T.-S. H. Lee, A. Matsuyama, and T. Sato, Phys. Rev. C 79, 025206 (2009).
- (7) ABBHHM Collaboration, Phys. Rev. 175, 1669 (1968).
- (8) A. Braghieri et al., Phys. Lett. B 363, 46 (1995).
- (9) M. Wolf, et al., Eur. Phys. J. A 9, 5, (2000).
- (10) W. Langgärtner, et al., Phys. Rev. Lett. 87, 052001, (2001).
- (11) Y. Assafiri et al., Phys. Rev. Lett. 90, 222001 (2003).
- (12) J. Ahrens et al. (GDH and A2 Collaborations), Phys. Lett. B 551, 49 (2003).
- (13) J. Ahrens et al. (GDH and A2 Collaborations), Phys. Lett. B 624, 173 (2005).
- (14) M. Bellis et al. (CLAS Collaboration), in Proceedings of NSTAR2004 Workshop, Grenoble, 2004, edited by J.-P. Bocquet, V. Kuznetsov, and D. Rebreyend (World Scientific) p. 189.
- (15) J. A. Gomez Tejedor and E. Oset, Nucl. Phys. A 600, 413 (1996); Nucl. Phys. A 571, 667 (1994).
- (16) K. Ochi, M. Hirata and T. Takaki, Phys. Rev. C 56, 1472 (1997).
- (17) J. C. Nacher, E. Oset, M. J. Vicente Vacas and L. Roca, Nucl. Phys. A 695, 295 (2001).
- (18) A. Fix and H. Arenhovel, Eur. Phys. J. A 25, 115 (2005).
- (19) M. Benmerrouche and E. Tomusiak, Phys. Rev. Lett. 73, 400 (1994).
- (20) V. Bernard, N. Kaiser, U. G. Meissner and A. Schmidt, Nucl. Phys. A 580, 475 (1994).
- (21) CNS Data Analysis Center, George Washington University, http://gwdac.phys.gwu.edu.
- (22) S. Strauch et al. (CLAS Collaboration), Phys. Rev. Lett. 95, 162003 (2005).
- (23) D. Krambrich et al. (Crystal Ball at MAMI, TAPS, and A2 Collaborations), Phys. Rev. Lett. 103, 052002 (2009).
- (24) A. V. Sarantsev et al. (CB-ELSA and A2-TAPS Collaborations), Phys. Lett. B659, 94 (2008).