Measuring sub-Planck structural analogues in chronocyclic phase space
Abstract
The phase space structure of certain quantum states reveals structure on a scale that is small compared to the Planck area. Using an analog between the wavefunction of a single photon and the electric field of a classical ultrashort optical pulse we show that spectral shearing interferometry enables measurement of such structures directly. Thereby extending the idea of Praxmeyer et al. In particular, we use multiple-shear spectral interferometry to fully characterize a pulse consisting of two sub-pulses which are temporally and spectrally disjoint, without a relative-phase ambiguity. This enables us to compute the Wigner distribution of the pulse. This spectrographic representation of the pulse field features fringes that are tilted with respect to both the time- and frequency axes, showing that in general the shortest sub-Planck distances may not be in the directions of the canonical (and easily experimentally accessible) directions. Further, independent of this orientation, evidence of the sub-Planck scale of the structure maybe extracted directly from the measured signal.
1 Classical and quantum wave fields
The electromagnetic field is a proxy for the wavefunction of a single photon [1]. That is, a spatio-temporally localized optical pulse field plays the role of a probability density function (with suitable normalization) for the measurement of a single quantum of light [2]. Interference phenomena that are observed with classical fields therefore bear a close relationship to quantum interference phenomena for single particles, and this provides a route to exploring quantum phase space structures in a simple way. It is not perhaps surprising that there is a similarly close relationship between the characterization of a classical ultrafast optical pulse (i.e. the measurement of its electric field) and the quantum state tomography of a single photon, and this analog may be used to apply recently developed measurement techniques in ultrafast optics to the study of quantum phase space. Krzysztof Wodkiewicz exploited this analog to effect in a number of directions, most recently in a study of so-called sub-Planck phase-space structures discovered by Zurek.
The key elements of state tomography for localized photons are the same as those required to fully characterize the electric field of a short optical pulse. The central idea for this is related to the Wodkiewicz-Eberly notion of the “physical spectrum”, which is simply the time-resolved intensity of a spectrally filtered pulse [3],
| (1) |
with the input pulsed electric field, and the time-stationary causal response function of the linear filter. Here, is the passband frequency of the filter, which acts as a spectrometer, and can be tuned. This formulation provides a basis for developing methods for measuring , even using slow detectors [4]. In fact, the signal, considered as a function of the two variables and is a sonogram of the input pulse. That is, a positive-definite phase-space representation of a field (as we consider only pulsed sources in this paper, we shall assume the input field has compact support), obtained by selecting a narrow spectral component of the pulse, and measuring its time-dependent intensity after the filter. By adjusting the passband frequency and measuring the temporal intensity at each frequency, a time-frequency representation - the sonogram - is built up.
More generally, the fast-responding detector that is required for measuring Eberly-Wodkiewicz physical spectrum can be replaced by a slow, time-integrating detector in front of which there is a time-non-stationary linear filter, such as a fast shutter. This may be modelled as a linear filter with response function , such that the filter transmission is unity for a small time window near . The transmitted field after this ”time gate” is
| (2) |
A more common approach to the characterization of ultrashort optical pulses involves these two elements in reverse order. That is, a temporal slice of the test pulse field is taken using a shutter, and the transmitted spectrum measured using a spectrometer and a slow detector. The resulting positive definite time-frequency representation of the pulse is a spectrogram. In fact, if the spectrometer passband is very narrow, the detected signal is closely related to a Gabor transform
| (3) |
By adjusting the passband frequency and the delay , over a sufficient range, it can be shown that the detected signal is tomographically complete. That is, it can be inverted to extract . It is easy to see from the form of the signal that it has the structure of a phase-space representation. Indeed, if is a Gaussian, the functional form is just that of the Husimi distribution in quantum physics (or the Q-function in quantum optics) for a pure quantum state. Therefore one might expect interference effects parallel to those of interest in quantum systems to appear in the spectrogram.
One approach to measuring the electric field based on spectrograms is frequency-resolved optical gating (FROG) [5], in which the “gate function” of (3), , is implemented by means of a nonlinear optical interaction. The test pulse field is commonly mixed with a time-delayed replica of itself in a material with a nonlinear response. This generates the nonlinear spectrogram
| (4) |
Extracting the field from this nonlinear spectrogram requires an iterative deconvolution algorithm [6]. However, for the purposes of the measurements required in what follows this is not necessary.
The Gabor spectrogram is a particular example of a general scheme for pulse characterization that involves a sequence of two linear filters. In that case, it is a time-non-stationary amplitude filter (effectively a shutter) followed by a time-stationary amplitude filter (a spectrometer), as depicted in Fig. 1(a). There are four possible minimal sequences comprised of amplitude and phase-only filters.

These may be categorized both by the particular configuration of filters and by the algorithm used to extract the field from the signal [7].
A complementary approach is to use the filters in parallel. There are similarly four possible configurations [8] of apparatus in which the input pulses are split into two at a beamsplitter, with each component traversing a filter, one of which is time-stationary, and the other time non-stationary, after which the filtered pulses are recombined and the spectrum of the interfering pair registered. A particular example of this category is spectral shearing interferometry (SSI). In this case one of the filters following the beamsplitter is a phase modulator. The role of this non-stationary phase-only filter is to shift the frequency of the pulse by an amount — the spectral shear. The parallel filter has a time-stationary response, and causes a shift in the arrival time of the second pulse replica — it is a delay line. The pulses are recombined on a second beamsplitter and the joint spectrum measured. The linear filter representation of SSI is given in Fig. 1(b). The resulting spectral interference pattern is
| (5) |
Again, when the modulator inducing the frequency shift is synthesized using nonlinear optics, this approach is called spectral phase interferometry for direct electric field reconstruction (SPIDER) [9]. The field reconstruction in this case is linear and non-iterative. It is based on etracting the spectral phase function of the field . A simple Fourier transform of the signal with respect to enables the interference terms to be separated, and the argument of this term, with a reference phase subtracted, is simply . This sampling of the phase function is sufficient to enable the pulse field to be accurately estimated on the temporal domain .
Using both FROG and SPIDER is it is possible to construct a Wigner phase space representation of the pulse directly. It is this function that is commonly used in quantum mechanics to study nonclassical properties of quantum states. Of particular interest are the types of “sub-Planck” structures discussed by Zurek [10]. He showed that two states with significant overlap in phase space may be in fact orthogonal, even if they are separated in either dimension by a degree that is significantly smaller than the scale implied by Planck’s constant.
Using the measurement methods discussed above, it is also possible to extract directly a signal component that illustrates the important structure of the field. This is a considerably more efficient approach than a full characterization of the field, or, equivalently for single photons, full state tomography. In effect, these components are “witnesses” to the sub-Planck structure of the field. In the next section we introduce sub-Planck structure and describe the measurements necessary for implementing witnesses.
2 Sub-Planck structure
One measure of the sensitivity of a quantum state to perturbations is the size of the smallest displacement in phase space required to make the state orthogonal to the original; that is, for the inner product
| (6) |
between state and its displaced replica to be zero. Zurek showed that this minimum displacement along a given direction in phase space is inversely proportional to the spread of the state in the perpendicular direction. For example, the lowest-order estimate of the “zero-overlap” momentum shift is
| (7) |
i.e. inversely proportional to the root-mean square spread of the state. The size of the zero-overlap shift can be significantly smaller than the Planck scale . This is connected to the existence of phase space structures of dimension given by (7) which appear in the Wigner representation of the state,
| (8) |
By means of arbitrary rotations of phase space, this argument can be applied along any direction in phase space: the smallest displacement leading to orthogonality and the sub-Planck structure both have a size inversely proportional to the spread of the wave function along the perpendicular direction.
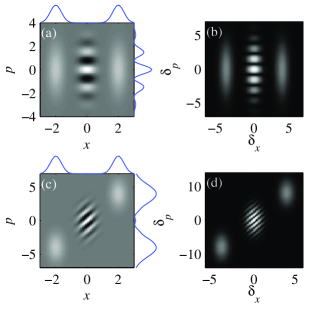
Some examples of Wigner distributions are given in Fig. 2. We use atomic units, with . Fig. 2(a) shows a wavefunction consisting of a superposition of two Gaussian states separated position by . Sub-Planck structure is evident, in the form of interference fringes along the momentum axis. The magnitude of the overlap as a function of is shown in Fig. 2(b). The overlap also contains fringes, modulated proportional to . The smallest shift which produces a zero-overlap, and hence orthogonality, occurs for . For the clarity of Fig. 2, we did not choose to be particuarly large, but it is clear that as increases both the fringe period and area can decrease well below their respective Planck length and area scales.
The sub-Planck structure of the the analogous classical optical field, with time and frequency substituted for position and momentum, has been studied by Wódkiewicz and coworkers [11]. The Wigner distribution of a double pulse, consisting of two identical sub-pulses with time delay , contains spectral interference fringes of period To directly observe the scalar product, Wódkiewicz and others pointed out that the spectrum of the second harmonic of an ultrashort pulse
| (9) |
is equivalent to the scalar product of the pulse with a frequency shifted replica
| (10) |
when the electric field has flat temporal phase so that the presence of the complex conjugate in (10) makes no difference. Using Frequency-Resolved Optical Gating (FROG) they directly observed the scalar product for various frequency displacements.
This arrangement enables the direct observation of the overlap between a pulse and its frequency-shifted replica, with the additional proviso that the pulse has a linear temporal phase. In many circumstances it is desireable to measure the overlap with arbitrary linear combinations of time- and frequency shifts, and for arbitrary pulses. Fig.2(c) shows a superposition of Gaussian states which are displaced in both position and momentum by . Notably, although the individual states do not overlap in either domain, interference fringes appear in the Wigner distribution aligned parallel to the separation vector. The amplitude of the overlap is shown in Fig. 2(c). In this domain, the central fringe modulation is proportional to , where the wavenumber is perpendicular to the separation . The smallest shift which produces a zero is , again perpendicular to .
We shall now show that the scalar product between a pulse and a time- and frequency-shifted replica is given by the same raw data which is used in SSI. As described in Section 1 above, in SSI the interferometric term
| (11) |
is obtained via Fourier filtering of the interferogram and removal of the carrier phase. For normal pulse reconstruction, the phase of is used to reconstruct the spectral phase of the unknown pulse. However, here we note that by setting , the Fourier transform of along is given by
| (12) | |||||
| (13) |
which is exactly the overlap between the field and replica shifted in frequency and in time. Therefore, the Fourier transform of the filtered sideband provides the overlap directly without any intermediate processing. Zeros of around the origin are witnesses to the sub-Planck structure of the quantum state analogous to the unknown pulse.
In the next section, we describe an experimental setup for observing witnesses to the sub-Planck structure in an ultrashort pulse analagous to the position- and momentum-separated quantum state in Fig. 2(c).
3 Experiment
There are many implementations of SSI that can be used to measure for single frequency shifts. For convenient, single-shot measurement of a continuous range of frequency shifts, we used SEA-CAR-SPIDER [12], a recent twist on SSI that permits the simultaneous acquisition of multiple shears and a precise and robust calibration procedure. The principle of SEA-CAR-SPIDER is shown in Fig. 3.
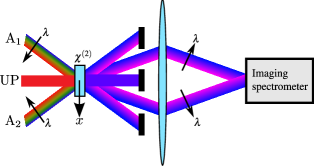
Two spatially chirped fields, known as the ancillae, are prepared and sum-frequency mixed with the unknown pulse in a crystal. The the ancilla beams are oppositely spatially chirped, so that in the crystal their local frequencies at transverse position (indicated in Fig. 3) are . Here, is their common upconversion frequency at and is the amount of spatial chirp. Two upconverted replicas of the unknown pulse are produced, with a relative spectral shear of . These are re-imaged onto an imaging spectrometer, their converging angle producing a spatial interference pattern
| (14) |
where is the wavenumber of the interference fringes, determined by the beam convergence angle. To process this interferogram, either for reconstruction of the phase of the unknown pulse or for determination of the overlap (13), we apply the two-dimensional Fourier transform to the domain. Here, the transforms of the spectral intensities appear at the origin, whilst the interference term between the replicas manifests as two sidebands located at . One of these is isolated and the inverse transform applied. Removing the spatial carrier and using the linear relation between and the shear, we obtain .
The optical pulse analogue to the quantum state of Fig. 2 is a bichromatic double pulse — i.e. two sub-pulses with both a temporal and spectral separation. We synthesized these using a 4-f pulse shaper with a thick glass slide in one half of the Fourier plane, so that frequencies above were delayed. We also placed a thin opaque block at the edge of the glass slide, attenuating frequencies from . Through this procedure, we created a bichromatic double pulse with temporal separation and spectral separation , which we then characterized using the SEA-CAR-SPIDER apparatus.
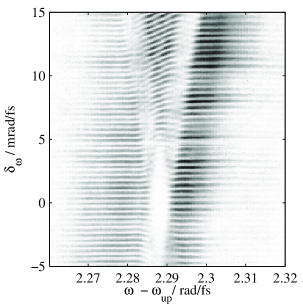
The raw data trace is shown in Fig. 4. The fringe pattern can be interpreted as follows: the phase of each fringe is modulated by . To either side of the spectral gap at , the two frequencies both reside in the same sub-pulse. Each sub-pulse is transform limited, and hence the phase difference between the two frequencies is a constant. The fringes are therefore unmodulated away from the spectral gap. Closer to the spectral gap, and for larger shears, reside in different sub-pulses. Their different group delay produces a phase difference which varies linearly with frequency. The fringes are therefore tilted in this region.
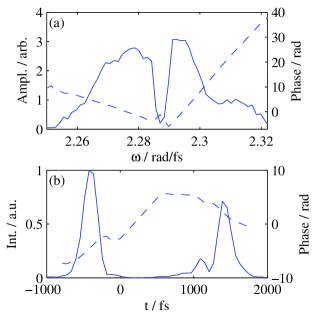
Although our aim was to directly measure the overlap (13), we also reconstructed the pulse to verify our synthesis and to numerically calculate its Wigner function. Because the pulse contained significant gaps in its spectrum, it was necessary to use the multiple shear reconstruction algorithm, [13], a recently developed generalization of standard SSI concatenation procedure [9] which enables the use of a large spectral shear to bridge spectral gaps. The measured spectrum and temporal profile of the bichromatic double pulse is shown in Fig. 5.
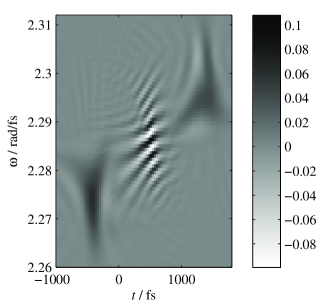
We calculated the Wigner distribution of the measured pulse, shown in Fig. 6. The two peaks at and represent the sub-pulses, whilst the interference fringes between them are aligned parallel to their displacement in phase space. As expected, Fig. 6 bears a close qualitative similarity to Fig. 2(c).
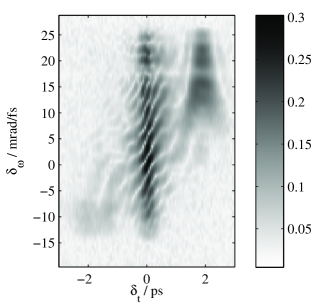
We calculated the overlap of the pulse and its phase-space-displaced replica by Fourier transforming . The result is shown in Fig. 7, and as expected bears a close similarity to Fig. 2(d), with fringe modulation proportional to . Zero overlap occurs whenever .
4 Summary and conclusions
The analogy between the electric field of an ultrashort pulse and the wavefunction of a single photon can be exploited so that classical wave interference in optics mimics quantum interference, enabling observation of phase-space structures that have important implications for dissipative quantum dynamics.
Sub-Planck structure is just such a quantum interference effect which determines the sensitivity of a quantum state to perturbations, considered as displacements in phase space. We have demonstrated that spectral shearing interferometry directly measures the overlap between an ultrashort pulse and a replica that has displaced in phase space in a range of directions, thereby providing a direct test of the Zurek hypothesis.
An important question is whether it might be possible to implement the same approach for a quantum system consisting of massive particles? In fact, it is possible to devise a shearing interferometer for the center-of-mass wavefunction of an atom. [14] A momentum shift of the transverse degree of freedom can be accomplished by passing the atom through a standing-wave light field in the Lamb-Dicke limit. Propagation in free space leads to the detection of an atom interferogram with similar properties to those of the SPIDER method discussed here.
Such methods may enable a deeper exploration of uniquely quantum characteristics, those which distinguish purely quantum dynamics from that possible in classical systems, to which question Kryszstof Wodiewicz devoted a great deal of his work.
References
- [1] I. Bialynicki-Birula, On the wave function of the photon, Acta Phys. Pol., A 86 (1994) 97–116.
-
[2]
B. J. Smith, M. G. Raymer, Photon
wave functions, wave-packet quantization of light, and coherence theory, New
J. Phys. 9 (11) (2007) 414.
URL http://stacks.iop.org/1367-2630/9/414 -
[3]
J. H. Eberly, K. Wódkiewicz,
The
time-dependent physical spectrum of light, J. Opt. Soc. Am. 67 (9) (1977)
1252–1261.
URL http://www.opticsinfobase.org/abstract.cfm?URI=josa-67-%9-1252 -
[4]
I. A. Walmsley, C. Dorrer,
Characterization of
ultrashort electromagnetic pulses, Adv. Opt. Photon. 1 (2) (2009) 308–437.
URL http://aop.osa.org/abstract.cfm?URI=aop-1-2-308 - [5] R. Trebino, Frequency-Resolved Optical Gating: The Measurement of Ultrashort Laser Pulses, Kluwer Academic Publishers, 2000.
- [6] D. J. Kane, Recent progress toward real-time measurement of ultrashort laser pulses, IEEE J. Quantum Electron. 35 (4) (1999) 421, 0018-9197.
- [7] I. Walmsley, V. Wong, Characterization of the electric field of ultrashort optical pulses, J. Opt. Soc. Am. B 13 (2453) (1996) 233.
- [8] C. Iaconis, V. Wong, I. A. Walmsley, Direct interferometric techniques for characterizing ultrashort optical pulses, IEEE JSTQE 4 (1998) 1.
- [9] C. Iaconis, I. A. Walmsley, Spectral phase interferometry for direct electric-field reconstruction of ultrashort optical pulses, Opt. Lett. 23 (10) (1998) 792–794.
- [10] W. H. Zurek, Sub-planck structure in phase space and its relevance for quantum decoherence, Nature 412 (6848) (2001) 712–717.
-
[11]
L. Praxmeyer, P. Wasylczyk, C. Radzewicz, K. Wódkiewicz,
Time-frequency domain
analogues of phase space sub-planck structures, Phys. Rev. Lett. 98 (6)
(2007) 063901.
doi:10.1103/PhysRevLett.98.063901.
URL http://link.aps.org/abstract/PRL/v98/e063901 -
[12]
T. Witting, D. R. Austin, I. A. Walmsley,
Ultrashort pulse characterization by
spectral shearing interferometry with spatially chirped ancillae, Arxiv
preprint arXiv:0908.1245v1 [physics.optics].
URL http://arxiv.org/abs/0908.1245v1 -
[13]
D. R. Austin, T. Witting, I. A. Walmsley,
High precision
self-referenced phase retrieval of complex pulses with multiple-shearing
spectral interferometry, J. Opt. Soc. Am. B 26 (9) (2009) 1818–1830.
URL http://josab.osa.org/abstract.cfm?URI=josab-26-9-1818 - [14] I. A. Walmsley, N. P. Bigelow, Measuring the quantum state of cold atoms using momentum-shearing interferometry, Phys. Rev. A 57 (1998) R713.