Multiwavelength study of Cygnus A III. Evidence for relic lobe plasma
Abstract
We study the particle energy distribution in the cocoon surrounding Cygnus A, using radio images between 151 MHz and 15 GHz and a 200 ks Chandra ACIS-I image. We show that the excess low frequency emission in the the lobe further from Earth cannot be explained by absorption or excess adiabatic expansion of the lobe or a combination of both. We show that this excess emission is consistent with emission from a relic counterlobe and a relic counterjet that are being re-energized by compression from the current lobe. We detect hints of a relic hotspot at the end of the relic X-ray jet in the more distant lobe. We do not detect relic emission in the lobe nearer to Earth as expected from light travel-time effects assuming intrinsic symmetry. We determine that the duration of the previous jet activity phase was slightly less than that of the current jet-active phase. Further, we explain some features observed at 5 and 15 GHz as due to the presence of a relic jet.
keywords:
galaxies:active–galaxies:individual: Cygnus A–galaxies:jets.1 Introduction
At a redshift of 0.05607 (Owen et al., 1997), Cygnus A (3C 405) is the closest powerful FR II classical double radio galaxy. It is therefore well studied in the radio (Carilli et al., 1991). At this redshift, and assuming a Hubble constant of 73 km s-1 Mpc-1, an angular size of 1 arcsecond corresponds to a physical size of 1.044 kpc. In this paper, as in the previous two in this series, we use ‘lobe’ to mean the lobe that is nearer to Earth, and ‘counterlobe’ for its more distant counterpart. Similarly, ‘jet’ refers to the jet pointing towards the Earth, while ‘counterjet’ is used for the receding jet.
In a previous paper we showed that the current radio jet axis of Cygnus A appears to be precessing (Steenbrugge & Blundell, 2008) and derived an upper limit to the jet speed of 0.5. In a companion paper (Steenbrugge et al., 2008) we demonstrated that the long narrow X-ray feature observed in the counterlobe is a relic counterjet. This conclusion stems from the fact that the outer part of this linear feature does not trace the current counterjet observed in the 5, 8 and 15 GHz images. The relic counterjet is wider than the current radio jets, and emits X-rays via inverse-Compton scattering of the cosmic microwave background, rather than synchrotron as the current jet and counterjet.
The age of the current jet-activity is only of order 4 107 years, assuming a constant hotspot advance speed of 0.005c (Alexander & Pooley, 1996). Furthermore, assuming a jet speed of 0.3 (Steenbrugge & Blundell, 2008), the time for an emitted plasma blob to reach the hotspot is 7105 years.
In this paper, we explore the possibility that relic radio lobes, formed by the relic (counter)jet, may be observable. The reigning paradigm in this field, which dates back to early classic works by e.g. Longair et al. (1973) and Scheuer (1974), is that intrinsically both lobes have similar properties. Dennett-Thorpe et al. (1999) studying nearby FR II galaxies found no correlation between jet-side and spectral index for the extended lobe emission, and showed that the hotspot spectra on both sides are similar. Both these observations support the assumption that intrinsically lobes formed by symmetric and active jets have the same properties. We investigate the possibility of relic lobe emission using the following methods: i) we compare the total low frequency flux in the lobe and counterlobe, ii) the same as i) but for portions of the (counter)lobe and iii) by studying the morphology at high frequencies. For this purpose we study the low frequency (151, 327 and 1345 MHz), yet high resolution data available for Cygnus A. We compare these low frequency data with the high frequency 5-GHz radio image and with the 200 ks Chandra ACIS-I image of Cygnus A. The 151 MHz, 327 MHz, 1345 MHz and X-ray images of Cygnus A show significantly more emission closer to the nucleus than the higher frequency (5 15 GHz) radio images (see Figs. 5 and 8), as noted previously by Carilli et al. (1991) and Lazio et al. (2006). The X-ray emission close to the nucleus is found to be thermal (Wilson et al., 2006). The radio emission at the same location however, in common with radio emission throughout this source, is synchrotron emission.
In classical double FRII radio sources, of which Cygnus A is the prototype, we contend that adiabatic expansion is the dominant mechanism by which the electrons lose energy with time and emit at lower frequencies. The generality of this effect is supported by the D- correlation obtained by Blundell et al. (1999) and explored more generally in Blundell & Rawlings (2000, 2001). Rudnick et al. (1994) reported that they found no evidence, in a detailed pixel-by-pixel study of Carilli’s data on Cygnus A, of any aging of the spectrum due to synchrotron losses or inverse-Compton losses, consistent with the hypothesis that E2 losses are negligible. An alternative picture, critiqued by Blundell & Rawlings (2001), is that synchrotron and inverse Compton losses dominate the evolution of the electron energy spectrum in the lobes; this picture underpins the traditional spectral ageing method. The assumptions which underlie this picture are not necessarily applicable to FRII sources such as Cygnus A (Blundell & Rawlings, 2000, 2001). Thus low-frequency emission may represent aged electrons, relative to those radiating at GHz frequencies. In this paper we study whether the relic X-ray detected counterjet (Steenbrugge et al., 2008) has observable effects on the counterlobe radio emission. In particular, we test the hypothesis that relic counterlobe plasma is detectable at low radio frequencies.
2 Data reduction and cleaning
The 151-MHz MERLIN image was kindly provided by Paddy Leahy and published by Leahy et al. (1989).
The 327 MHz VLA111 The Very Large Array is a facility of the National Radio Astronomy Observatory, National Science Foundation., the 1345 MHz, the 5 GHz, the 8 GHz and 15 GHz data were kindly supplied by Chris Carilli; and published by Carilli et al. (1991), Carilli et al. (1996), Carilli & Barthel (1996) and Perley & Carilli (1996).
The Chandra image presented in this paper is the co-added image of 200 ks of ACIS-I data. The X-ray data reduction and co-adding of the different images is described by Steenbrugge et al. (2008). The X-ray spectra were fitted using the SPEX code (Kaastra et al., 2002) and the errors for the X-ray parameters are rms errors (Kaastra et al., 2004). However, for the spectral result we used all 10 Chandra datasets with more than 5 ks exposure time (for more details see Steenbrugge et al., 2008). All the spectra were fitted simultaneously. We allowed for a fudge factor for the normalisation of the power-law component to take into account the different calibration between the ACIS-S and ACIS-I spectra.
3 Radio spectra and fluxes
The 5-GHz and higher frequency images of Cygnus A show a lack of emission near the nucleus (e.g. Steenbrugge et al., 2008). The 5-GHz multi-configuration VLA image obtained by Carilli et al. (1991) has the highest dynamic range of all the high frequency radio images, and it was therefore used as a comparison to the lower frequency data. To ensure that no diffuse emission at 5 GHz is missed, we re-imaged the radio data, and increased the weighting of the shorter baselines. This did not result in any additional detected 5 GHz emission near the nucleus. The upper limit to the flux density near the nucleus is 0.5 Jy over 1233.7 beams or 616.9 arcsec2 at 5 GHz. Furthermore, for the highest resolution image the total flux density at 5 GHz is 383 9 Jy. This is similar to the flux density of 410.6 Jy as predicted by the model of Baars et al. (1977). We conclude that the lack of emission at 5 GHz and higher frequencies near the nucleus is not an instrumental or undersampling effect, but due to a lack of sufficiently high Lorentz factor electrons.
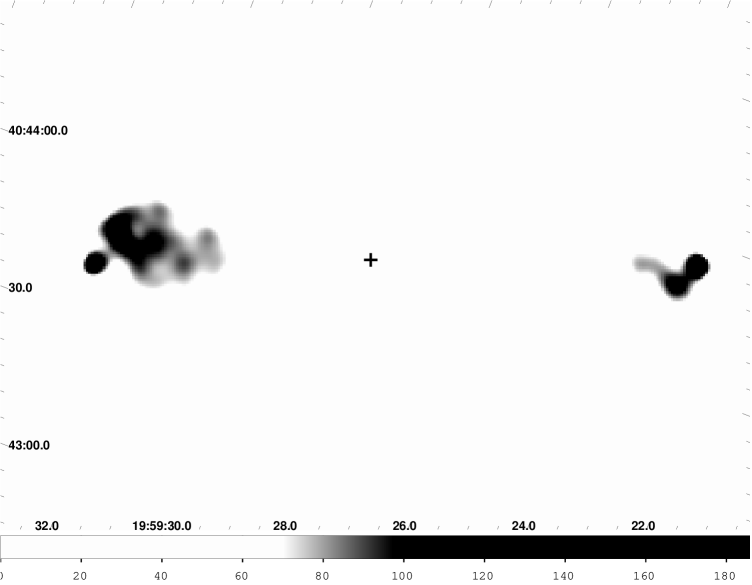
By examining the 151 and 327 MHz radio images it becomes apparent that the counterlobe is brighter than the lobe in the outermost region (see Fig. 1). This is consistent with the results obtained at 74 MHz by Kassim et al. (1996). To see if this brightness difference persists at higher frequencies, we determined the radio flux densities for the lobe and counterlobe for the following bands: 151, 327 and 1345 MHz, and 5, 8 and 15 GHz.
For each band we used the highest spatial resolution image available, and only included emission above a certain threshold, as described below. Rather than measuring the flux density in a single template region common to all frequency bands the threshold varied with frequency. This threshold value was determined by blanking all the emission in the map below a starting threshold which was iteratively reduced. The total flux density for each map in the resulting series was determined and compared to the value predicted by Baars et al. (1977). Adjacent pairs of maps were then differenced, which showed the extra emission that was being added for each iteration. We selected the threshold which was closest to the value predicted by the Baars et al. (1977) model, but did not introduce either background noise spikes in the map or features that we deemed to be due to residual calibration errors. This was repeated for each frequency.
To ensure a reliable measurement and to prevent overestimating the flux density the iterations were terminated when spurious features were introduced into the map (e.g. noise spikes or features that we deemed were due to residual calibration errors). This was repeated for each frequency. As an additional check we also compared the total measured flux density to those from the model derived by Baars et al. (1977) and in no case do we exceed this value.
A slight complication is that the hotspot and jets have spectral indices which differ from that of the lobe material and could potentially contaminate the spectra determined for the lobe or the counterlobe. Therefore the flux densities from both hotspots and counter-hotspots were removed from the lobe and counterlobe flux densities. We used the AIPS task JMFIT to fit each hotspot with a Gaussian component and a two-dimensional quadratic background surface. The Gaussian component was then subtracted from the (counter)lobe for each hotspot at each frequency.
At frequencies above 327 MHz there are two hotspots detected in each lobe, however at 151 and 327 MHz only the brightest hotspot is detected in the counterlobe. At any given frequency we only measure and subtract the contributions from hotspots which are detected, and do not attempt to compensate for the potential contribution to the flux density measurements from hotspots which are not detected.
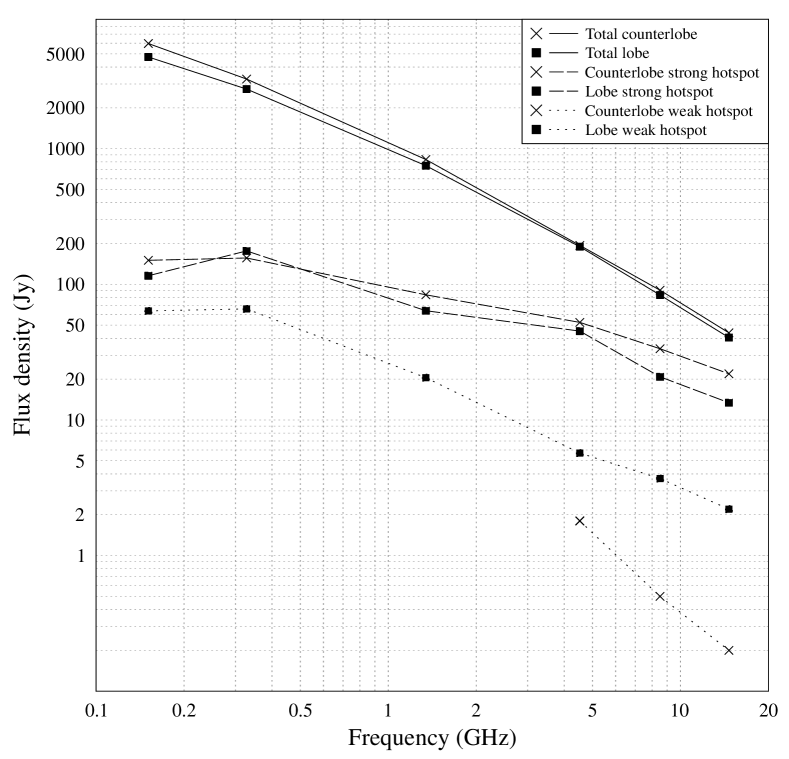
At frequencies of 1345 MHz and above the jet becomes quite bright, and was therefore also subtracted where appropriate. For the 8 and 15 GHz data we subtract the contribution of the jet from the total lobe flux density measurement, as the jet is easily separated from the lobe. At lower frequencies, where the jet is not as easy to disentangle, and as with the undetected hotspots, we make no attempt to correct for any contribution of the jet. However, as the jet at those frequencies is considerably weaker than the lobe emission, this should not adversely affect our results. The resulting flux spectra for the lobe and counterlobe (minus the hotspot and jet contributions), and the hotspots, are shown in Fig. 2, and the hotspot, jet and total flux densities are given in Table 1.
| Hotspots | Jets | Lobes | Total | Error | Baars | %Baars | Volume | |||||||||
|---|---|---|---|---|---|---|---|---|---|---|---|---|---|---|---|---|
| L1 | L2 | C1 | C2 | L total | C total | L | C | L | C | (mJy/beam) | L | C | ||||
| 151.0 | 115.7 | 63.7 | 150.4 | – | 179.4 | 150.4 | – | – | 4746 | 5963 | 10709 | 800 | 10841.3 | 98.8 | 68839 | 61257 |
| 327.5 | 176.4 | 65.9 | 156.4 | – | 242.3 | 156.4 | – | – | 2752.7 | 3262.6 | 6015.3 | 230 | 6063.4 | 99.1 | 79790 | 58402 |
| 1345.0 | 69.3 | 20.5 | 83.7 | – | 89.8 | 83.7 | 36 | 47 | 749.8 | 832.2 | 1582.0 | 40 | 1653.9 | 95.7 | 47794 | 39103 |
| 4525.0 | 45.2 | 5.7 | 52.4 | 1.8 | 50.9 | 54.2 | 8.7 | 10.8 | 189.4 | 193.7 | 383.1 | 20 | 410.6 | 93.3 | 23562 | 18863 |
| 8514.9 | 20.8 | 3.7 | 33.5 | 0.5 | 24.5 | 34.0 | 0.6 | 0.1 | 83.4 | 90.5 | 173.9 | 15 | 187.0 | 93.0 | 10447 | 10308 |
| 14650.0 | 13.4 | 2.2 | 21.9 | 0.2 | 15.6 | 22.1 | 0.2 | 0.2 | 40.5 | 43.9 | 84.4 | 25 | 95.2 | 88.6 | 6462 | 7517 |
In the case of the 151 MHz MERLIN image there is apparently significant brightness variation across the lobe, most likely due to residual sidelobe structure from the brightest points, and the lobe background makes a significant (and sometimes dominant) contribution to the total flux density at the location of the hotspots. For these reasons there will be larger uncertainties associated with our measured values in this regime. Consequently, and with reference to Fig. 2, we suspect that the observed non-monotonic radio spectrum of the strong counterlobe hotspot between 327 and 151 MHz may not be real.
A very interesting result is that the counterlobe is brighter than the lobe particularly at frequencies below 1345 MHz. The stronger hotspot is brighter above 5 GHz in the counterlobe than in the lobe. The weaker hotspot is always brighter on the lobe side. This is easily seen in the separation in flux density of like-for-like features in Fig. 2.
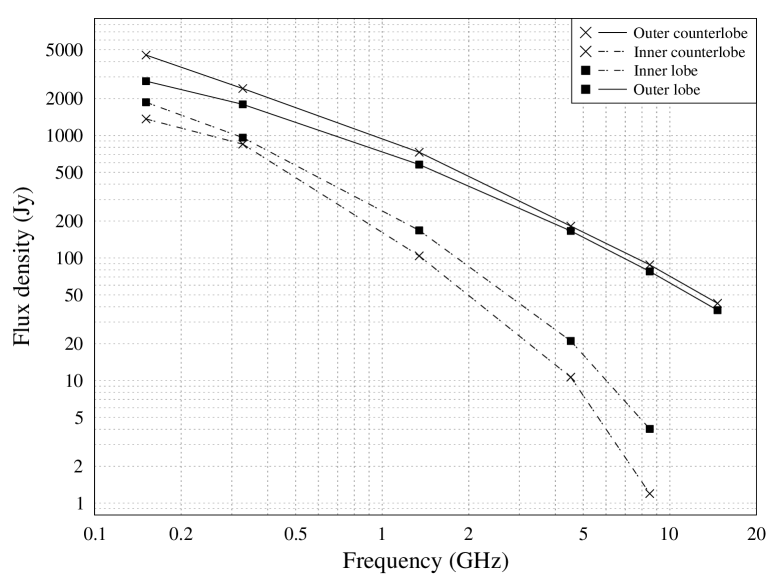
The emission at 327 and 1345 MHz correlates well with the 151 MHz emission, and exhibits no large-scale differences. To further study the difference in luminosity of the lobe and counterlobe we plotted radio spectra for the outer half of the (counter)lobe and the inner half of the (counter)lobe. Fig. 3 shows the spectra for these regions. The general trend for the spectra to get steeper with increasing frequency holds true for both the inner and outer regions of the lobe and counterlobe. This trend is also observed in Fig. 2. The inner lobes are not detected above the background noise in the 15 GHz data, and therefore no values are specified. Fig. 3 shows, as expected, that the inner lobe has a steeper spectrum at higher frequencies than the outer lobes. At lower frequencies, as Fig. 3 shows, the spectral indices (the slope of the lines) are very similar for both the inner and outer regions of the lobe and counterlobe. There is however a brightness difference manifested in the vertical offsets. Note also that the outer counterlobe is brighter than the outer lobe, see also Table 3, but that the inner lobe is brighter at all frequencies than the inner counterlobe.
4 Discussion
As is clear from Fig. 3 the outer counterlobe is brighter than the outer lobe at all frequencies. We should note however that the hotspot-subtracted total lobe flux densities are very similar for 5, 8 and 15 GHz. We make the assumption that intrinsically the current lobe and counterlobe should be equally bright at all frequencies in the rest frame. We note that the light travel time is small compared to the synchrotron and inverse-Compton loss timescale especially for low Lorentz factor electrons. We now discuss several possible explanations for the observed luminosity difference.
4.1 Absorption
A possible explanation for the excess emission in the counterlobe at low frequencies is that the lobe is more heavily absorbed by (fully or partially) ionised gas. This possibility was acknowledged by Kassim et al. (1996) to explain the low-frequency curvature. Lazio et al. (2006) used the same explanation for the brightness asymmetry in the 74 MHz observations, i.e. that the counterlobe is brighter than the lobe. However, upon detection at earth, the photons from the counterlobe have traversed a larger distance and thus passed through more cluster gas than those from the lobe, which tends to counter the absorption hypothesis of Kassim et al. (1996). There are two possible explanations for an asymmetry in absorption. Firstly, the column density or temperature through the cluster in which Cygnus A is situated might vary. The Cygnus A cluster is merging or has recently merged (Markevitch et al., 1999) and thus has a temperature profile that shows small scale structure (Belsole & Fabian, 2007). In general the counterlobe side has a lower temperature than the lobe side, as the merger appears to have occurred on the lobe side. Absorption is more efficient for lower temperature gas, thus arguing against this possibility. Alternatively, the column density along the Cygnus arm of our Galaxy, behind which Cygnus A is located, could vary. In that case one can assume that the temperature of the gas is much lower and of order 104 K.
We tested the absorption hypothesis using two methods. First we determined the total neutral hydrogen column density assuming solar abundances (Grevesse & Anders, 1989) for the two brightest opposing hotspots in the X-ray image. The measured column density includes any low ionisation gas. We chose the hotspots as their spectra in this wavelength range should be accurately modelled by a power-law. Also, due to the small physical scale of the hotspots contamination from thermal cluster gas is negligible.
It is therefore straightforward to measure the absorbing hydrogen column density. For the less bright and more extended emission, there is the possibility of different thermal emission components, complicating the spectral analysis. Although the hotspots appear very bright on the combined 200 ks Chandra ACIS-I image, the total number of counts at their positions is still rather limited. The hydrogen column density measured for both hotspots is therefore relatively uncertain. For the western hotspot (i.e. the hotspot in the lobe) we determined a total hydrogen column density of (3.6 0.4)1025 m-2. For the eastern hotspot (i.e. the hotspot in the counterlobe) the value is (3.5 0.65)1025 m-2. Dickey & Lockman (1990) quote a hydrogen column density of 3.5 1025 m-2 for Cygnus A, thus both our measured values are consistent with their value.
To ensure we were not missing any low ionisation gas, we fixed the neutral hydrogen column density to the value quoted by Dickey & Lockman (1990), and added an absorption component assuming a temperature of 1 eV (1.16104 K). In the following analysis we make the assumption that the neutral Galactic column density does not vary over the angular size of Cygnus A. We derive 3 rms upper limits of 0.6 and 1.7 1023 m-2 for the ionised hydrogen column density, , for the counterlobe and lobe hotspots respectively. Both values are consistent with no significant change in column density, either neutral or low ionisation, at the outer extremities of Cygnus A. To calculate whether these upper limits are consistent with the absorption required to explain the low radio frequency bright excess in the counterlobe, we use the values assumed by Carilli et al. (1989) for the electron density, = 3 105 m-3 (in their paper they quote this as an upper limit and under the assumption that the absorber is uniform) and size kpc for the absorber. From these values and = we then calculate a hydrogen column density of 2.7 1025 m-2, much larger than either measured upper limit of 0.6 and 1.7 1023 m-2.
Another test is to measure the free-free absorption using the spectral indices and intensities of the different radio frequency images. We followed the formalism used by Walker et al. (2000), using their equations 1 and 2. We assume that the counterlobe is unabsorbed, in order to derive an intrinsic intensity. We further assume that the intrinsic intensity is the same for both lobes, an assumption that is based on the fact that the counterlobe to lobe luminosity ratio decreases to about 1 by 5 GHz. Furthermore we assume that the intrinsic spectral index is the same for both lobes. Using the intrinsic intensity we can then find the extinction parameter from data at two different frequencies, which is inversely proportional to frequency squared. The other variables determining , are temperature, density, and the path length of the absorber, which should not vary with frequency for any given point in the lobe. Therefore, finding of 0.64 for the 151327 MHz and the 58 GHz data pairs, we can rule out that free-free absorption explains the counterlobe/lobe luminosity difference. The other pairs of are all too similar to allow for a frequency-squared dependence.
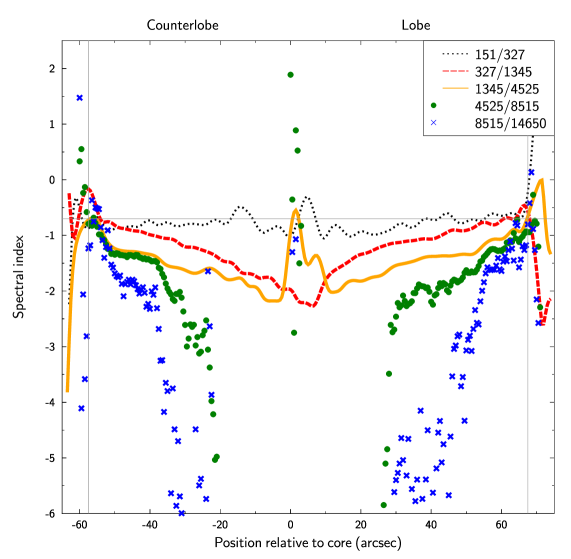
We should note that the effects of free-free absorption would be more significant at lower frequencies if this effect was occurring. Thus the difference in spectral indices should be largest for low frequencies. Rather, the measured indices at lower frequencies are very similar for the lobe and counterlobe (Fig. 4). It seems unreasonable to assume that the spectra are intrinsically different, but appear to have the same spectral index due to absorption. This conclusion still holds if just the counterlobe itself is absorbed.
As an alternative test, assuming that the temperature, metallicity and Gaunt factor of the absorber are the same for the lobe and counterlobe side, and that , with the ion density; we can calculate the ratio of electron densities in the absorber. Using equations 5.16 and 5.19b from Rybicki & Lightman (1986) and rearranging we get
| (1) |
where the subscript cl stands for counterlobe side and l for lobe side. Substituting the flux densities as those measured from the 151 MHz counterlobe and lobe, we find an electron density ratio of 1.26. The hydrogen column density equation above, which can be rewritten as = 0.12 , which yields 3.2 1024 m-2 for the values of electron density and size of the absorber assumed by Carilli et al. (1989). This is significantly more than the measured difference in hydrogen column density of 1.1 1023 m-2. From the above three different methods it can thus be concluded that absorption cannot explain the excess emission observed in the counterlobe at low radio frequencies, contrary to the conclusion by Kassim et al. (1996).
The deduction above is consistent with the fact that the spectral indices we measure (see Fig. 4) which were made using matched-resolution image pairs, are nearly symmetric around the core, which would not be expected if there was significant absorption. The spectral indices of the absorbed and unabsorbed lobe of 3C84 studied by Walker et al. (2000) are very different: 0.7 for the unabsorbed lobe and on average 2.3 in the absorbed lobe. The absorption is expected to be smaller in Cygnus A as we do not observe as large differences in luminosity above 5 GHz, contrary to observations of 3C84 in which absorption is clearly taking place.
4.2 Adiabatic expansion
Another possible explanation for the luminosity excess at lower frequencies is that the counterlobe has a slower expansion rate than that of the lobe. Due to expansion the electrons lose energy and the magnetic field strength decreases. Any break frequency of the synchrotron emission moves to lower frequencies, and the total amount of emission decreases for all frequencies. The effect this has on log-log spectra (such as Figs. 2 and 3) is to shift the curve downwards and to the left (Scheuer & Williams, 1968). Thus at any given frequency, if the spectrum has concave curvature adiabatic expansion causes the spectrum of the lobe to appear steeper. Considering the spectrum of the outer lobes, the two curves have a slightly different shape; for high frequencies the spectrum of the lobe is certainly not steeper than that of the counterlobe. At low frequencies the counterlobe has a steeper spectrum than the lobe. Thus adiabatic expansion of the lobe seems an unlikely explanation for the difference in brightness.
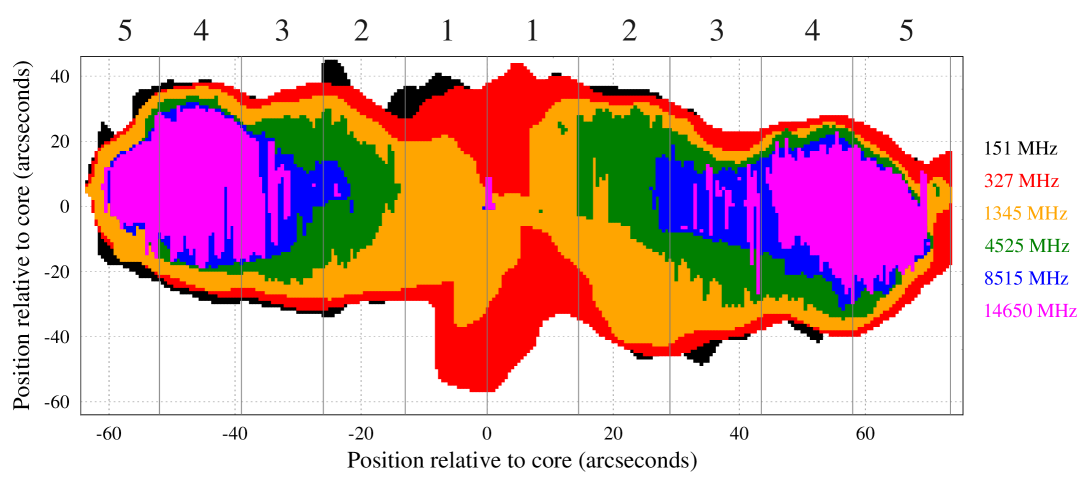
To calculate the volumes of the lobes we rotate the radio images such that the line joining the brightest hotspots are aligned with the horizontal axis. Each pixel along this axis then represents the length of a volume element which we assume to be a flat cylinder (or disc), as shown in Fig. 6. The diameter of the element is the transverse extent of the radio emission within the threshold , as defined in Section 3 and shown in Fig. 5. The summation:
| (2) |
over all volume elements either to the east or the west of the core then gives the total volume for the counterlobe or the lobe.
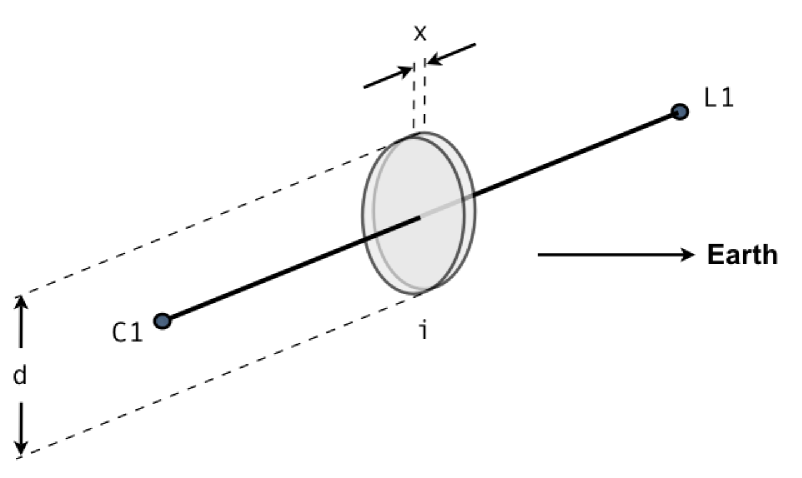
Table 1 shows that the counterlobe volume is smaller than that of the lobe with the exception of 15 GHz. Note that our volume calculation makes a simplistic assumption about the cylindrical symmetry of the radio emitting region, however we feel this is reasonable in the absence of any insight into the extent of Cygnus A in the unobservable third dimension.
A further test is to calculate the expected luminosity ratio between the counterlobe and lobe, assuming adiabatic expansion and a tangled magnetic field (despite the indications mentioned above that the different spectral indices do not favour this model). To do so we determine the volumes of both regions of interest and the spectral index. Following the formalism described by Leahy (1991), the fractional luminosity increase due to adiabatic expansion from a state 1 (lobe) to a state 2 (counterlobe) is:
| (3) |
where is the volume, and assuming that each lobe starts from the same initial volume and spectral properties.
As can be seen in Fig. 5 we have divided the lobes into five regions for easy reference. The low frequency excess is contained within regions 3, 4 and 5 in the counterlobe so we determine the luminosity ratio with the total volumes of these three regions (=30564, =32111 kpc3) calculated as per the method described above.
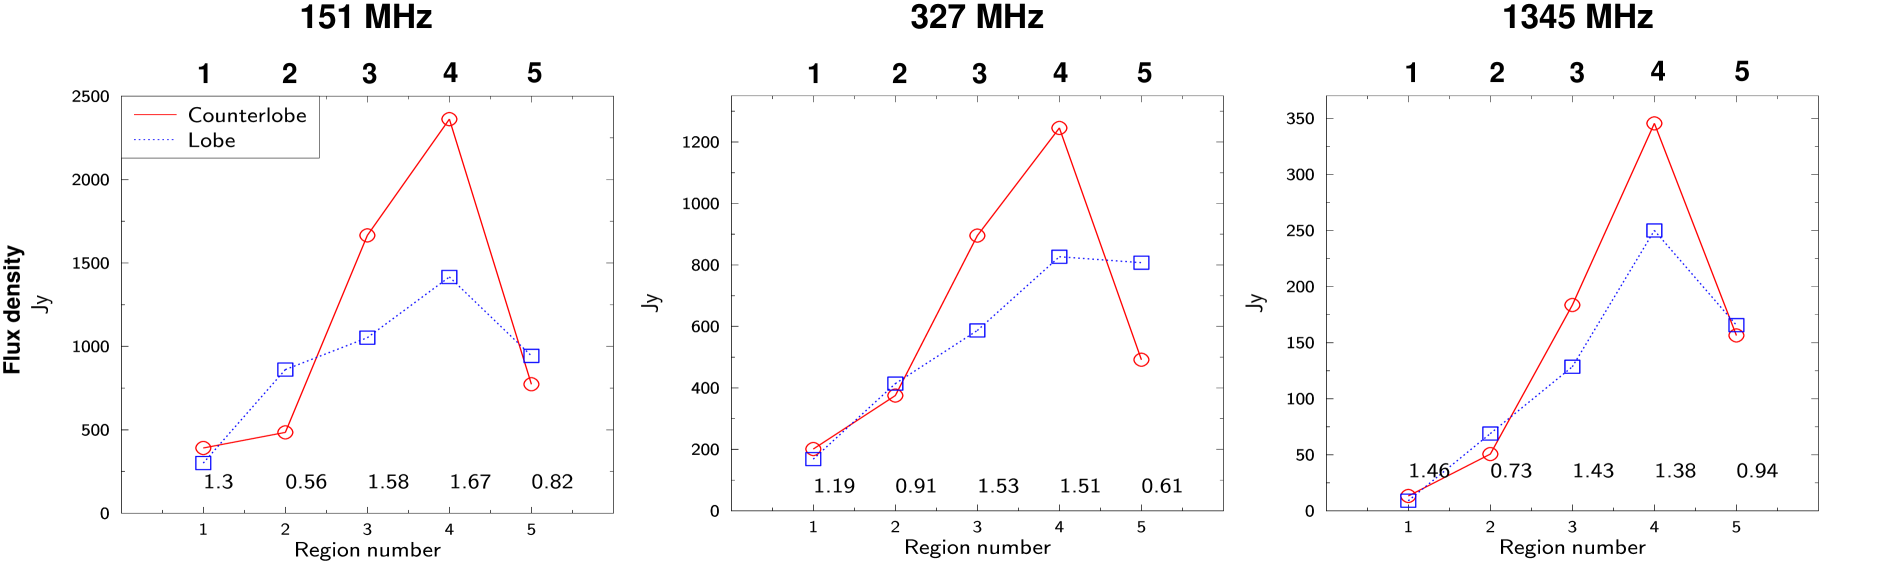
Throughout this paper spectral indices are determined for a given frequency by pairing it with the next highest frequency (i.e. 151/327, 327/1345, 1345/4525). Assuming an average spectral index at 151 MHz across the source of 0.94, the relationship above predicts a brightness excess in regions 3, 4 and 5 of the counterlobe of 8.0%, substantially less than the 35% excess that is actually measured in these regions (=4801, =3412 Jy for 151 MHz). Doing the calculation for the 5 GHz data (with a spectral index of 1.54, =15943, =19129 kpc3) the same adiabatic expansion would predict that the counterlobe should be 64% brighter than the lobe, compared to the 3% we measure (=187, =181 Jy).
To illustrate the brightness excess in the counterlobe, Fig. 7 shows the flux densities at 151, 327 and 1345 MHz for the five regions of the lobe and counterlobe. The numbers towards the bottom of each panel are the counterlobe to lobe ratios of each plotted value. Although the flux densities for the lobe and counterlobe are similar near the nucleus, for the lower two frequencies the counterlobe is much brighter in the central region of the lobe, becoming less bright again at the outermost slice, which contains the hotspots. The difference in flux density between the counterlobe and lobe is less pronounced for 1345 MHz (and further diminishes for higher frequencies as seen in Fig. 2).
4.3 Adiabatic expansion and absorption
Although neither absorption nor adiabatic expansion alone can explain the excess flux at low frequencies in the counterlobe, we now consider whether the combination of both could. The reason why absorption alone does not work is that the absorption coefficients, derived for the different frequencies, are very similar, instead of having an inverse dependence on the square of the frequency. For absorption to be the correct explanation for the excess brightness we require an increasing difference in the ratio between counterlobe and lobe flux densities as we go to lower frequencies. Above we calculated that 8% of the flux difference can be explained by adiabatic expansion. We thus recalculated the absorption coefficients, assuming that 8% of the flux difference is due to adiabatic expansion. For the 151327 MHz pair = 0.54 and for the 58 GHz pair = 0.46, assuming that 64% of the counterlobe flux at 5 GHz is explained by adiabatic expansion, as calculated above. Again the difference between the values of is too small to allow for the frequency square dependence. Therefore we can rule out that a combination of absorption and adiabatic expansion explains the excess counterlobe emission.
4.4 Emission from aged relativistic plasma
The excess counterlobe versus lobe low frequency emission can be explained by an aged relativistic plasma. Considering that in the X-ray image we detect emission from a relic counterjet (Steenbrugge et al., 2008), i.e. the counterjet of a previous episode of jet activity, a possible origin for this excess radio emission is a relic counterlobe that is still emitting at low frequencies. The reason that we would only detect the relic counterlobe and not the relic lobe is the same as the reason why we only significantly detect the relic counterjet. We look further back in time when looking at the counterlobe than we do when looking at the lobe, and thus see less evolved (hence less faded) plasma. Steenbrugge et al. (2008) in their fig. 4 indicate the lightcurve expected of a jet or lobe that has stopped receiving newly accelerated electrons.
From Fig. 7 it is clear that near the nucleus the fluxes measured are very similar, consistent with the idea that near the nucleus the difference in the look-back times will be very small, and so the particles should have very similar ages and will have cooled by roughly the same amount. As expected, the flux density ratio between counterlobe and lobe emission generally increases with distance from the nucleus. This increase in ratio is expected from the look-back time difference, as the difference in travel time becomes larger as one moves towards the hotspots.
Is there other possible evidence that the excess emission comes from aged relativistic plasma? At 151 MHz the width of the brightest part of the counterlobe, which is near the hotspots, and where most of the excess emission occurs, is significantly greater than that of the corresponding region in the lobe (see Fig. 1 where we optimised the transfer function to highlight the bright emission). Near the nucleus however, the lobe is wider than the counterlobe. These width differences have two possible explanations, namely due to much faster adiabatic expansion of the current counterlobe compared to the current lobe, or due to an expanded aged plasma.
In Section 4.2 we showed that adiabatic expansion differences cannot explain the excess emission. Therefore we make the claim that the extra width in the counterlobe is consistent with it being due to emission from an aged plasma that has expanded. We should re-iterate that we are assuming that only the excess low frequency counterlobe emission is due to an aged plasma. However, we cannot rule out that some of the remaining low frequency emission in both lobes is due to emission from an aged plasma.
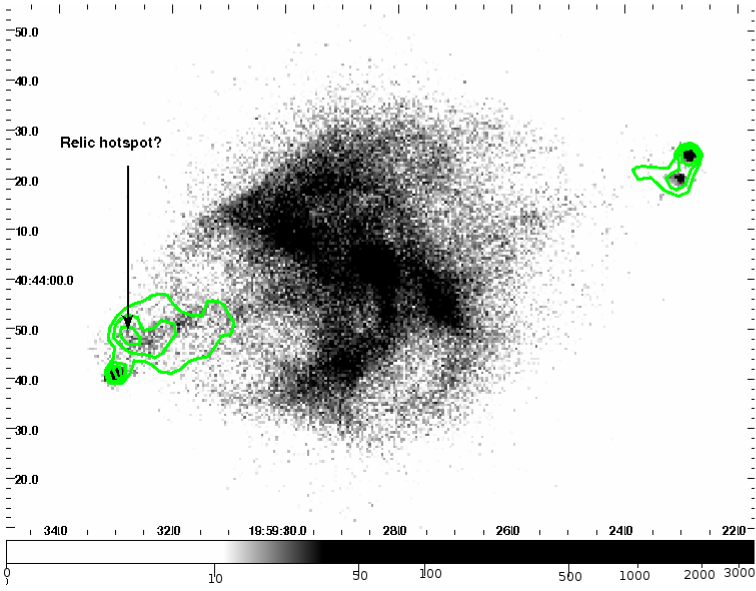
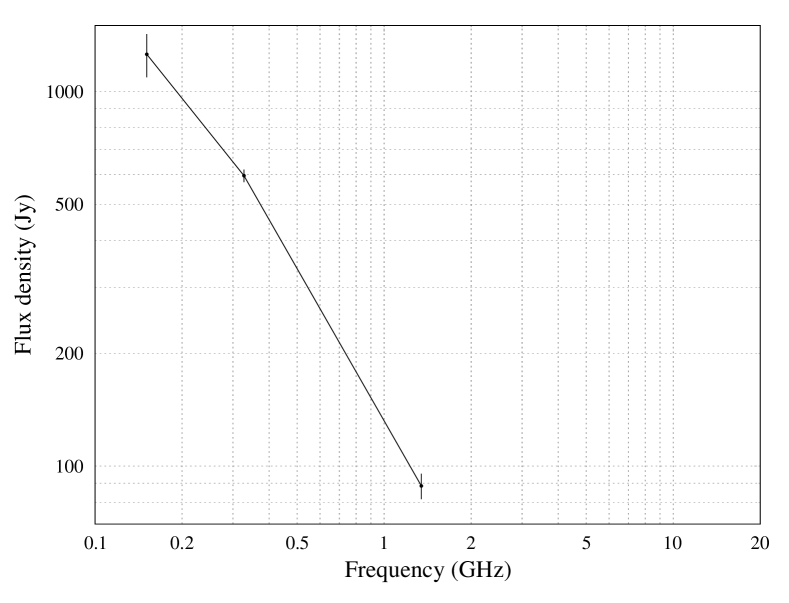
Considering the close spatial association of the relic X-ray counterjet with the aged plasma observed at 151 MHz, we identify the aged plasma with a part of the relic counterlobe that was formed by the relic counterjet. At the extreme end of the relic X-ray counterjet there is a region of perpendicular X-ray emission which is quite separate from the current hotspots. This is a possible location for the corresponding relic hotspot. The emission mechanism here could not possibly be synchrotron but it could be explained as cosmic microwave background photons inverse-Compton scattering off the electrons (ICCMB) present in the plasma which once formed the hotspot. Fig. 8 highlights the location of this possible relic hotspot. This region is the brightest point on the 151 MHz image (other than the current hotspots), however, in X-rays there is an equally bright region between the 2 outer contours plotted in Fig. 8. Within the contour labelled relic hotspot there are 395 counts above the background, while the flux density is 149 Jy/beam with a beam size of 3′′ by 3′′.
4.4.1 Compression of relic counterlobe
The lifetime of the low frequency synchrotron-emitting electrons should be shorter than that of those scattering off the CMB to produce X-rays. If we take synchrotron and inverse-Compton losses and losses due to adiabatic expansion into account, as well as the decrease of the magnetic field strength over time, and the light travel-time effects then we cannot adequately explain why we do detect the relic counterjet in X-rays, yet still see the low frequency radio emission from the counterlobe.
To explain why we detect a relic counterlobe and a possible relic counterhotspot, we suggest that the current counterlobe is compressing the relic counterlobe plasma and in doing so increasing its magnetic field strength and re-energising the electrons (the frequency of emission being proportional to the magnetic field strength). The current counterjet lies to the south of the relic counterjet, and therefore one would expect more radio emission to the north of the current counterjet, as is observed (see Fig. 9). This implies that a part of the relic counterlobe is embedded with the current counterlobe, or is close enough so as to be compressed by it. We should also note that the relic counterlobe is likely much larger than the portion that is currently visible, as we are only detecting the plasma in the relic lobe that is re-energised.
Fig. 8 shows one more interesting feature: on the northern side the X-ray brightens just outside the outer contour plotted (at about 19h59m32s in Right Ascension and 40∘43′54′′ in Declination). A possible explanation is that the relic counterlobe as it expands is coming into contact with cluster gas and either causing a shock wave resulting in heating and brightening of the cluster gas, or the expansion is subsonic and therefore causing compression of the intracluster medium. The denser gas will cool faster than its surroundings and therefore appear brighter. Data of much higher quality are needed to disentangle these possibilities.
4.5 Morphology
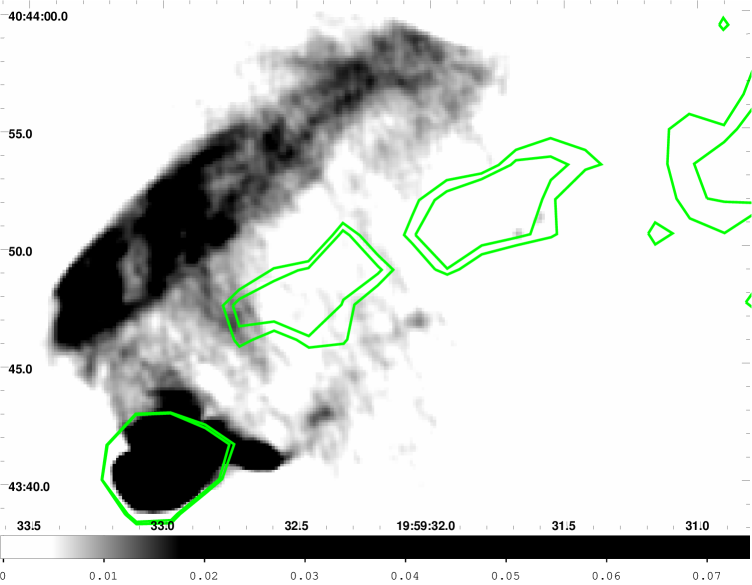
Higher frequency images of Cygnus A (see fig. 7 in Steenbrugge & Blundell 2008), show that there is a corresponding lack of radio emission at the location of the relic X-ray counterjet near the hotspot in the counterlobe. However, at 151 MHz there is excess emission overlaying the relic counterjet (see Fig. 8). The correspondence between 0.210 keV X-ray and 151 MHz emission for the counterlobe is, with the exception of the excessive transverse extent of the outermost contour plotted, rather good. This suggests that part of the 151 MHz emission originates in the relic counterjet.
We identify the extent of the 151-MHz emitting aged relativistic plasma coinciding with the outer contour on the counterlobe side in Fig. 8. The magnetic field in the relic hotspot inside the relic counterlobe is likely to still be higher than that of the surrounding area. Thus lower Lorentz factor electrons can still emit at observable but low frequency radio bands. This is a possible explanation as to why the likely relic hotspot is the brightest part of the excess emission in the counterlobe compared to the lobe (if we neglect the current hotspots). At even lower Lorentz factors, the electrons inverse-Compton scattering the cosmic microwave background will produce X-ray emission at keV energies, enabling the detection of the relic counterjet. This relic structure probably extends all the way to the nucleus, and certainly extends much further towards the nucleus than the excess counterlobe low frequency radio emission.
4.5.1 Impact of the relic counterjet on high frequency emission
As mentioned above the higher frequency radio data, especially at 15 GHz, show a lack of radio emission overlaying the relic X-ray counterjet (see Fig. 9). This is consistent with the feature being a true relic counterjet as there are insufficient high- particles to cause synchrotron emission; we only see ICCMB emission at keV energies from 1000 particles. Currently-active jets in FR II galaxies tend to be brighter relative to the lobes at high frequencies which is certainly the case for the current jets in Cygnus A. In Fig. 8 the current jets are not visible in the 151 MHz contours plotted or the X-ray image.
In the 5 GHz image (see figs. 1 and 4 in Steenbrugge & Blundell, 2008) at the inner edge of the counterlobe there is quite a bit of substructure in the brightness profile. There is a very weak ‘ring’ and there are two ‘antennae‘, which are two nearly-parallel, bright, narrow, linear features. In Fig. 10 we show these features and overlay in red contours the relic X-ray counterjet and a section of the outer edge of the bright thermal emission near the nucleus; see Fig. 8 for an X-ray image detailing the relic counterjet. The inner part of the X-ray relic counterjet lies between the two antennae. The electrons producing the 5 GHz emission are interacting with the relic counterjet. The brightening of the antennae is best explained by the relic counterjet halting the expansion of the current counterlobe plasma. Due to the slower adiabatic expansion rate, the losses are smaller, and the magnetic field will be somewhat higher, thus the electrons will continue to emit at higher frequencies. Furthermore, the increased density of the electrons will result in brighter emission.
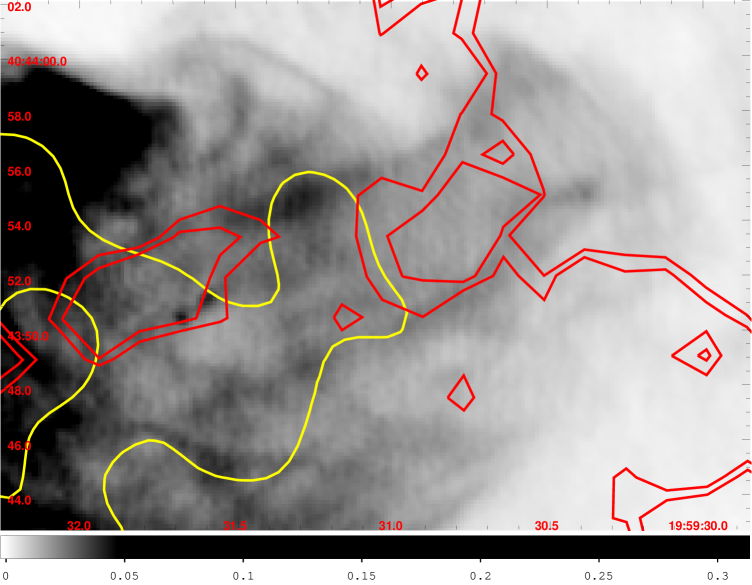
The western-most part of the 151 MHz contours in Fig. 8 overlays part of the antennae. This part of the 151 MHz contour lies between the two X-ray counterjet contours in Fig. 10. This 151 MHz contour has about the same width as the distance between the two antennae.
The 151 MHz contour lying between the X-ray contours in Fig. 10 coincides with a northwards shift of the X-ray counterjet. This occurs just before the location where the current counterjet deflects by an angle of about 27∘. There are two possible explanations for this shift. It could be due to the precession of the relic counterjet (see Fig. 9 in Steenbrugge & Blundell, 2008) or it could be the case that the current jet pushes the relic counterjet plasma northwards before itself deflecting southwards.
4.5.2 Did the relic lobe rise?
Current theories (e.g. Churazov et al., 2001) state that the relic lobes should buoyantly rise through the intracluster medium, at least as long as it is in direct contact with the cluster medium. The authors state a terminal velocity of bubbles which is of order 400 km s-1. The relic lobe is estimated to have been able to rise for 4 107 years (a timescale of the same order as the duration of current jet activity), which would mean that the lobe has risen by about 17 kpc. We cannot test this hypothesis as we cannot trace the X-ray-detected relic counterjet back to the nucleus due to the excess thermal emission in this region. Thus it is possible that the relic counterlobe did rise by 17 kpc, and the close spatial relation between the end of the relic counterjet and the current hotspots is coincidence.
4.5.3 Disentangling ICCMB from relic lobe and thermal cluster emission
A possible confirmation of relic lobe emission is to look for excess X-ray emission, because once particle energies are low enough, the electrons will inverse-Compton scatter off the cosmic microwave background (ICCMB) and emit X-rays. However in X-rays, at the site of the lobes further out from the nucleus, the cluster background contributes a significant fraction. Thus, if the cluster emission is not centered on the Cygnus A galaxy, this will cause a difference in luminosity between the lobes. A further complication is that the temperature of the cluster gas we fitted in the vicinity of the lobes is very different for the counterlobe and lobe (see also Belsole & Fabian, 2007); e.g. due to a recent or ongoing cluster merger. A final complication is that the relic counterlobe observed at 151 MHz might compress and thereby brighten the intracluster gas. Thus the interpretation of the luminosity over the area of the ellipses used for fitting the lobes in X-rays is not straightforward. The values of luminosity per unit area (in 1033 Watts per square arcsecond) are 2.45 and 3.35 for the lobe and counterlobe respectively. Any ICCMB emission should, to first order, have a spectrum closely resembling that of the Cygnus A synchrotron spectrum at 103, however to distinguish between the multi-temperature thermal cluster gas component and the ICCMB component, much higher signal-to-noise and higher resolution spectra are needed.
4.5.4 Duration of previous epoch of jet activity
The relic counterlobe and relic counterjet partly overlay the outer part of the current counterlobe. There is no evidence of relic emission that extends beyond the current hotspot, and the possible relic counterhotspot is situated well within the current counterlobe. Relic lobes are supposed to buoyantly rise in the intracluster medium, and not fall back towards the galaxy nucleus. This indicates that the previous epoch of jet activity lasted for slightly less time than the current period of jet activity, assuming the hotspot advance speed to be the same for both epochs of jet activity. It is possible that the hotspot advance speed was slower during the previous epoch of jet activity, as the intracluster medium density was probably higher. The duration of the current epoch of jet activity is of order 4 107 years, assuming a hotspot advance speed of 0.005 (Alexander & Pooley, 1996).
Schoenmakers et al. (2000) constrain the interruption of jet activity for B 1834+620 to be a few Myrs, very similar to our constraint from the relic X-ray counterjet of about 106 yrs (Steenbrugge et al., 2008). Shabala et al. (2008), modelling current radio loud galaxies, derive the mean jet and quiescent lifetimes per galaxy mass bin. They suggest jet lifetimes which are a bit model dependent, that were just short of the lifetime of the current jets in Cygnus A. However, they claim that the quiescent phase is significantly longer than the timescale derived in this study, namely between 2 107 to 108 years, instead of 106 years. A possible explanation for the difference in the quiescent timescale of Cygnus A and those modelled by Shabala et al. (2008) is that Cygnus A is in a merging cluster of galaxies, which might alter the accretion properties of the nucleus.
5 Conclusion
We have presented a detailed analysis of the low frequency radio images of Cygnus A, which show a marked excess emission in the outer counterlobe compared to the outer lobe. We explain this excess in terms of emission from a relic counterlobe and relic counterjet. The relic counterjet detected at 151 MHz traces the outer parts of the relic counterjet detected in the 200 ks Chandra image. Current counterlobe plasma is compressing and re-energising the relic plasma, and thus making it visible again at low radio frequencies. We calculate that the duration of the previous epoch of jet activity was slightly less than that of the current epoch of jet activity, namely about 107 years.
Acknowledgements
We thank T. Joseph W. Lazio and Paddy Leahy for allowing us to use their data. The authors would like to thank Paul Goodall for his technical computer help. The authors would like to thank the referee, Robert Laing for helpful comments.
References
- Alexander & Pooley (1996) Alexander P., Pooley G. G., 1996, Cygnus A – Study of a Radio Galaxy. pp 149–+
- Baars et al. (1977) Baars J. W. M., Genzel R., Pauliny-Toth I. I. K., Witzel A., 1977, A&A, 61, 99
- Belsole & Fabian (2007) Belsole E., Fabian A. C., 2007, in Böhringer H., Pratt G. W., Finoguenov A., Schuecker P., eds, Heating versus Cooling in Galaxies and Clusters of Galaxies . pp 101–+
- Blundell & Rawlings (2000) Blundell K. M., Rawlings S., 2000, AJ, 119, 1111
- Blundell & Rawlings (2001) Blundell K. M., Rawlings S., 2001, in Laing R. A., Blundell K. M., eds, Particles and Fields in Radio Galaxies Conference Vol. 250 of Astronomical Society of the Pacific Conference Series, Spectral ageing: a new age perspective. pp 363–+
- Blundell et al. (1999) Blundell K. M., Rawlings S., Willott C. J., 1999, AJ, 117, 677
- Carilli et al. (1996) Carilli C., Perley R., Bartel N., Dreher J., 1996, The jets in Cygnus A: from pc- to kpc-scales. Cygnus A – Study of a Radio Galaxy, pp 76–+
- Carilli & Barthel (1996) Carilli C. L., Barthel P. D., 1996, A&ARv, 7, 1
- Carilli et al. (1989) Carilli C. L., Dreher J. W., Conner S., Perley R. A., 1989, AJ, 98, 513
- Carilli et al. (1991) Carilli C. L., Perley R. A., Dreher J. W., Leahy J. P., 1991, ApJ, 383, 554
- Churazov et al. (2001) Churazov E., Brüggen M., Kaiser C. R., Böhringer H., Forman W., 2001, ApJ, 554, 261
- Dennett-Thorpe et al. (1999) Dennett-Thorpe J., Bridle A. H., Laing R. A., Scheuer P. A. G., 1999, MNRAS, 304, 271
- Dickey & Lockman (1990) Dickey J. M., Lockman F. J., 1990, ARAA, 28, 215
- Grevesse & Anders (1989) Grevesse N., Anders E., 1989, in Waddington C. J., ed., Cosmic Abundances of Matter, Vol. 183 of American Institute of Physics Conference Series, Solar-system abundances of the elements - A new table. pp 1–8
- Kaastra et al. (2002) Kaastra J. S., Steenbrugge K. C., Raassen A. J. J., van der Meer R. L. J., Brinkman A. C., Liedahl D. A., Behar E., de Rosa A., 2002, A&A, 386, 427
- Kaastra et al. (2004) Kaastra J. S., Tamura T., Peterson J. R., Bleeker J. A. M., Ferrigno C., Kahn S. M., Paerels F. B. S., Piffaretti R., Branduardi-Raymont G., Böhringer H., 2004, A&A, 413, 415
- Kassim et al. (1996) Kassim N., Perley R. A., Carilli C. L., Harris D. E., Erickson W. C., 1996 Low Frequency Observations of Cygnus A. Cygnus A – Study of a Radio Galaxy, pp 182–+
- Lazio et al. (2006) Lazio T. J. W., Cohen A. S., Kassim N. E., Perley R. A., Erickson W. C., Carilli C. L., Crane P. C., 2006, ApJL, 642, L33
- Leahy (1991) Leahy J. P., 1991, Interpretation of large scale extragalactic jets. Beams and Jets in Astrophysics, pp 100–+
- Leahy et al. (1989) Leahy J. P., Muxlow T. W. B., Stephens P. W., 1989, MNRAS, 239, 401
- Longair et al. (1973) Longair M. S., Ryle M., Scheuer P. A. G., 1973, MNRAS, 164, 243
- Markevitch et al. (1999) Markevitch M., Sarazin C. L., Vikhlinin A., 1999, ApJ, 521, 526
- Owen et al. (1997) Owen F. N., Ledlow M. J., Morrison G. E., Hill J. M., 1997, ApJL, 488, L15+
- Perley & Carilli (1996) Perley R. A., Carilli C. L., 1996 The structure and polarization of Cygnus A at 3.6cm. Cygnus A – Study of a Radio Galaxy, pp 168–+
- Rudnick et al. (1994) Rudnick L., Katz-Stone D. M., Anderson M. C., 1994, ApJS, 90, 955
- Rybicki & Lightman (1986) Rybicki G. B., Lightman A. P., 1986, Radiative Processes in Astrophysics. Wiley-VCH
- Scheuer (1974) Scheuer P. A. G., 1974, MNRAS, 166, 513
- Scheuer & Williams (1968) Scheuer P. A. G., Williams P. J. S., 1968, ARAA, 6, 321
- Schoenmakers et al. (2000) Schoenmakers A. P., de Bruyn A. G., Röttgering H. J. A., van der Laan H., Kaiser C. R., 2000, MNRAS, 315, 371
- Shabala et al. (2008) Shabala S. S., Ash S., Alexander P., Riley J. M., 2008, MNRAS, 388, 625
- Steenbrugge & Blundell (2008) Steenbrugge K. C., Blundell K. M., 2008, MNRAS, 388, 1457
- Steenbrugge et al. (2008) Steenbrugge K. C., Blundell K. M., Duffy P., 2008, MNRAS, 388, 1465
- Walker et al. (2000) Walker R. C., Dhawan V., Romney J. D., Kellermann K. I., Vermeulen R. C., 2000, ApJ, 530, 233
- Wilson et al. (2006) Wilson A. S., Smith D. A., Young A. J., 2006, ApJL, 644, L9