Multi-Wavelength Properties of the Type IIb SN 2008ax
Abstract
We present the UV, optical, X-ray, and radio properties of the Type IIb SN 2008ax discovered in NGC 4490. The observations in the UV are one of the earliest of a Type IIb supernova (SN). On approximately day four after the explosion, a dramatic upturn in the and () light curves occurred after an intitial rapid decline which is attributed to adiabatic cooling after the initial shock breakout. This rapid decline and upturn is reminiscent of the Type IIb SN 1993J on day six after the explosion. Optical/near-IR spectra taken around the peak reveal prominent , HeI, and CaII absorption lines. A fading X-ray source is also located at the position of SN 2008ax, implying an interaction of the SN shock with the surrounding circumstellar material and a mass-loss rate of the progenitor of . The unusual time evolution () of the peak radio luminosity provides further evidence that the mass-loss rate is low. Combining the UV, optical, X-ray, and radio data with models of helium exploding stars implies the progenitor of SN 2008ax was an unmixed star in an interacting-binary. Modeling of the SN light curve suggests a kinetic energy () of , an ejecta mass () of , and a nickel mass () of .
1 Introduction
Type IIb supernovae (SNe), first proposed by Woosley et al. (1987), were suggested to be the result of the core-collapse of a Type Ib progenitor that has a small, but non-negligible (; Pastorello et al. 2008; hereafter P08), H-envelope. This SN type is arguably one of the rarest and most interesting. Only have been discovered in the last 20+ years and only a handful, such as SNe 1987K (Filippenko, 1988), 1993J (Nomoto et al., 1993), 1996cb (Qiu et al., 1999), and 2008ax (P08), have been well observed.
In this Letter, we report on imaging observations of SN 2008ax with the Swift (Gehrels et al., 2004) Ultra-Violet/Optical Telescope (UVOT; Roming et al., 2005) and X-Ray Telescope (XRT; Burrows et al., 2005), the Chandra Advanced CCD Imaging Spectrometer (ACIS), and the Very Large Array (VLA), as well as spectroscopic observations with the Hobby-Eberly Telescope (HET; Ramsey et al., 1998). The UVOT observations are one of the earliest reported observations in the UV of a Type IIb SNe, second only to the International Ultraviolet Explorer (IUE) observations of SN 1993J (de Boer et al., 1993).
2 Observations and Data Reductions
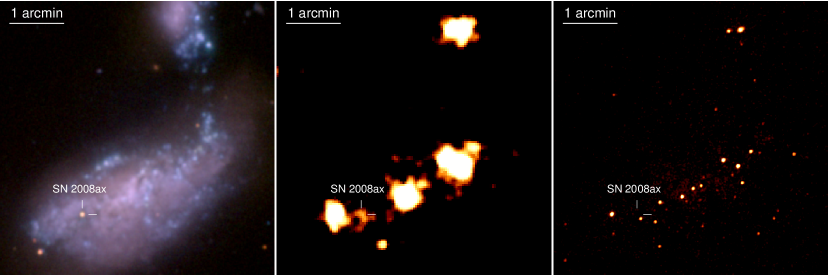
SN 2008ax (Figure 1) was discovered on 2008-03-3.45 (UT) in NGC 4490 at , (Mostardi et al., 2008). Based on this detection time and the non-detection of the SN approximately six hours earlier, P08 set the time of the shock breakout at , which is adopted here.
The UVOT observed SN 2008ax from 2008-03-04 () to 2008-04-26 (). Observations were performed with a cadence varying between using three optical (, , ) and three UV (, , : 1928, 2246, , respectively; Poole et al., 2008) filters. A later observation on 2008-11-23 was made after the SN had faded for use as a galaxy subtraction template. Photometry using a source aperture, including template galaxy flux subtraction, was performed following the method outlined in Brown et al. (2009). The data reduction pipeline used the HEASOFT 6.6.3 and Swift Release 3.3 analysis tools with UVOT zero-points from Poole et al. (2008). The resulting light curves are presented in Table 1 and Figure 2.
We note that for the majority of SNe analyzed with Swift analysis tools, UVOT photometry is well behaved. However, in the case of SN 2008ax, the exceptionally bright host galaxy underlying the SN leads to small offsets in magnitude due to coincidence losses (cf. Fordham et al., 2000) in bright extended backgrounds. This results in the reported magnitudes being (-filter) and (-filter) fainter than the P08 magnitudes. Although this offset influences the UVOT -band as well, the -filter has more throughput in the blue than ground-based filters. This is the most probable contributor to the increase in the -band peak as compared to P08. Since the background galaxy count rate is significantly lower in the UV, the UV filters aren’t affected by this undersampling.
To determine the peak magnitude () and time of peak () in each filter, Monte Carlo simulations fitting a cubic spline to the data points in each filter were performed. The mean of the distributions were taken as the peak times and magnitudes, with the standard deviations as the errors (Table 1). Rise times to peak () and absolute magnitudes () were calculated using the time of shock breakout as the temporal zero point and the distance modulus (), respectively, as determined in P08. Errors were calculated in quadrature (Table 1). None of the magnitudes include extinction or k-corrections. Since filter observations only provide two detections, the upper limits were treated as detections for the simulations; therefore, and are probably lower than reported.
| Time | Observed Magnitudes | |||||
|---|---|---|---|---|---|---|
| (JD2454500+) | ||||||
| (19.93) | — | — | ||||
| — | — | (19.67) | ||||
| — | — | (17.37) | — | — | — | |
| — | — | |||||
| (19.17) | ||||||
| — | — | |||||
| — | ||||||
| — | (19.42) | — | — | — | — | |
| — | ||||||
| — | — | |||||
| (19.85) | (19.57) | — | — | — | — | |
| — | — | |||||
| — | — | |||||
| — | — | |||||
| — | — | |||||
| — | — | |||||
| — | ||||||
| — | (19.84) | — | — | — | — | |
| — | — | |||||
| (19.92) | — | — | — | — | — | |
| — | — | |||||
To calculate , a spectrum of a similar Type IIb SN (1993J; Jeffery et al., 1994) taken near peak was de-reddened and red-shifted to the rest frame for use as a template. Milky Way (MW) and host extinction were then computed using the value from P08 and applied to our spectral template using the Cardelli et al. (1989) MW and Pei (1992) SMC laws, respectively. Extinction and k-corrections (Table 2) were computed using spectrophotometric methods; extinction corrections were computed via the subtraction of synthetic magnitudes of an unreddened and reddened template spectrum in the observed frame, while k-corrections were computed via the subtraction of synthetic magnitudes from the unreddened template spectrum in the rest and observed frames.
| Extinction (Host + MW) | -2.07 | -2.44 | -1.74 | -1.47 | -1.23 | -0.94 |
| k-Correction | -0.06 | -0.09 | -0.09 | -0.09 | -0.02 | +0.01 |
We analyzed all XRT observations obtained between 2009-03-05 and 2009-04-26. Due to a nearby X-ray source ( from the SN), X-ray counts were extracted within a 2-pixel () radius circular region centered on the optical position of the SN. The background was extracted locally to account for detector and sky background, and unresolved emission from the host. An X-ray source is detected (-level) in the merged 51.3 ks XRT data (Figure 1-Middle) at the position of the SN with a PSF, sampling deadtime, and vignetting-corrected net count rate of . Adopting a thermal plasma spectrum ( keV; cf. Fransson et al., 2002) and assuming a Galactic foreground column density with no intrinsic absorption (; Dickey & Lockman, 1990) gives a 0.2–10 keV flux and luminosity of and , respectively (assuming 9.6 Mpc; P08). Rebinning the data into two epochs (2008-03-05 to 2008-03-31 and 2008-04-04 to 2008-04-26) with similar exposure times (24.3 ks and 27 ks, respectively) shows the X-ray source faded by from to during the observations.
We further analyzed archival pre-SN ACIS data obtained on 2000-11-03, 2004-07-29, and 2004-11-20 to characterize the X-ray contamination of the SN with the nearby X-ray source. No X-ray source is visible at the position of the SN (Figure 1-Right), but the nearby X-ray source is clearly detected, with an average luminosity of . Comparison of the X-ray luminosity for each of the three epochs shows the source isn’t variable. We therefore extracted the counts from the position of the SN from the XRT data using a larger aperture corresponding to the 100% encircled energy radius of the XRT PSF, which contains the nearby X-ray source, and subtracted the luminosity of the Chandra source. Within the errors, the same residual X-ray luminosity for the source at the position of the SN is obtained when compared to the above analysis using a smaller aperture.
Radio observations were made with the VLA111The VLA of the National Radio Astronomy Observatory is operated by Associated Universities, Inc. under a cooperative agreement with the National Science Foundation. at 1.3, 3.6, 6.0, and 20 cm in continuum mode. Initial data reduction and analysis of the radio data was similar to the methods used for SNe 1993J and 2001gd (Weiler et al., 2007; Stockdale et al., 2007).
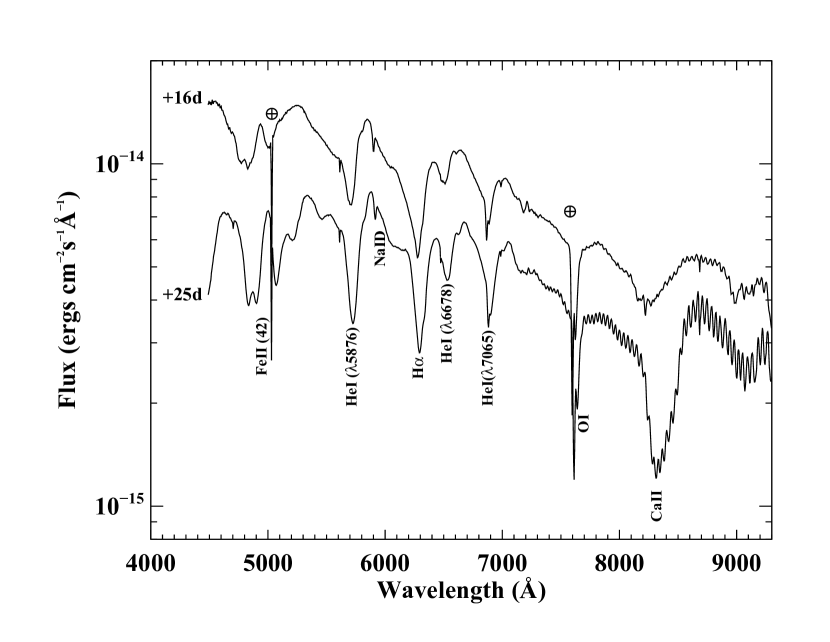
SN 2008ax was observed with the HET on 2008-03-19 and 2008-03-28, for 600 and , respectively. The Low Resolution Spectrograph (LRS; Hill et al., 1998) was used with a 2″ slit (; ). Standard IRAF reduction techniques of bias subtraction, flat fielding, and wavelength calibration were used. Relative flux calibration was performed using several flux standards (BD262606, HD84937, & HZ44; Fukugita et al., 1996; Massey & Gronwall, 1990) observed during March 2008. The spectra are displayed in Figure 3.
3 Results
Observations of SN 2008ax began after explosion and continued until day 54. The SN was detected in all UVOT color filters, but after template subtraction, fewer detections remained in the and filters. Assuming a SN 1993J-like UV spectrum, this is expected since the UV flux is intrinsically fainter due to line blanketing, and (P08) therefore the UV flux is more suppressed (see Table 2).
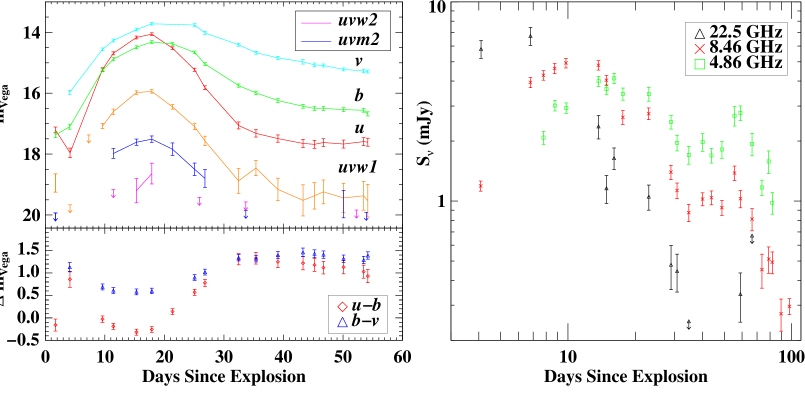
The general trend for the light curves is that the UV bands tend to rise more rapidly, peak earlier, and decay more rapidly than the optical bands (see Table 1). This trend is also seen in a sample of UV/optical light curves of Type II SNe (Brown et al., 2009). The and SN 2008ax light curve shapes are consistent with those of P08. A small shoulder in the is also seen in the first observation.
Also evident is an initial fading in the and light curves followed by a rise reminiscent of the dip seen in SNe 1987A (Type II; Hamuy et al., 1988), 1993J (IIb; Schmidt et al., 1993), 1999ex (Ibc; Stritzinger et al. 2002; hereafter S02), 2008D (Ibc; Soderberg et al., 2008), and 2006aj (Ic; Campana et al., 2006). The same shoulder in the and the upturn in the seen in SN 1999ex on day four after the explosion (S02) is also seen in the UVOT and data for SN 2008ax on approximately day four. Additionally, a UV upturn is present which is the first time this has been seen in a Type IIb SN and only the third time in any SNe (cf. SNe 1987A & 2006aj; Pun et al., 1995; Campana et al., 2006). This dip in the light curve is attributed to adiabatic cooling after the initial shock breakout (S02), and reinforces the idea that the progenitor is the result of a core-collapse of a massive star (S02). Using HST data, Crockett et al. (2008) further constrained that the SN 2008ax progenitor was either a single massive star that lost most of its H-envelope prior to exploding or an interacting binary in a low-mass cluster.
Using the method described by Richardson et al. (2006), we performed a Monte Carlo simulation with realizations of the SN 2008ax -band light curve222The Jeffery (1999) portion of the model used by Richardson et al. (2006) was excluded from our simulation since no late time data are included in our sample. The Arnett (1982) portion of the model alone fit the light curves reasonably well. by varying three model parameters: kinetic energy (), ejected mass (), and ejected nickel mass (). The best fit resulted in , , and . The resultant parameters are consistent with values calculated by Richardson et al. (2006) for other Type IIb SNe, except that the SN 2008ax value for is higher.
A () and () color plot (Figure 2-Lower-Left) tracks temperature variations in the photosphere (Stritzinger et al. 2009; hereafter S09). Initially, the blue to red jump () is due to the adiabatic cooling discussed previously. This is followed by a transition back to the blue as the photospheric temperature increases and the light curves reach maximum. As the temperature decreases, the color curves transition back to the red and begin to level off. Of note is that the and light curves stop declining in brightness at after maximum. This corresponds with the color evolution to the blue in the at the same time. This blue excess was also seen in SNe 2007Y and 2008aq, and was attributed to a change in the opacity of the ejecta, or shock heating produced by interaction of high-velocity SN ejecta with circumstellar material (CSM; S09).
The lack of an X-ray source in pre-SN Chandra images and the detection of a fading X-ray source in Swift XRT data confirms that X-ray emission is detected from SN 2008ax. These X-rays likely arise from interaction of the outgoing SN shock with substantial amounts of CSM. If the CSM was deposited by a strong stellar wind prior to outburst, as expected for the massive progenitor of a SN IIb, the X-ray luminosity can be used to estimate the mass-loss rate. Following the discussion in Immler et al. (2007), we infer a mass-loss rate of the progenitor of for an assumed speed of the outgoing shock of and scaled for a stellar wind speed of . Only two other SN IIb have been detected in X-rays over the past four decades: SNe 1993J (Chandra et al., 2006) and 2001gd (Pérez-Torres et al., 2005). In contrast, SN 2008ax is only a weak X-ray emitter, one and two orders of magnitude fainter than SNe 2001gd and 1993J, respectively. Subsequently, the inferred mass-loss rate for the progenitor of SN 2008ax is significantly below that of SN 1993J (; Immler et al., 2001) and more characteristic of SNe IIP (; cf. Chevalier et al., 2006; Immler et al., 2007). This wide range of mass-loss rates for SNe IIb could be caused by a diversity of binary progenitor systems333Note: SN 1993J doesn’t show signs in its radio evolution of having been in a binary system (Weiler et al., 2007), although other wavebands indicate otherwise (Van Dyk, 2004)..
The general nature of the SN 2008ax radio light curve (Figure 2-Right) is very typical of core-collapse SN (CCSNe; Martí-Vidal et al., 2009; Weiler et al., 2002). However, the time evolution of the radio emission is somewhat unusual for a Type IIb radio SN when compared to SNe 1993J, 2001gd, and 2001ig (Weiler et al., 2007; Stockdale et al., 2007; Ryder et al., 2004, 2006). SN 2008ax reached its 6 cm peak radio luminosity in 14 days, while SN 1993J took 133 days after explosion to achieve peak (Weiler et al., 2007). The exact time to reach this point is uncertain for both SNe 2001gd and 2001ig, but the parameterized models outlined in Weiler et al. (2002) indicate the peak occurred at (Stockdale et al., 2007; Ryder et al., 2004). In contrast, the first event associated with a Type Ic SN and a gamma-ray burst, SN 1998bw/GRB 980425, reached its peak 6 cm radio luminosity in 10 days (Weiler et al., 2001).
A typical radio-derived mass-loss rate for the earlier Type IIb SNe is (Weiler et al., 2002). The exact radio-derived mass-loss rate for SN 2008ax is difficult to establish as the exact nature of the SN progenitor is ambiguous (Crockett et al., 2008). Following the discussion in Weiler et al. (2002), we infer a range of possible mass-loss rate of the progenitor of for an assumed speed of the outgoing shock of and scaled for a stellar wind speed of . The ambiguity of the nature of the progenitor makes the wind speed of the progenitor-established CSM very uncertain.
Furthermore, the radio evolution of SN 2008ax appears to show short time scale modulations of (see Figure 2-Right). This may be similar to the evolution of SN 2001ig whose progenitor was attributed to an interacting-binary system or the evolution of SN 1998bw whose progenitor was a very massive star (Ryder et al., 2004, 2006; Weiler et al., 2001). A deeper analysis of the radio evolution of SN 2008ax is on-going.
Spectroscopic observations of SN 2008ax occurred 16 and 25 days after explosion. The HET spectra (Figure 3) are very similar — with prominent and HeI lines — to SNe 1993J (Jeffery et al., 1994) and 2008ax (P08) spectra taken 18 and 28 days post explosion, respectively. P08 showed at 56 days that CaII was also present in SN 2008ax, but presented no data redward of previous to this time. HET spectra reveal that the CaII absorption line was significant at 16 days ( days before -peak) and was a factor of larger nine days later. This behavior is reminiscent of SNe 2005bf (Ibc; Folatelli et al., 2006) and 2007Y (Ib; S09). Both SNe had very early strong CaII absorption lines, followed by a decrease in strength, and then a rapid increase in strength. Assuming the early time CaII absoprtion in SN 2008ax was also strong and then weakened, the HET spectra indicate around peak and after peak that CaII is caused by a photospheric, rather than a high velocity component above the photosphere (S09; Parrent et al., 2007). The behavior of the blueward components of the HET spectra, particularly the strengthening of the HeI lines, are consistent with the P08 results.
4 Conclusion
The and light curves of SN 2008ax show a rapid initial decline to a minimum approximately four days after shock breakout. The SN then brightens to maximum light in the -band at days after shock breakout. This behaviour is seen in other CCSNe and is predicted in numerical models of CCSNe with stripped atmospheres (Shigeyama et al., 1990, 1994). However, it isn’t seen in most CCSNe light curves. This may be due to the paucity of detailed early-time observations for most SNe, or indicate a physical difference in the progenitors. The dip is attributed to rapid adiabatic cooling of the photosphere, which is accelerated by the shock passage. The time scale of adiabatic cooling depends on the volume of the photospheric shell, and thus the radius of the progenitor. Modelling of CCSNe with stripped atmospheres suggests that the adiabatic cooling acts on time scales of several days, which is in agreement with the UV minimum seen in SN 2008ax.
Shigeyama et al. (1990) produced models of exploding helium stars, which are believed to produce SNe IIb. The model assumes the progenitor is a stripped star in a binary system. From the X-ray and radio mass-loss rates coupled with the short time evolution of the radio emission, the SN 2008ax progenitor appears to have been in an interacting binary, consistent with the work of Crockett et al. (2008). The observed time of maximum light and shape of the later SN 2008ax light curve are consistent with an unmixed progenitor model which produces early UV dips lasting longer than those with mixing in the progenitor. Dips in mixed models tend to have minima at days while those in unmixed models tend to have minima at 5–10 days. The time of the SN 2008ax dip is consistent with a mixed progenitor; however, the time is uncertain due to the lack of very early time data. It’s therefore possible that the true minimum occurred later than days, as is predicted for unmixed models. Further evidence for an unmixed progenitor comes from the strength of the dip. The observed dip is magnitudes consistent with an unmixed model. These three lines of evidence suggest that the progenitor of SN 2008ax was either unmixed, or very lightly mixed.
Shigeyama et al. (1990) find that helium stars with less mixing tend to be more massive than those that undergo extensive mixing. If the progenitor of SN 2008ax is unmixed then it may be on the more massive side of the progenitor mass distribution. This supports our result that the mass-loss rate from SN 2008ax is lower than for a typical Type IIb SNe.
The onset and strength of the adiabatic cooling dip increases as the progenitor mass increases, so more massive progenitors have more prominent adiabatic cooling following the shock breakout. This suggests that the lack of an observed cooling dip for many SNe IIb may be due to less massive progenitors. This, combined with the paucity of high-cadence early-time observations, may explain why the cooling dip is not seen in many SNe IIb.
References
- Arnett (1982) Arnett, W. D. 1982, ApJ, 253, 785
- Brown et al. (2009) Brown, P. J., et al. 2009, AJ, 137, 4517
- Burrows et al. (2005) Burrows, D. N., et al. 2005, Space Sci. Rev., 120, 165
- Campana et al. (2006) Campana, S., et al. 2006, Nature, 442, 1008
- Cardelli et al. (1989) Cardelli, J. A., Clayton, G. C., & Mathis, J. S. 1989, ApJ, 345, 245
- Chandra et al. (2006) Chandra, P., et al. 2008, ApJ, 683, 924
- Chevalier et al. (2006) Chevalier, R. A., Fransson, C., & Nymark, T. K. 2006, ApJ, 641, 1029
- Crockett et al. (2008) Crockett, R. M., et al. 2008, MNRAS, 391, L5
- de Boer et al. (1993) de Boer, K. S., Pascual, P. R., Wamsteker, W., Sonneborn, G., Fransson, C., Bomans, D. J., & Kirshner, R. P. 1993, A&A, 280, L15
- Dickey & Lockman (1990) Dickey, J. M., & Lockman, F. J. 1990, ARA&A, 28, 215
- Filippenko (1988) Filippenko, A. V. 1988, AJ, 96, 1941
- Folatelli et al. (2006) Folatelli, G., et al. 2006, ApJ, 641, 1039
- Fordham et al. (2000) Fordham, J. L. A., Moorhead, C. F., & Galbraith, R. F. 2000, MNRAS, 312, 83
- Fransson et al. (2002) Fransson, C., Lundqvist, P., & Chevalier, R. A. 1996, ApJ, 461, 993
- Fukugita et al. (1996) Fukugita, M., Ichikawa, T., Gunn, J. E., Doi, M., Shimasaku, K., Schneider, D. P. 1996, AJ, 111, 1748
- Gehrels et al. (2004) Gehrels, N., et al. 2004, ApJ, 611, 1005
- Hamuy et al. (1988) Hamuy, M., Suntzeff, N. B., González, R., & Martin, G. 1988, AJ, 95, 63
- Hill et al. (1998) Hill, G. J., Nicklas, H. E., MacQueen, P. J., Tejada, C., Cobos Duenas, F. J., & Mitsch, W. 1998, Proc. SPIE, 3355, 375
- Immler et al. (2001) Immler, S., Aschenbach, B., & Wang, Q. D. 2001, ApJ, 561, 107
- Immler et al. (2007) Immler, S., et al. 2007, ApJ, 664, 435
- Jeffery (1999) Jeffery, D. J. 1999, astro-ph/9907015
- Jeffery et al. (1994) Jeffery, D. J., et al. 1994, ApJ, 421, 27
- Martí-Vidal et al. (2009) Martí-Vidal, I., et al. 2009, A&A, 499, 649
- Massey & Gronwall (1990) Massey, P., & Gronwall, C. 1990, ApJ, 358, 344
- Mostardi et al. (2008) Mostardi, R., Li, W., & Filippenko, A. V. 2008, CBET 1280
- Nomoto et al. (1993) Nomoto, K., Suzuki, T., Shigeyama, T., Kumagai, S., Yamaoka, H., & Saio, H. 1993, Nature, 364, 507
- Parrent et al. (2007) Parrent, J., et al. 2004, PASP, 119, 135
- Pastorello et al. (2008) Pastorello, A., et al. 2008, MNRAS, 389, 955 (P08)
- Pei (1992) Pei, Y. C. 1992, ApJ, 395, 130
- Pérez-Torres et al. (2005) Pérez-Torres, M. A., et al. 2005, MNRAS, 360, 1055
- Poole et al. (2008) Poole, T. S., et al. 2008, MNRAS, 383, 627
- Pun et al. (1995) Pun, C. S. J., et al. 1995, ApJS, 99, 223
- Qiu et al. (1999) Qiu, Y., Li, W., Qiao, Q., & Hu, J. 1999, AJ, 117, 736
- Ramsey et al. (1998) Ramsey, L. W., et al. 1998, Proc. SPIE, 3352, 34
- Richardson et al. (2006) Richardson, D., Branch, D., & Baron, E. 2006, AJ, 131, 2233
- Roming et al. (2005) Roming, P. W. A., et al. 2005, Space Sci. Rev., 120, 95
- Ryder et al. (2004) Ryder, S. D., et al. 2004, MNRAS, 349, 1093
- Ryder et al. (2006) Ryder, S. D., et al. 2006, MNRAS, 369, L32
- Schmidt et al. (1993) Schmidt, B. P., et al. 1993, Nature, 364, 600
- Shigeyama et al. (1990) Shigeyama, T., Nomoto, K., Tsujimoto, T., & Hashimoto, M. 1990, ApJ, 361, L23
- Shigeyama et al. (1994) Shigeyama, T., Suzuki, T., Kumagal, S., Nomoto, K., Saio, H., & Yamaoka, H. 1994, ApJ, 420, 341
- Soderberg et al. (2008) Soderberg, A. M., et al. 2008, Nature, 453, 469
- Stockdale et al. (2007) Stockdale, C. J., et al. 2007, ApJ, 671, 689
- Stritzinger et al. (2002) Stritzinger, M., et al. 2002, AJ, 124, 2100 (S02)
- Stritzinger et al. (2009) Stritzinger, M., et al. 2009, ApJ, 696, 713 (S09)
- Van Dyk (2004) Van Dyk, S. D. 2004, New A Rev., 48, 749
- Weiler et al. (2001) Weiler, K. W., Panagia, N., & Montes, M. J. 2001, ApJ, 562, 670
- Weiler et al. (2002) Weiler, K. W., et al. 2002, ARA&A, 40, 387
- Weiler et al. (2007) Weiler, K. W., et al. 2007, ApJ, 671, 1959
- Woosley et al. (1987) Woosley, S. E., Pinto, P. A., Martin, P. G., & Weaver, T. A. 1987, ApJ, 318, 664