On the chemical bonding effects in the Raman response: Benzenethiol adsorbed on silver clusters
Abstract
We study the effects of chemical bonding on Raman scattering from benzenethiol chemisorbed on silver clusters using time-dependent density functional theory (TDDFT). Raman scattering cross sections are computed using a formalism that employs analytical derivatives of frequency-dependent electronic polarizabilities, which treats both off-resonant and resonant enhancement within the same scheme. In the off-resonant regime, Raman scattering into molecular vibrational modes is enhanced by one order of magnitude and shows pronounced dependence on the orientation and the local symmetry of the molecule. Additional strong enhancement of the order of arises from resonant transitions to mixed metal–molecular electronic states. The Raman enhancement is analyzed using Raman excitation profiles (REPs) for the range of excitation energies eV, in which isolated benzenethiol does not have electronic transitions. The computed vibrational frequency shifts and relative Raman scattering cross sections of the metal–molecular complexes are in good agreement with experimental data on surface enhanced Raman scattering (SERS) for benzenethiol adsorbed on silver surfaces. Characterization and understanding of these effects, associated with chemical enhancement mechanism, may be used to improve the detection sensitivity in molecular Raman scattering.
I Introduction
Raman scattering from molecules in proximity to a rough noble-metal surface or near a metal nanoparticle is strongly enhanced due to the interaction with surface plasmon modes and to the formation of metal–molecular complexes. Moskovits_Rev ; Otto_Rev This phenomenon, which allows for the measurement of Raman spectra of extremely low concentrations of molecules Meixner with a single-molecule detection as its ultimate limit, Nie_SM ; Kneipp_SM is very attractive for sensor applications. In particular, it could be utilized for detection and identification of hazardous materials SERSdetect1 ; SERSdetect2 or for probing of biological structures, SERSbio for which Raman fingerprints provide unique information about molecular composition.
Recent achievements in the design of nanostructured materials demonstrate substantial progress toward resolving the long-standing problem of low reproducibility of SERS substrates. Arrays of nanoantennas fabricated with electron beam lithography Ken or nanoimprinting Chou utilize extended control of optically excited surface plasmons to tune the plasmon resonance frequency and to focus the near field in particular areas. Lithographically engineered VD_str ; Reinhard or laser-engineered Eric structures allow the observation of a spatially homogeneous enhancement of the Raman signal by 7 orders of magnitude EF_note when an excitation laser frequency far below intramolecular resonances is employed. However, there remains a number of open questions which are related to the formation of hot spots and to the homogeneity of the Raman response throughout a sample. The enormous Raman cross section reported for fluorescent dyes in hot spots Nie_SM has a substantial contribution from an intramolecular resonant excitation. VD_sm On the other hand, many important analytes do not have electronic excitations in the available range of laser frequencies. For these systems, a relevant question is whether modification of the local environment of the molecule can be used to boost the limit of Raman detection sensitivity.
The importance of the so-called chemical enhancement Moskovits_Rev ; ChemEnh2 ; ChemEnh3 has been debated since the early years after the discovery of SERS. The contributions of the electromagnetic coupling and the chemical binding are not clearly separable in the experiments, ChemEnh3 because the first process is essential for SERS detection. This adds to ambiguity in the interpretation of SERS experiments. Moreover, the electronic coupling effects are sensitive to the local environment of adsorbed molecules, which makes a systematic analysis of chemical effects more difficult. General theories of chemical enhancement Persson ; Adrian ; Birke provide an intuitive picture of the mechanism, but rely on phenomenological parameters. In this context, first-principles modeling Schatz_Rev is a useful tool that complements experimental studies and provides additional information about microscopic properties of a metal surface/adsorbed molecule interface.
Complete modeling of a molecule chemisorbed on a rough metal surface requires multi-scale simulations, in which the electronic structure of a molecule and its local environment are treated by quantum chemical methods while a larger-scale environment is accounted for by a mean-field approximation. However, to understand the chemical bonding effects in SERS, it is enough to simulate only the local environment of a molecule. This is consistent with the “adatom model”, Moskovits_Rev which assumes that the atomic-scale roughness features determine the hot spots on a metal surface. Obviously, such an approach does not account for the electromagnetic enhancement due to the excitation of surface plasmons in the metal. An interference between the chemical and the electromagnetic effects is ignored as well. To get the total enhancement factor one has to use a conventional phenomenological relation ChemEnh2 which assumes that both effects enter in multiplicative fashion. In most previous theoretical studies of SERS, only a few metal atoms were used to model the molecule/surface interaction. For instance, in Ref. Aroca the authors considered a complex with a single Ag atom to mimic a chemisorption of phthalimide on a silver surface and obtained a reasonable agreement with experiments. Recently, Schatz and co-workers reported a resonance Raman response calculation procedure using phenomenological lifetime parameters for electronic polarizability derivatives. SchatzRR This procedure has been applied to study SERS of pyridine adsorbed on silver clusters up to a few tens of atoms. Schatz_JACS ; Jensen07 ; Jensen09 The authors identified three different mechanisms contributing to SERS: change in static polarizability of the molecule upon adsorption, resonant enhancement due to charge–transfer transitions, and electromagnetic enhancement due to coupling with a strong excitation in a metal cluster, and discussed their role in SERS. In Ref. Jensen09 some examples of different molecules and pyridine with substituents have been considered. However, no systematic studies of other molecular structures have been done yet. Given the differences in the chemical bonding of pyridine and thiols to metal surfaces, it is important to know how general these findings are and whether they can be applied to other types of metal–molecular coupling or to other molecules.
In this paper, we address effects related to chemical bonding on Raman scattering from benzenethiol adsorbed on silver clusters Agn, , which is one of the most commonly used analytes in SERS experiments. We link the enhancement of Raman response to the modification of the molecular electronic structure due to adsorption. Excitation energies and transition moments of the metal–molecular complexes are substantially different from those of bare metal clusters and of isolated benzenethiol. For off-resonant excitations, Raman response is enhanced by one order of magnitude. To understand the importance of the cluster geometry, we modeled a pool of 7 different metal–molecular complexes. We identify the effects that contribute to the off-resonant Raman enhancement, such as the molecular orientational effect, the effect of the local symmetry of the adsorbate, and the effect of the proximity of the vibrational mode to a binding site. Stochastic modulation of these effects by thermal motion is related to “blinking” events observed in recent SERS experiments on 4-aminobenzenethiol. Moerner ; Natelson We compare the computed vibrational frequency shifts and relative Raman scattering cross sections of the the metal–molecular complexes to experimental SERS data for benzenethiol adsorbed on silver surfaces. VanDuyne09 ; Carron ; SERS-Roshi ; VanDuyne05
Our theoretical approach to compute Raman scattering cross section is based on analytical derivatives of frequency-dependent polarizabilities. Rappoport The frequency dependence of polarizability derivatives includes resonance enhancement effects in an approximate fashion, which allows us to describe both off-resonance and resonance enhancement effects on an equal footing and to study resonance excitation profiles of Raman scattering cross sections. However, this approach does not take into account the finite lifetime of the excited states. As a result, the Raman scattering cross sections computed within our approach diverge in the strictly resonant case.
We demonstrate that formation of mixed metal–molecular electronic states results in a resonance structure in the Raman excitation profiles (REPs) for molecular vibrations within the excitation range eV, which is far below the purely intramolecular transitions. Our lower-bound estimates of the Raman signal enhancement due to chemical bonding is of the order of in the absence of intramolecular resonances. The chemical bonding effect thus provides additional flexibility in controlling the enhancement of Raman scattering from chemisorbed species.
The paper is organized as follows: in Sec. II we describe the details of our computational procedure. In Sec. III.1-III.4 the computed results are presented and different mechanisms contributing to the Raman enhancement are discussed. In particular, we show that the orientation of the benzene ring has a substantial effect on the Raman scattering cross section. We also identify metal-molecular states responsible for the resonant enhancement of the Raman response of the computed complexes. In Sec. III.5 the computed Raman spectra are compared to available experimental data. The conclusions are formulated in Sec. IV.
II Computational Details
Density functional calculations were performed using the quantum chemistry package Turbomole, version 5.10. TM_general Triple- valence-polarization basis sets (def2-TZVP BS_def2 ) were used for the main group elements while for silver atoms we employed split-valence basis sets with polarization (def2-SV(P) BS_defSVP ) and effective core potentials (ECP) comprising the 28 core electrons and accounting for scalar relativistic effects. BS_ecp Preliminary calculations showed that expanding the molecular basis set up to quadruple- quality BS_def2 does not significantly alter the results.
Our choice of the computed exchange-correlation functional was guided by the balance between the accuracy of the computed Raman scattering cross sections and an accurate description of electronic and geometric parameters of Agn clusters. We chose the hybrid functional of Perdew, Burke, and Ernzerhof (PBE0) PBE0 which provides good accuracy for frequency-dependent polarizabilities and Raman scattering cross sections. Caillie_pol ; Caillie_raman While many computational studies of metal clusters have been traditionally performed with gradient-corrected exchange-correlation functionals, Ag_abs ; Ag_abs_PRB hybrid functionals were found to yield good structural parameters and band gaps in extended systems. Kresse
The charge-transfer error of approximate exchange-correlation functionals is a significant challenge in TDDFT calculations, although several recent works have proposed approaches to address this problem. Neepa ; CAMB3LYP ; Troy ; FuncCT The charge-transfer error results in an overestimation of electronic polarizabilities and an underestimation of electronic excitation energies, however these effects are ameliorated by inclusion of a fraction of non-local Hartree–Fock exchange in hybrid functionals such as PBE0, Caillie_raman ; CAMB3LYP which we use in this work.
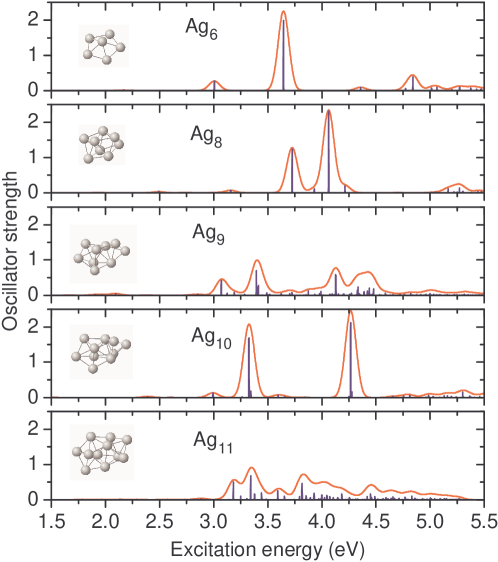
Ground state structure optimizations of silver clusters Agn with = 6–11 were performed using the PBE0 functional. Force-constant calculations were used to confirm that the optimized structures correspond to local minima of the electronic potential energy surface. TM_force Many energetically close-lying structure minima are known to exist in small Agn clusters Ag_abs ; Idrobo ; Idrobo11 . We concentrated on structures suitable to represent atomic-scale roughness features, especially those with pyramidal or bipyramidal shape. For instance, for the Ag6 cluster the pyramidal isomer, which might be considered as a more realistic model for atomic-scale roughness, rather than the lowest-energy planar structure of symmetry Ag_abs ; Idrobo was used. For each optimized cluster structure, the 200 lowest electronic excitations were computed using TDDFT in the frequency-based linear response regime.Casida ; TM_excitedBauer ; TM_excited The obtained line spectra were broadened using an empirical Gaussian broadening parameter of 0.05 eV.
Oxidative attachment of the benzenethiol molecule Whitesides ; Maddix was modeled by placing the benzenethiol radical (PhS) at different atomic binding sites and fully reoptimizing the structures of the PhS–Agn complexes. Raman spectra of benzenethiol and PhS–Agn complexes were obtained from analytical derivatives of frequency-dependent polarizabilities. Rappoport This approach is based on the polarizability Lagrangian and allows for efficient computation of Raman spectra of medium-sized and large molecules. Raman spectra of benzenethiol and PhS–Agn complexes were computed for a low-energy excitation of 0.62 eV (2000 nm) to investigate the off-resonance Raman scattering enhancement. Raman excitation profiles of benzenethiol and PhS–Agn were computed for the range of 1.6–3.0 eV for the four strongest vibrational modes of the benzenethiolate group. No scaling of vibrational frequencies was applied. The Raman spectra were simulated by Lorentzian broadening of the line spectra using an empirical linewidth of 5 cm-1. A scattering angle of 90 degrees and perpendicular polarization of both incident and scattered radiation was assumed unless specified otherwise.
III Results and Discussion
III.1 Silver Clusters and Metal-Molecular Complexes
The computed structures of the clusters Agn, , are in agreement with results of previous works. Ag_abs The clusters with an even number of atoms were found to be closed-shell singlets while the odd-numbered clusters are spin doublets. The relative energies of the structures are dependent on the particular choice of the exchange-correlation functional. Among the simulated structures, several metal clusters were selected based on their similarity in geometry. In particular, the geometries derived from the bipyramidal structure of Ag7 were chosen.
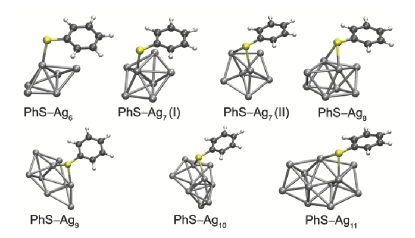
The benzenethiol molecule binds to the Ag metal surface via the thiolate bond. To construct the metal–molecular complexes the central atom of the bipyramid has been chosen as a binding site. The final optimized geometries of PhS–Agn, , are shown in Fig. 1. In most configurations the sulfur atom migrates to the middle of an Ag–Ag bond forming a bridging motif. This is consistent with previous theoretical studies of benzenethiol chemisorbed on Au surfaces. PhS_Au_geom For a better understanding of properties of the PhS–Agn complexes the simplest structure—benzenethiol bound to a single Ag atom—has been simulated. Addition of benzenethiol to the –symmetric Ag6 cluster leads to a rearrangement of the metal atoms to form a –symmetric cluster structure, see Fig. 1. However, we find that the structure of Ag6 does not correspond to a local minimum for the PBE0 functional. Starting with approximately similar initial conditions, two stable isomers of the PhS–Ag7 complex with an on-top and a bridging binding motif have been obtained, respectively. The energy difference between these two structures is approximately 3 kcal/mol, with the lower configuration corresponding to the complex with the bridging motif.
The structural characteristics of the PhS–Agn, , complexes are given in Tab. 1. They include the lengths of the Ag–S and the S–C bonds, the angle C–S–Ag (for the bridging motif the calculated angle is between the S–C bond and a shortest line connecting the sulfur atom with the nearest Ag–Ag bond), and the distance between the carbon atom adjacent to the S–C bond and the closest silver atom. The latter parameter characterizes the shortest non-bonding distance between the benzene ring and the Agn cluster. The binding energies between benzenethiol and silver clusters were estimated as
| (1) |
neglecting the basis set superposition errors. note_err The variation of the Ag–S and C–S bond lengths for the complexes with the same type of binding is less than 4 %. The angle between the C–S and Ag–S bonds is consistent with the experimental data obtained for benzenethiol adsorbed on Au (111). Whelan There are no obvious correlations of the structure parameters with the size of the Agn clusters. The binding energies vary substantially for the complexes. PhS–Agn complexes with odd form closed-shell electronic configurations and have larger binding energies.
| Complex | Binding | Ag–S | C–S | C–S–Ag | C2–Ag | |
|---|---|---|---|---|---|---|
| PhS–Ag1 | on-top | 2.339 | 1.769 | 102.830 | 3.975 | 12.34 |
| PhS–Ag6 | on-top | 2.389 | 1.756 | 101.470 | 2.454 | 7.56 |
| PhS–Ag7 (I) | on-top | 2.421 | 1.757 | 96.606 | 2.669 | 17.71 |
| PhS–Ag7 (II) | bridge | 2.521/2.589 | 1.768 | 103.673 | 2.629 | 20.67 |
| PhS–Ag8 | bridge | 2.573/2.587 | 1.767 | 109.449 | 2.600 | 3.31 |
| PhS–Ag9 | bridge | 2.429/2.458 | 1.774 | 109.682 | 3.646 | 25.06 |
| PhS–Ag10 | bridge | 2.480/2.495 | 1.769 | 108.946 | 3.684 | 15.37 |
| PhS–Ag11 | bridge | 2.544/2.546 | 1.768 | 105.044 | 2.523 | 23.32 |
Two types of benzene ring orientation are distinguishable. In the complexes PhS–Agn, the benzene ring oriented towards the metal cluster, allowing several non-bonding C–Ag interactions. In the complexes PhS–Agn, the benzene ring is directed outward and the distance between the ring and the Agn cluster is about 40 % longer than in the previous type.
In the following sections, we provide a detailed analysis of the computed optical and Raman spectra of PhS–Agn complexes using representative examples of the aforementioned binding structures and molecule orientations. The spectra of the other complexes are provided in the Supplementary Information.
III.2 Electronic Excitation Spectra.
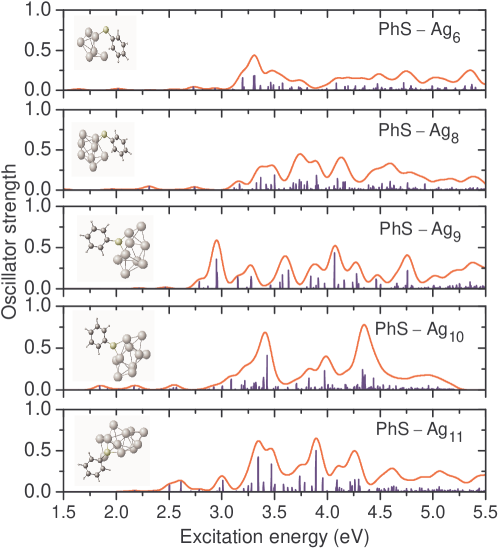
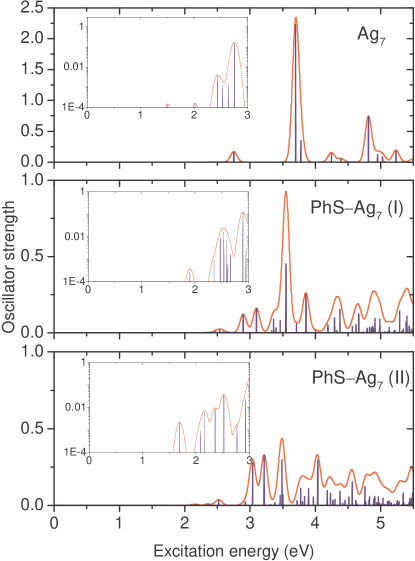
The electronic excitations of neat benzenethiol are in the ultraviolet spectral range. The computed energies of the two lowest transitions, 4.87 eV and 5.37 eV, are in good agreement with the measured values of 4.42 eV and 5.25 eV for benzenethiol in a solution, respectively. BTexp The simulated absorption spectra of bare silver clusters are consistent with the experimental data from Ref. Ag_abs . In the energy range of 3–5 eV, the clusters of higher symmetry, such as Ag7 () and Ag10 (), have few strong transitions with oscillator strengths higher than 1. The low-frequency parts of the absorption spectra overlap with the visible range and some extend down to 0.5 eV. They consist of weak transitions with oscillator strengths in the range . As an example, the electronic excitation spectra of the Ag7 cluster and two isomeric complexes PhS–Ag7 (I) and (II) are shown in Fig. 2. The spectra of the complexes differ substantially from the spectra of the corresponding silver clusters. In contrast to silver–pyridine complexes, Jensen07 the strong electronic transitions are quenched in most of the studied PhS–Agn structures. In the cases where these excitations are still identifiable, we observe a red-shift of the order of eV, see Fig. 2, except for the PhS–Ag10 complex where the transition is blue-shifted by about 0.1 eV.
III.3 Off-Resonance Raman Spectra
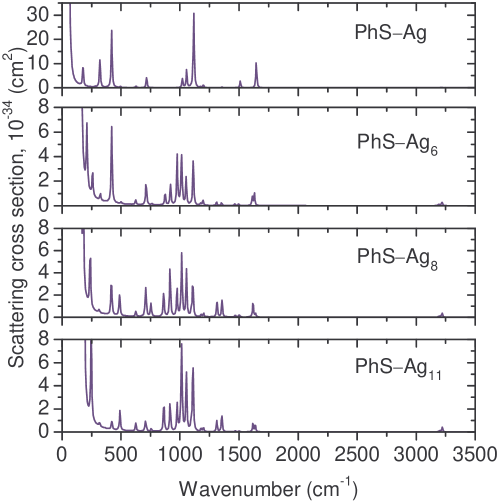
Off-resonance Raman spectra of benzenethiol and of PhS–Agn, , complexes were simulated using an excitation energy of 0.62 eV (2000 nm), which is below the lowest electronic transition in these systems. Three different quantities have been computed: Raman cross sections for characteristic molecular vibrational modes; the total scattering cross section of the complex, and the integrated cross section with a low-frequency cutoff at 200 cm-1. The latter quantity excludes almost all vibrational modes of the metal cluster. Most important for SERS applications are molecular vibrational modes about 1000 cm-1. Enhancement of the scattering cross sections of these modes is used to characterize the surface enhancement. However, the integrated cross sections are introduced to analyze the modulations of the Raman response rather than for estimation of the enhancement factor. The computed Raman spectra are given in Fig. 3.
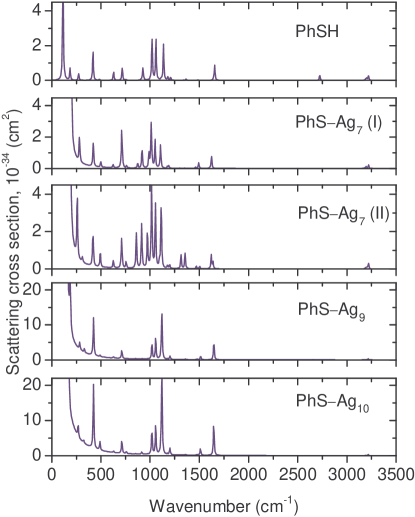
The computed Raman spectrum of isolated benzenethiol is in reasonable agreement with the experimental off-resonant spectrum of neat benzenethiol recorded for a 785 nm excitation. VanDuyne09 The dominant vibrational modes in the Raman spectrum of benzenethiol are totally symmetric and belong to the irreducible representation of the point group. The computed vibrational band at cm-1 is assigned to the ring breathing mode, and the band at cm-1 corresponds to a ring deformation mode. The C–S stretching mode is computed at cm-1 while the computed Raman band at cm-1 is associated with a totally symmetric ring stretching mode. Our results are consistent with previous assignments. PhSH-Green The computed vibrational frequencies of benzenethiol are blue-shifted by 10–50 cm-1 with respect to experimental data due to incomplete basis sets and neglect of anharmonicity. The totally symmetric modes assigned above correspond to the experimentally measured vibrational frequencies cm-1, cm-1, cm-1, and cm-1, respectively, for neat benzenethiol. VanDuyne09 Comparison of computed Raman intensities of isolated benzenethiol to experimental data is provided in the Supplementary Information.
| Complex | |||||
|---|---|---|---|---|---|
| PhSH | 85.8 | 5.96 | 1.39 | 3.34 | 64.0 |
| PhS–Ag1 | 130.7 | 3.35 | 16.50 | 1.53 | 10.2 |
| PhS–Ag6 | 351.7 | 1.53 | 1.63 | 2.16 | 2.8 |
| PhS–Ag7 (I) | 365.2 | 2.80 | 1.35 | 1.04 | 2.7 |
| PhS–Ag7 (II) | 374.9 | 2.54 | 0.64 | 1.23 | 4.8 |
| PhS–Ag8 | 425.6 | 1.34 | 0.48 | 1.67 | 4.3 |
| PhS–Ag9 | 478.2 | 2.09 | 7.98 | 1.35 | 0.6 |
| PhS–Ag10 | 529.3 | 1.22 | 14.43 | 2.28 | 0.6 |
| PhS–Ag11 | 568.8 | 1.95 | 1.00 | 1.81 | 4.0 |
Binding of benzenethiol to Agn clusters leads to an overall increase of off-resonant Raman scattering cross sections and to a significant redistribution of band intensities in the Raman spectrum. This effect is known as the static enhancement mechanism of SERS. Moskovits_Rev This effect has been attributed to the decrease of the energy gap between the highest occupied molecular orbital (HOMO) and the lowest unoccupied molecular orbital (LUMO) and the ensuing enhancement of the electronic polarizability and its derivatives. Jensen09 The Raman cross section of the molecular vibrational modes in the computed metal-molecular complexes can be up to 10 times larger than that in isolated benzenethiol. This value is comparable to the results of Ref. Schatz_JACS for pyridine. However, we observe a strong dependence of the enhancement factor on the geometry of a metal cluster and the orientation of the molecule. For example, the Raman signal from the modes in PhS–Ag7 (I and II) complexes is almost unenhanced compared to PhSH, see Fig. 3. Also, Raman signals from different molecular modes have different enhancement factors. To characterize the off-resonant enhancement of Raman scattering, the cross sections of the vibrational mode have been used. Tab. 2 shows the computed off-resonant electronic polarizabilities, HOMO–LUMO gaps, Raman cross sections corresponding to the vibrational mode, and integrated Raman scattering cross sections of benzenethiol and PhS–Agn complexes for the excitation energy of 0.62 eV (2000 nm). The integrated cross sections are computed by summation of Raman scattering cross sections over all vibrational modes of the complex, including the vibrations of the metal cluster. The electronic polarizabilities are to a good approximation additive and thus increase linearly with the number of Ag atoms. The integrated Raman scattering cross sections of PhS–Agn complexes are larger than that of benzenethiol by 2–3 orders of magnitude but do not increase monotonically with the cluster size . Molecular vibrational modes contribute only a small fraction (less than 5 % with the exception of PhS–Ag, see Tab. 2) to the integrated Raman scattering cross section while the largest part of the scattered radiation arises from vibrations within the metal cluster.
Orientation effect. We find a significant dependence on the orientation of the benzene ring: the largest integrated Raman scattering cross sections are computed for the complexes PhS–Agn, , in which the benzene ring points outward from the cluster surface, see Fig. 1. In contrast, in the PhS–Agn, complexes the aromatic ring is oriented towards the metal cluster and non-binding C–Ag interactions reduce the integrated Raman scattering cross sections by about one order of magnitude. This orientation effect appears to be the major influence in the off-resonance Raman spectra of PhS–Agn complexes, while the effect of increasing electronic polarizability and the characteristic alternation of HOMO–LUMO gaps in between even- and odd-numbered metal clusters Agn seem to be less important. The non-binding interactions of the benzene ring with the Agn cluster in the PhS–Agn, complexes result in an efficient quenching of Raman scattering from metal cluster modes, increasing the relative weight of molecular vibrations.
Symmetry effect. The relative intensities of vibrational modes in Raman spectra of PhS–Agn complexes might be explained based on their symmetry and proximity to the Agn cluster. Comparison of the Raman spectra of the isomers PhS–Ag7 (I) and PhS–Ag7 (II) exemplifies the effect of the local symmetry of the benzene ring on the off-resonant enhancement. The PhS–Ag7 (I) isomer is, similar to the isolated benzenethiol molecule, -symmetric while the local symmetry of the benzene ring in the PhS-Ag7 (II) isomer is perturbed by unsymmetric bonding to the cluster. The symmetry of the benzene ring affects the aromatic C–C stretching bands in the region of 1620–1660 cm-1. Only the totally symmetric aromatic C–C stretching vibration ( cm-1 in benzenethiol, denoted as in Wilson’s notation Benzene-Wilson ) is observed in the Raman spectra of PhSH and PhS–Ag7 (I) while the corresponding non-totally symmetric vibration at lower frequency (1641 cm-1 in benzenethiol, in Wilson’s notation) is at least one order of magnitude weaker and not observed in the experiment. The lower symmetry of the PhS–Ag7 (II) manifests itself in the redistribution of Raman scattering cross sections among the aromatic C–C stretching modes such that the lower-frequency mode gains intensity. As a consequence, a doublet of vibrational bands is formed in the aromatic C–C stretching region. In the PhS–Agn, , complexes, the interaction between the benzene ring and the Agn cluster is weak and local symmetry of the benzene ring is essentially unperturbed. This results in only one observable aromatic C–C stretching band in the Raman spectra of these complexes.
Proximity effect. The proximity effect on the Raman scattering cross section may be observed in the region between 1000–1150 cm-1, including ring deformation modes at cm-1 and cm-1 and the C–S stretching mode at cm-1 in benzenethiol, respectively. In both PhS–Ag7 (I) and PhS–Ag7 (II) clusters, the ring breathing mode at 1011–1015 cm-1 and the ring deformation mode at 1050–1055 cm-1 are strongly enhanced by the interaction with the Agn clusters. With benzene rings further away from the Agn clusters in PhS–Agn, , enhancement of ring deformation modes is diminished in these clusters, while the C–S stretching mode is more pronounced.
All three effects governing off-resonant surface enhancement of Raman response of PhS–Agn complexes, namely the relative orientation of the benzene ring with respect to the cluster, the local symmetry of the benzene ring, and the proximity of the particular vibrational mode to the binding site, are interrelated. Their modulation by thermal large-amplitude motion of the aromatic ring may serve as a simple and plausible explanation for the “blinking” events observed in SERS experiments on 4-aminobenzenethiol attached to Au bowtie nanoantennas Moerner or to molecular junctions. Natelson
III.4 Raman Excitation Profiles
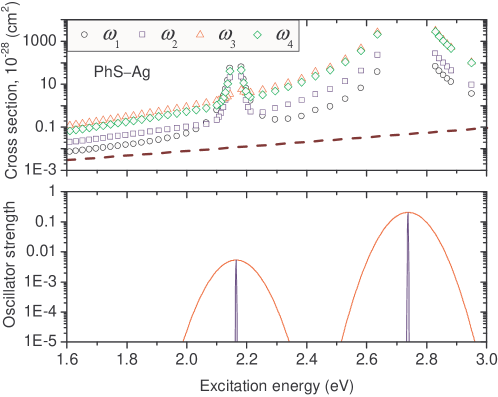
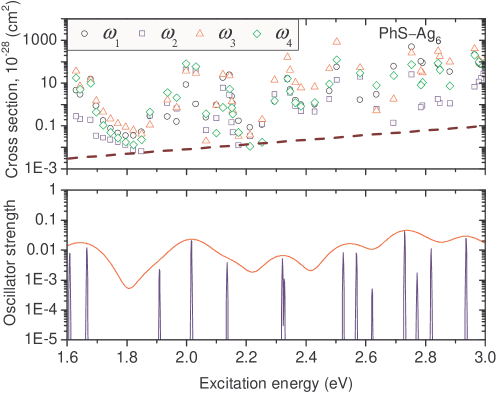
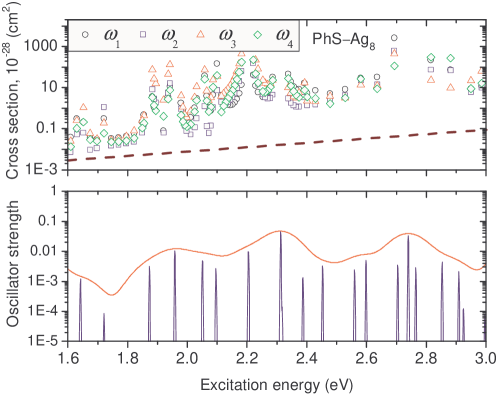
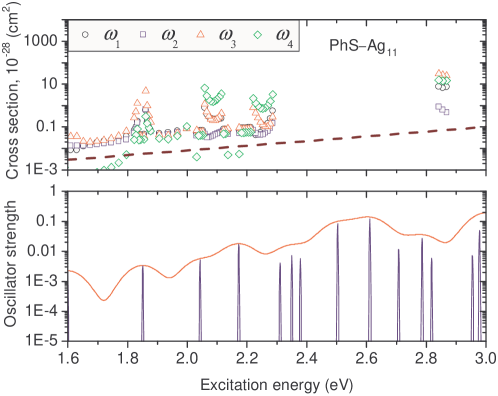
Raman excitation profiles of four strong totally symmetric benzenethiol vibrational modes, cm-1, cm-1, cm-1, and cm-1, were calculated for the excitation energy range eV ( nm). These modes are dominant in experimental SERS spectra of benzenethiol. VanDuyne09 ; Carron
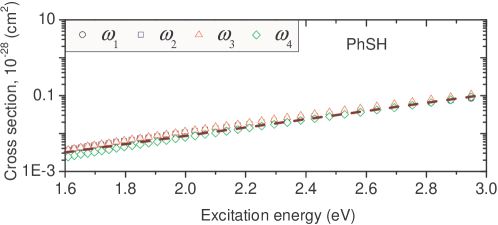
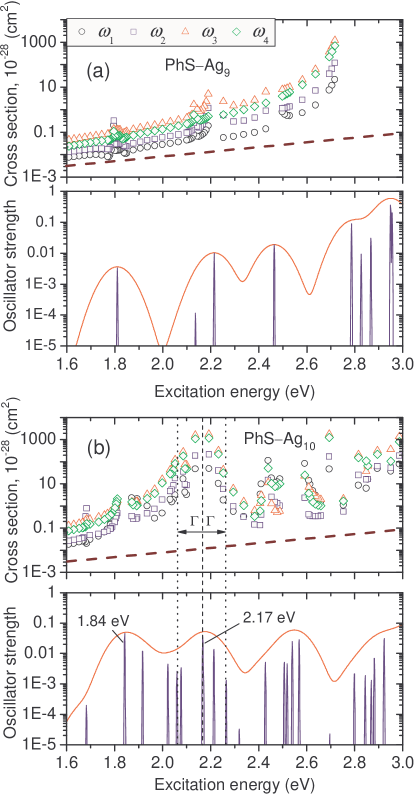
In Figs. 4 and 5 we provide REPs and electronic excitation spectra of four different complexes PhS–Ag7 (I), PhS–Ag7 (II), PhS–Ag9, and PhS–Ag10 in logarithmic scale. For comparison we also show REP of isolated benzenethiol averaged over all four modes. The simulated scattering cross sections for the vibrational modes in isolated benzenethiol differ by no more than a factor of two, therefore an averaged value of REP of benzenethiol (dashed line) is used to simplify the plots. The slope of the REP of benzenethiol is close to 4 and stems from the dependence of Raman scattering cross sections. Long The effect of intramolecular resonances is small in the studied range of excitation energies.
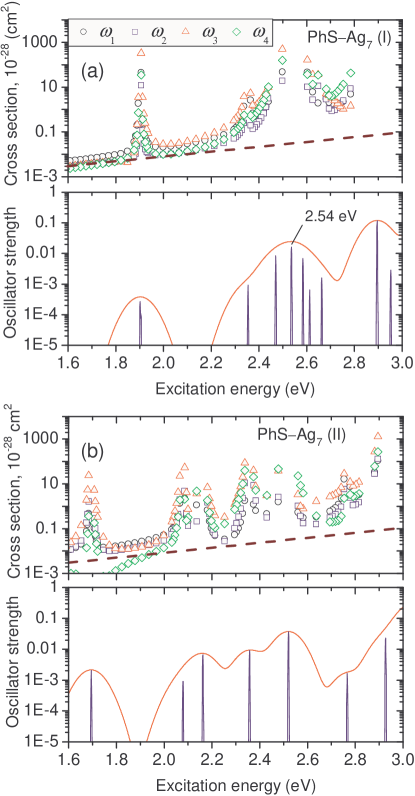
The isomers PhS–Ag7 (I) and (II) in Fig. 4 represent two distinct bonding patterns (on-top and bridge), whereas the structure of the silver cluster remains essentially the same. The electronic excitation spectra of the complexes are quite dissimilar, which reflects the sensitivity of the electronic states to the binding pattern. For example, the lowest electronic excitation of the PhS–Ag7 (II) complex is 0.2 eV lower in energy than that of the PhS–Ag7 (I) complex. All transitions within the excitation range eV are weak with oscillator strengths .
Cluster–molecule resonant effect. The REPs illustrate the frequency dependence of SERS and allow for identification of two different contributions to chemical Raman enhancement. These are the baseline shifts of the REPs of the complexes compared to that of isolated benzenethiol and the additional modulation by resonance-type features. The baseline shift is attributed to the off-resonant enhancement discussed in the previous section while the resonances arise from electronic transitions between metal–molecular states. This is consistent with the conventional picture of chemical enhancement. Schatz_Rev The off-resonant enhancement factor for both isomers of the PhS–Ag7 complex is of the order of 1 and can be explained by the orientational effect discussed in the previous section.
The relative enhancement for different modes depends on the excitation energy. For example, the vibrational mode has the largest enhancement for the PhS–Ag7 (I) complex in the energy range below the first electronic transition, whereas the becomes the strongest Raman mode above it. This observation is in accord with the empirical Tsuboi rule Tsuboi : the lowest electronic excitation in the complex PhS–Ag7 (I) involves the Ag–S bond and has a larger impact on the C–S stretching mode ().
The structures of the PhS–Ag9 and PhS–Ag10 complexes differ only by a single Ag atom, which is located approximately from the binding sites. The PhS–Ag9 complex has a closed-shell electronic structure and shows a smaller number of electronic transitions as compared to the PhS–Ag10. Both structures show 10–100 fold enhancements of Raman signals outside of resonant regions. Enhancement factors of different vibrational modes differ by about one order of magnitude. This can be seen by comparing the Raman cross sections of the complexes to that of isolated benzenethiol for the excitation energy 1.6 eV, Fig. 5.
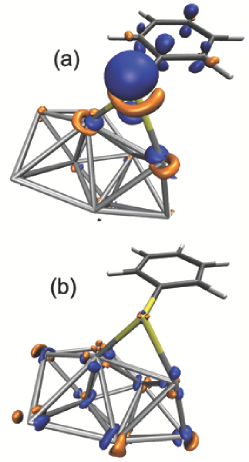
Most of electronic excitations shown in Figs. 4 and 5 result in resonance-type divergences of the REP. However, Raman enhancement in pre-resonant regions cannot be characterized by the oscillator strengths of the respective electronic transitions only. For instance, in the PhS–Ag10 complex the electronic transition at 2.17 eV has an oscillator strength 0.04, which is smaller than that of the 1.84 eV transition (oscillator strength 0.05). Nevertheless, the former excitation induces a large peak in the REP, see Fig. 5 (b), while the latter has a much smaller effect. These two excitations differ by the degree to which Ag–S bonds are affected by the electronic excitations, as can be seen in Fig. 6. The 2.17 eV electronic excitation is localized around the bonding sites and does not involve all atoms in the Agn cluster, whereas the 1.84 eV electronic excitation is delocalized. This observation lends support to the underlying assumption of this work that the effects of chemical bonding on surface enhancement can be modeled to a significant extent using finite-size metal clusters.
The occurrence of strong resonant Raman peaks is a common feature of all considered PhS–Agn complexes. The strong peak in the REP of the PhS–Ag7 (I) complex is centered around the 2.54 eV electronic excitation, and in the REP of PhS–Ag9 a similar feature can be associated with the region eV.
Our approach does not include finite-lifetime effects and is thus not applicable in a strictly resonant case. The enhancement of a Raman signal at resonances scales inversely proportional to the fourth power of the homogeneous linewidth of the involved electronic states. Birke Since enters as a phenomenological parameter, estimates of the corresponding enhancement factors are inherently imprecise. To obtain lower-bound estimates of resonant enhancement factors we consider the Raman scattering cross section at frequencies , where stand for electronic excitation frequencies. For we use a pragmatic value eV, which is consistent with Ref. Schatz_JACS . The estimated enhancement of Raman signal near the 2.17 eV electronic transition in the PhS–Ag10 complex is of the order of and varies about 10 times for different vibrational modes. Similar estimates are also obtained for other structures.
Usually, in SERS literature the enhancement below intramolecular excitations is associated with charge-transfer excitations that have very small oscillator strengths. For example, in Ref. Schatz_JACS electronic transitions at energies comparable to those considered here were found in a pyridine-Ag20 complex, with enhancements that were also about . The excitations were referred to as charge-transfer states. In our system, all electronic transitions in the excitation range eV have a mixed metal–molecular character and can be associated with a partial charge transfer between the cluster and the molecule. However, most of them have only a small contribution to the resonance Raman enhancement. Thus, besides narrow singularities, the computed cross sections are relatively smooth functions of the excitation energy. For example, the 1.9 eV excitation in PhS–Ag7 (I) complex, see Fig. 4, gives almost no enhancement of the Raman signal if we take into account the finite linewidth of the transition. The important excitations, such as the excitation shown in Fig. 6 (a)., are local to the binding site and are characterized by the change of the electron density around the binding sites only. It is important to notice that the difference in the static dipole between a ground and an excited state of the complexes for such transitions is rather small. For example, the change in the static dipole moment for the excitation of the PhS–Ag10 complex depicted in Fig. 6 (a) is 3.7 Debye.
III.5 Discussion
Many important features of experimental SERS results for benzenethiol VanDuyne09 ; Carron ; SERS-Roshi ; VanDuyne05 are reflected in the computed Raman spectra of the PhS–Agn complexes. The molecular vibrational frequencies of the complexes are shifted compared to that of isolated benzenethiol. The frequency shifts of intense modes of the complexes PhS–Ag7 (I) and (II), PhS–Ag9, and PhS–Ag10 are compared to experimental SERS data in Tab. 3. The values and the signs of the computed shifts are in good agreement with the results of measurements. The magnitudes of the frequency shifts depend on the degree to which the C–S bond is involved in the given vibration. For instance, the C–S stretching mode cm-1 shows the largest shift on average, which is an additional manifestation of the proximity effect discussed in Sec. III.3.
| Mode | |||||||
| Freq. PhSH | 1004 | 1027 | 1094 | 1583 | 414 | 701 | 918 |
| PhS–Ag7 (I) | -7 | -9 | -31 | -33 | 1 | 4 | -8 |
| PhS–Ag7 (II) | -4 | -5 | -24 | -17 | 3 | 6 | -12 |
| PhS–Ag9 | -1 | -2 | -18 | -8 | 6 | -4 | -5 |
| PhS–Ag10 | -1 | -3 | -18 | -9 | 5 | -4 | -11 |
| Ref. VanDuyne09 | -1 | 0 | -18 | -7 | 8 | -6 | - |
| Ref. Carron | 0 | 1 | -17 | -9 | 6 | -3 | - |
| Ref. SERS-Roshi | -1 | -2 | -21 | -11 | 5 | -8 | - |
Comparisons of the computed Raman cross sections of the PhS–Agn complexes to experimental SERS data should take into account that the chemisorbed molecules are no longer freely rotating. This has the effect that the orientational averaging of the Raman tensor depends on the shape of the metal substrate and the relative orientation of the adsorbed molecules. As a model, we consider benzenethiol molecules adsorbed on a spherical nanoparticle. The computed PhS–Agn structures are oriented such that in the complexes with on-top binding, (I), the Ag–S bond is orthogonal to the particle surface, and in the complexes with the bridge binding motif, (II), the plane formed by the two Ag–S bonds is orthogonal to the particle surface. The Raman intensity of a vibrational mode with frequency is Creighton
| (2) |
where is the excitation frequency, and the electromagnetic enhancement factor is
| (3) |
stands here for the dielectric constant of the metal particle and includes the plasmon resonance, and is the dielectric constant of the environment, which is considered as not strongly frequency-dependent. denotes the Raman tensor of the mode , and the orientational averaging function is given by
| (4) |
The orientational averaging used here Creighton is different from the isotropic averaging that has been utilized in the previous sections. Particularly convenient for comparison with experiment are relative Raman scattering cross sections which are defined as
| (5) |
where is a frequency of the reference vibrational mode. The first multiplier on the right-hand side of Eq. 5 represents the relative electromagnetic enhancement of the Raman scattering due to plasmon excitations in the metal particle. The chemical bonding of a molecule to a surface modifies the Raman tensor and contributes to the second multiplier of Eq. 5.
| Mode | ||||||
|---|---|---|---|---|---|---|
| Freq. PhSH | 1004 | 1094 | 1583 | 414 | 701 | 918 |
| PhS–Ag7 (I) | 1.2 | 1.4 | 2.7 | 0.4 | 0.5 | 1.0 |
| PhS–Ag7 (II) | 1.2 | 1.4 | 0.5 | 0.1 | 0.2 | 1.6 |
| PhS–Ag9 | 0.6 | 3.4 | 2.8 | 0.7 | 0.2 | 0.0 |
| PhS–Ag10 | 0.6 | 5.1 | 4.5 | 1.1 | 0.3 | 0.0 |
| Ref. VanDuyne09 | 1.3 | 1.4 | 0.6 | 0.6 | 0.3 | - |
| Ref. Carron | 1.4 | 1.3 | 1.3 | 1.0 | 0.4 | - |
| Ref. SERS-Roshi | 1.1 | 1.0 | 3.5 | 2.7 | 0.4 | - |
The computed relative intensities of several Raman lines for the complexes PhS–Ag7 (I) and (II), PhS–Ag9, and PhS–Ag10 are compared to the experimental data in Tab. 4. Experimental SERS cross sections depend sensitively on the structure of the surface and the roughness features of the SERS substrate and are thus strongly influenced by the preparation technique, as illustrated by the differences between the experimental data in Tab. 4. Surface enhanced Raman spectra result from the appropriate averaging over the multitude of possible local bonding configurations. An additional important effect is due to differences in plasmonic resonance structures. Comparison of the experimental data with finite-size cluster models PhS–Agn shows that indeed many experimental SERS features may be correlated with the models considered here. For example, all strong Raman lines observed in Ref. VanDuyne09 belong to the representation, similar to the spectra of the PhS–Ag9 and PhS–Ag10 complexes. However, the relative intensities of the cm-1 and cm-1 modes are too high as compared to the experimental data. The discrepancy stems from overestimation of the computed Raman intensities for isolated benzenethiol and also from a frequency dependence of electromagnetic enhancement, which is not accounted for in the model. For instance, in Ref. VanDuyne09 the excitation frequency is optimized to enhance modes about 1000 cm-1. note1 Thus, the electromagnetic enhancement of the and modes is weaker as compared to the 1004 cm-1 mode. This trend should reduce the discrepancy between the experimental data of Ref. VanDuyne09 and the computed spectra of the PhS–Ag9 and PhS–Ag10 complexes. On the other hand, Refs. Carron and SERS-Roshi show some enhancement of the vibrational modes at 470 cm-1 and 960 cm-1, respectively, which belong to the representation. A possible explanation is that molecular orientations on the metal surface have irregularities and also contain binding situations similar to PhS–Ag7 (I) and (II), which show considerable enhancement for modes. For instance, the relative intensity of the 960 cm-1 mode in PhS–Ag7 (II) complex is 0.8.
To get an additional verification of our model, relative enhancement factors for the 1094 cm-1 and 1583 cm-1 vibrational modes of the PhS–Ag7 (I) and (II), PhS–Ag9, and PhS–Ag10 complexes have been compared to the enhancement factors measured in Ref. VanDuyne05 . A relative enhancement factor is defined for two vibrational modes and with corresponding excitation frequencies and as
| (6) |
where is calculated using Eq. 4, is a similar expression for an isotropic case Long , and the excitation frequencies have been chosen to get a maximal enhancement of corresponding vibrational modes. note1 Near a plasmonic resonance the first multiplier on the right hand side of Eq. 6 can be approximated by the ratio of the extinction coefficients of the plasmonic structure. The computed relative enhancement factors for the and modes of PhS–Agn, , complex given in Tab. 5 agree well with the experimental data from Ref. VanDuyne05 .
| Mode | ||||
|---|---|---|---|---|
| Freq. SERS | 1009 | 1027 | 1081 | 1575 |
| 705 | 703 | 700 | 692 | |
| 1.0 | 1.0 | 0.9 | 0.6 | |
| PhS–Ag7 (I) | 1.0 | 0.8 | 1.0 | 1.4 |
| PhS–Ag7 (II) | 1.0 | 0.6 | 1.0 | 0.1 |
| PhS–Ag9 | 1.0 | 1.7 | 5.3 | 2.9 |
| PhS–Ag10 | 1.0 | 1.7 | 7.8 | 4.6 |
| Ref. VanDuyne05 | 1 | - | 10 | 7 |
Resonant structure of Raman cross sections discussed in Sec. III.4 is hardly observable in experiments of Refs. VanDuyne09 ; Carron ; SERS-Roshi ; VanDuyne05 , where Raman scattering is measured for an inhomogeneous ensemble of molecules with their local environment. However, it can be observed in single molecule experiments. For example, the fine structure of single-molecule REPs measured in Ref. VD_sm may be interpreted as a result of resonances with mixed metal–molecular states.
IV Conclusions
We have analyzed the Raman response of benzenethiol chemisorbed on small silver clusters and find overall enhancement of the response of the order of as compared to isolated benznethiol. Mixed metal–molecular electronic states are formed due to chemical bonding. Raman response from the metal–molecular complexes exhibits resonance-type features even in the range far below the onset of molecular electronic excitations. We identify several mechanisms contributing to enhancement of Raman scattering in both off-resonant and resonant regimes. These include the relative orientation of the benzene ring with respect to the cluster, the local symmetry of the benzene ring, and the proximity of the particular vibrational mode to the binding site. Additional enhancement of Raman response by several orders of magnitude arises from resonant excitations localized around the binding sites, whereas response from other excitations in this range is significantly weaker. Specific properties of Raman response are strongly dependent on the local atomic environment of adsorbate. However, important features in SERS of benzenethiol on silver surfaces such as vibrational frequency shifts and relative enhancement factors may be explained using finite-size cluster models. Since the atomic structure of SERS substrates cannot currently be controlled in experiments the described effects should be averaged over a set of possible binding patterns. Nevertheless, our results might provide a guidance for optimization of SERS-active structures and are useful for interpretation of single molecule SERS measurements.
V Acknowledgments
We thank Roshan Aggarwal for providing the experimental data and the text of the manuscript before its publication. We also much appreciate Eric Diebold and Mohamad Banaee for useful discussions. This work was supported by the Defense Advanced Research Project Agency under Contract No FA9550-08-1-0285. R. O.-A. was supported by CONACyT and Fundación México en Harvard A.C. We thank the High Performance Technical Computing Center at the Faculty of Arts and Sciences of Harvard University and the National Nanotechnology Infrastructure Network Computation project for invaluable support.
References
- (1) M. Moskovits, Rev. Mod. Phys., 1985, 57, 783.
- (2) A. Otto, I. Mrozek, H. Grabhorn and W. Akemann, J. Phys.: Condens. Matter, 1992, 4, 1143.
- (3) T. Vosgröne and A. J. Meixner, ChemPhysChem, 2005, 6, 154.
- (4) S. Nie and S. R. Emory, Science, 1997, 275, 1102.
- (5) K. Kneipp, Y. Wang, H. Kneipp, L. T. Perelman, I. Itzkan, R. R. Dasari and M. S. Feld, Phys. Rev. Lett., 1997, 78, 1667.
- (6) V. M. Zamarion, R. A. Timm, K. Araki and H. E. Toma, Inorg. Chem., 2008, 47, 2934.
- (7) X. Zhang, N. C. Shah and R. P. Van Duyne, Vib. Spectrosc., 2006, 42, 2.
- (8) J. N. Anker, W. P. Hall, O. Lyandres, N. C. Shah, J. Zhao and R. P. Van Duyne, Nat. Mater., 2008, 7, 442.
- (9) Y. Chu, E. Schonbrun, T. Yang and K. B. Crozier, Appl. Phys. Lett., 2008, 93, 181108.
- (10) M. D. Austin, H. Ge, W. Wu, M. Li, Z. Yu, D. Wasserman, S. A. Lyon and S. Y. Chou, Appl. Phys. Lett., 2004, 84, 5299.
- (11) J. P. Camden, J. Dieringer, J. Zhao and R. P. Van Duyne, Acc. Chem. Res., 2008, 41, 1653.
- (12) A. Gopinath, S. V. Boriskina, B. M. Reinhard, L. Dal Negro, Optics Express, 2009, 17, 3741.
- (13) E. D. Diebold, N. H. Mack, S. K. Doorn and E. Mazur, Langmuir, 2009, 25, 1790.
- (14) There is a controversy in the definition of the enhancement factor discussed recently in E. C. Le Ru, E. Blackie, M. Meyer and P. G. Etchegoin, J. Phys. Chem. C, 2007, 111, 13794.
- (15) J. A. Dieringer, K. L. Wustholz, D. J. Masiello, J. P. Camden, S. L. Kleinman, G. C. Schatz and R. P Van Duyne, J. Am. Chem. Soc., 2009, 131, 849.
- (16) A. Otto, J. Raman Spectrosc., 2005, 36, 497.
- (17) R. M. Lazorenko-Manevich, Russ. J. Electrochem., 2005, 41, 799.
- (18) B. N. J. Persson, Chem. Phys. Lett., 1981, 82, 561.
- (19) F. J. Adrian, J. Chem. Phys., 1982, 77, 5302.
- (20) J. R. Lombardi, R. L. Birke, T. Lu and J. Xu, J. Chem. Phys., 1986, 84, 4174.
- (21) L. Jensen, C. M. Aikens and G. C. Schatz, Chem. Soc. Rev., 2008, 37, 1061.
- (22) R. F. Aroca, R. E. Clavijo, M. D. Halls and H. B. Schlegel, J. Phys. Chem. A, 2000, 104, 9500.
- (23) L. Jensen, L. L. Zhao, J. Autschbach and G. C. Schatz, J. Chem. Phys., 2005, 123, 174110.
- (24) L. Zhao, L. Jensen and G. C. Schatz, J. Am. Chem. Soc., 2006, 128, 2911.
- (25) L. Jensen, L. L. Zhao and G. C. Schatz, J. Phys. Chem. C, 2007, 111, 4756.
- (26) S. M. Morton and L. Jensen, J. Am. Chem. Soc., 2009, 131, 4090.
- (27) D. P. Fromm, A. Sundaramurthy, A. Kinkhabwala, P. J. Schuck, G. S. Kino and W. E. Moerner, J. Chem. Phys., 2006 124, 061101.
- (28) D. R. Ward, N. J. Halas, J. W. Ciszek, J. M. Tour, Y. Wu, P. Nordlander and D. Natelson, Nano Lett., 2008, 8, 919.
- (29) K. B. Biggs, J. P. Camden, J. N. Anker, and R. P. Van Duyne, J. Phys. Chem. A, 2009, 113, 4581.
- (30) K. T. Carron and L. G. Hurley, J. Phys. Chem., 1991, 95, 9979. It should be noticed that the vibrational modes of neat benzenethiol are assigned incorrectly in Table I of the reference. For the correct assignement see Ref. PhSH-Green .
- (31) R. L. Aggarwal, L. W. Farrar, E. D. Diebold and D. L. Polla, J. Raman Spectrosc., 2009, DOI:10.1002/jrs.2396.
- (32) A. D. McFarland, M. A. Young, J. A. Dieringer and R. P. Van Duyne, J. Phys. Chem. B, 2005, 109, 11279.
- (33) D. Rappoport and F. Furche, J. Chem. Phys, 2007, 126, 201104.
- (34) R. Ahlrichs, M. Bär, M. Häser, H. Horn and C. Kölmel, Chem. Phys. Lett., 1989, 162, 165. For current version see http://www.turbomole.com.
- (35) F. Weigend and R. Ahlrichs, Phys. Chem. Chem. Phys, 2005, 7, 3297.
- (36) A. Schäfer, H. Horn and R. Ahlrichs, J. Chem. Phys., 1992, 97, 2571.
- (37) D. Andrae, U. Häußermann, M. Dolg, H. Stoll and H. Preuß, Theor. Chim. Acta, 1990, 77, 123.
- (38) J. P. Perdew, M. Ernzerhof and K. Burke, J. Chem. Phys., 1996, 105, 9982.
- (39) C. Van Caillie and R. D. Amos, Chem. Phys. Lett., 2000, 328, 446.
- (40) C. Van Caillie and R. D. Amos, Phys. Chem. Chem. Phys., 2000, 2, 2123.
- (41) M. Harb, F. Rabilloud, D. Simon, A. Rydlo, S. Lecoultre, F. Conus, V. Rodrigues and C. Félix, J. Chem. Phys., 2008, 129, 194108.
- (42) K. Baishya, J. C. Idrobo, S. Öğüt, M. Yang, K. Jackson and J. Jellinek, Phys. Rev. B, 2008, 78, 075439.
- (43) M. Marsman, J. Paier, A. Stroppa and G. Kresse, J. Phys.: Condens. Matter, 2008, 20, 064201.
- (44) N. T. Maitra, J. Chem. Phys., 2005, 122, 234104.
- (45) M. J. G. Peach, T. Helgaker, P. Sałek, T. W. Keal, O. B. Lutnæs, D. J. Tozer and N. C. Handy, Phys. Chem. Chem. Phys., 2006, 8, 558.
- (46) Q. Wu and T. Van Voorhis, J. Chem. Theory Comput., 2006, 2, 765.
- (47) J. P. Perdew, V. N. Staroverov, J. Tao and G. E. Scuseria, Phys. Rev. A, 2008, 78, 052513.
- (48) P. Deglmann, F. Furche and R. Ahlrichs, Chem. Phys. Lett., 2002, 362, 511.
- (49) J. C. Idrobo, S. Öğüt and J. Jellinek, Phys. Rev. B, 2005, 72, 085445.
- (50) J. C. Idrobo, S. Öğüt, J. Jellinek and R. Ferrando, Phys. Rev. B, 2007, 75, 233411.
- (51) M. E. Casida, in Recent Advances in Density Functional Methods, Part I, edited by D. P. Chong, World Scientific, Singapore, 1995, p. 155–192.
- (52) R. Bauernschmitt and R. Ahlrichs, Chem. Phys. Lett., 1996, 256, 454.
- (53) F. Furche and D. Rappoport, in Computational Photochemistry, edited by M. Olivucci, Elsevier, Amsterdam, 2005, pp. 93–128.
- (54) C. D. Bain, E. B. Troughton, Y. T. Tao, J. Evall and G. M. Whitesides, R. G. Nuzzo, J. Am. Chem. Soc., 1989, 111, 321.
- (55) D. M. Jaffey and R. J. Madix, J. Am. Chem. Soc., 1994, 116, 3020.
- (56) J. Nara, S. Higai, Y. Morikawa, T. Ohno, J. Chem. Phys., 2004, 120, 6705.
- (57) The basis set superposition error of a pyridine molecule attached to an Ag20 to be ca. 0.7 kcal/mol Schatz_JACS .
- (58) C. M. Whelan, C. J. Barnes, C. G. H. Walker, N. M. D. Brown, Surf. Sci., 1999, 425, 195.
- (59) A. Schweig, F. Diehl, K. Kesper and H. Meyer, J. Molec. Struct., 1989, 198, 307.
- (60) J. H. S. Green, Spectrochim. Acta, 1962, 18, 39.
- (61) E. B. Wilson, Jr., Phys. Rev., 1934, 45, 706
- (62) D. A. Long, The Raman Effect, Wiley, Chichester, 2002.
- (63) A. Y. Hirakawa and M. Tsuboi, Science, 1975, 188, 359.
- (64) J. A. Creighton Surf. Sci., 1983, 124, 209.
- (65) The enhancement factor for a given mode is maximal if , where is the frequency of a plasmonic resonance. VanDuyne05 At this condition .
VI SUPPLEMENTARY INFORMATION
VI.1 Electronic Excitation Spectra
The absorption spectra of the simulated Agn clusters and PhS–Agn complexes, are shown in Figs. 7 and 8. For , the structure of the silver cluster in the PhS–Agn complex differs from the one of the bare silver cluster because of the cluster reconstruction. This is discussed in Sec. 3.1 of the manuscript in more details.
VI.2 Off-resonance Raman Spectra
The relative intensities of the computed Raman lines of isolated benzenethiol as compared to the relative Raman intensities measured for neat benzenethiol VanDuyne09 ; Carron ; SERS-Roshi are given in Tab. 6. The intensities are in good agreement except of the cm-1 vibrational mode. Changing the exchange functional in DFT simulations results in minor improvements only.
The Raman spectra of PhS–Agn complexes, computed at the excitation energy eV (2000 nm excitation wavelength) are shown in Fig. 9. The excitation energy used is below the lowest electronic transition in the structures. The complex PhS–Ag shows a strong enhancement of totally symmetric vibrational modes, while in the other complexes, the non-bonding interaction between the aromatic ring and the cluster results in a suppression of the integrated Raman scattering cross section and a redistribution of intensities between the totally symmetric and non-totally symmetric modes. See Sec. 3.2 of the manuscript.
VI.3 Raman Excitation Profiles
The Raman excitation profiles (REPs) and low-frequency electron excitation spectra for PhSH and PhS–Agn complexes, for the computed vibrational modes, cm-1, cm-1, cm-1, and cm-1, are shown in Figs. 10-14. The range of excitation energies is eV. In logarithmic scale the REPs for isolated PhSH, Fig. 10, are almost linear in the excitation energy, which is consistent with the semiclassical theory of Raman scattering.Long For the complexes PhS–Agn, , Figs. 11-14, a resonance-type structure of REPs originates in the electronic excitations to mixed metal-molecular states.
VI.4 Discussions
The frequency shifts of four totally symmetric vibrational modes cm-1, cm-1, cm-1, and cm-1 in PhS–Agn, complexes are collected in Tab. 7. On average, the values of the shifts are larger for the complexes where total Raman scattering is quenched, PhS–Agn, .
References
- (1) K. B. Biggs, J. P. Camden, J. N. Anker, and R. P. Van Duyne, J. Phys. Chem. A, 2009, 113, 4581.
- (2) K. T. Carron and L. G. Hurley, J. Phys. Chem., 1991, 95, 9979.
- (3) R. L. Aggarwal, L. W. Farrar, E. D. Diebold and D. L. Polla, J. Raman Spectrosc., 2009, DOI:10.1002/jrs.2396.
- (4) D. A. Long, The Raman Effect, Wiley, Chichester, 2002.
| Mode | ||||||
|---|---|---|---|---|---|---|
| Freq. PhSH | 1004 | 1094 | 1583 | 414 | 701 | 918 |
| PhSHcomp | 1.0 | 1.0 | 0.9 | 0.5 | 0.3 | 0.4 |
| PhSHexp Ref. VanDuyne09, | 3.0 | 0.5 | 0.3 | 0.7 | 0.7 | 0.3 |
| PhSHexp Ref. Carron, | 4.5 | 0.4 | 0.4 | 0.6 | 0.7 | 0.2 |
| PhSHexp Ref. SERS-Roshi, | 2.9 | 0.6 | 1.0 | 1.0 | 0.5 | 0.4 |
| Complex | ||||
|---|---|---|---|---|
| PhS–Ag1 | -0 | -4 | -21 | -10 |
| PhS–Ag6 | -7 | -8 | -26 | -28 |
| PhS–Ag7(I) | -7 | -9 | -31 | -33 |
| PhS–Ag7(II) | -4 | -5 | -24 | -17 |
| PhS–Ag8 | -5 | -5 | -29 | -16 |
| PhS–Ag9 | -1 | -2 | -18 | -8 |
| PhS–Ag10 | -1 | -3 | -18 | -9 |
| PhS–Ag11 | -6 | -6 | -28 | -19 |