Cosmological Simulations of Massive Compact High-z Galaxies
Abstract
In order to investigate the structure and dynamics of the recently discovered massive () compact galaxies, cosmological hydrodynamical/N-body simulations of a Mpc3 co-moving (lagrangian), proto-cluster region have been undertaken. At , the highest resolution simulation contains resolved galaxies, of which 509, 27 and 5 have , and , respectively. Total stellar masses, effective radii and characteristic stellar densities have been determined for all galaxies. At , for the definitely well resolved mass range of , we fit the relation to the data, where is the total stellar mass in units of . This yields kpc, in line with observational findings for compact galaxies, though somewhat more compact than the observed average. The only line-of-sight velocity dispersion measured for a compact galaxy is very large, km/s (van Dokkum et al., 2009). This value can be matched at about the 1- level, although a somewhat larger mass than the estimated is indicated. For the above mass range, the galaxies have an average axial ratio with a dispersion of 0.1, and an average rotation to 1D velocity dispersion ratio with a dispersion of 0.3, and a maximum value of . Rotation and velocity anisotropy both contribute significantly in flattening the compact galaxies. Some of the observed compact galaxies appear flatter than any of the simulated galaxies. Finally, it is found that the massive compact galaxies are strongly baryon dominated in their inner parts, with typical dark matter mass fractions of order only 20% inside of .
Subject headings:
cosmology: theory — cosmology: numerical simulations — galaxies: clusters — galaxies: formation — galaxies: evolution1. Introduction
Observations indicate that a considerable part of the massive spheroidal stellar systems observed locally are already present at redshift , but that only a small fraction of these galaxies are fully assembled (van Dokkum et al., 2008). Typically, the proto-spheroidals are smaller by a factor of 3-6 compared to present-day ellipticals at similar masses (Daddi et al., 2005; Longhetti et al., 2007; Zirm et al., 2007; Toft et al., 2007; Trujillo et al., 2007; van Dokkum et al., 2008; Franx et al., 2008; Buitrago et al., 2008; Cimatti et al., 2008; Saracco et al., 2008; Williams et al., 2009; Toft et al., 2009). The stellar mass densities of the galaxies (inside of the effective radius) are at least one order of magnitude higher (van Dokkum et al., 2008; Damjanov et al., 2009), and their surface brightness is correspondingly significantly higher relative to low redshift galaxies of similar mass (Cimatti et al., 2008; Damjanov et al., 2009; Toft et al., 2009).
The observed properties of proto-elliptical galaxies are hard to reconcile with some currently proposed (idealized) schemes for the formation of elliptical galaxies: the observations indicate that most early-type galaxies did not form in a simple monolithic collapse or a binary merger of gas-rich disks at high redshift, unless their increase in size is due to subsequent considerable (and unlikely) amounts of mass loss (Damjanov et al., 2009; Fan et al., 2008). Moreover, simple passive evolution of the stellar populations is in contradiction with observations of local ellipticals (van Dokkum et al., 2008).
Dry (i.e. gas-poor, collisionless) minor mergers and stellar accretion events
are the prime candidates for the strong size evolution of massive stellar
spheroids at (Naab et al., 2006; Khochfar & Silk, 2006; Bell et al., 2006a, b; Genel et al., 2008; Khochfar & Silk, 2009; Ruszkowski & Springel, 2009; Hopkins et al., 2009a; van der Wel et al., 2009; Bundy et al., 2009; Naab et al., 2009; Bezanson et al., 2009)
as the additional presence of a dissipative component in a major merger event
would limit the size increase (see e.g. Ciotti et al., 2007). The observed ellipticals are already very massive
at high redshift, thus we expect, e.g,. from the shape of the mass function,
that minor mergers should be much more common than major mergers until
(Bell et al., 2006a; McIntosh et al., 2008; Genel et al., 2008; Khochfar & Silk, 2009; Bundy et al., 2009)
The compact galaxies observed by, e.g., van Dokkum et al. (2008) are very
massive, with stellar masses of up to . Moreover,
in the one case where the stellar line-of-sight velocity dispersion has
been measured, this is also very large, km/s
(galaxy 1255-0; van Dokkum et al., 2009). From a theoretical/numerical point of
view, an obvious question is whether
galaxies of such extreme characteristics can be reproduced by
current cosmological state-of-the-art galaxy formation simulations.
In a recent work, Naab et al. (2009) used a very high resolution simulation
of the formation of an individual galaxy to show that a galaxy with
characteristics similar to the observed compact galaxies can be
formed in conventional CDM hydrodynamical/gravitational
simulations. The galaxy has, at , an effective radius of
kpc, and a stellar mass of
, at the lower end of the observed
mass range — note, that the fact that less massive compact
galaxies have not been spectroscopically confirmed so far,
most likely is simply an observational limitation.
In order to build up a statistical sample of , potentially compact galaxies, and to span the entire observed mass range, we study in this paper the formation of galaxies in a Mpc3 co-moving (lagrangian), proto-cluster region. Such regions are some of the first regions in which the growth of small density fluctuations goes non-linear, later causing re-collapse and galaxy formation. They will hence potentially host some of the most massive galaxies in the Universe.
| run | ||||||||
|---|---|---|---|---|---|---|---|---|
| [] | [kpc/] | |||||||
| Coma1 | 3.9 | 3.9 | 22 | 0.70 | 0.70 | 1.24 | 7100000 | 39 |
| Coma2 | 3.9 | 3.9 | 22 | 0.35 | 0.35 | 0.62 | 7100000 | 39 |
| Coma3 | 3.9 | 3.9 | 22 | 0.17 | 0.17 | 0.31 | 7100000 | 39 |
| Coma3noSF | 3.9 | 3.9 | 22 | 0.17 | 0.17 | 0.31 | 7100000 | 3 |
| E4 | 0.073 | 0.073 | 0.42 | 0.20 | 0.20 | 0.36 | 1300000 | 39 |
| E4SS | 0.073 | 0.073 | 0.42 | 0.10 | 0.10 | 0.18 | 1300000 | 39 |
| E4SSnosf | 0.073 | 0.073 | 0.42 | 0.10 | 0.10 | 0.18 | 1300000 | 3 |
| E4HR | 0.0091 | 0.0091 | 0.052 | 0.10 | 0.10 | 0.18 | 9800000 | 59 |
| E4HRnoSF | 0.0091 | 0.0091 | 0.052 | 0.10 | 0.10 | 0.18 | 9800000 | 3 |
Note. — Numerical characteristics of the simulations: mass of gas/star/DM particles and the respective gravitational softening lenghts; total number of particles and initial redshift of run.
Romeo et al. (2005, 2006), D’Onghia et al. (2005) and Sommer-Larsen et al. (2005) presented fully cosmological simulations of galaxy groups and clusters. The TreeSPH code used was building on the code used for simulating galaxy formation (e.g., Sommer-Larsen, Götz & Portinari, 2003), improved to include modeling of non-instantaneous chemical evolution (Lia, Portinari & Carraro, 2002a), metallicity-dependent, atomic radiative cooling, strong supernova, and (optionally) AGN, driven galactic winds and thermal conduction. The two clusters simulated have =0 virial masses and , one approximately the size of the Virgo cluster and the other of the Coma cluster. They were both selected to be fairly relaxed, and both display central prominent cD galaxies at =0.
In this paper we re-simulate the “Coma” proto-cluster region at higher mass resolution and vastly higher force resolution than used in the above works. To this end, we use a conventional version of the hydro/gravity TreeSPH code GADGET-2 (Springel, 2005). The version used does not include chemical evolution and metallicity dependent radiative cooling, and also not radiative transfer of the meta-galactic UV field. Nevertheless, it is sufficient for the purposes of this paper, which is to study the basic structural and dynamical characteristics of very massive, galaxies. A more sophisticated modeling, based on the code described in Romeo et al. (2005) etc., will be presented in forthcoming papers.
In order to address issues pertaining to the mass resolution of the
proto-cluster simulation, we supplement the simulations with
high and ultra-high resolution simulations of a proto-elliptical galaxy
region. The largest galaxy forming in this region is, at , an
elliptical galaxy of stellar mass ,
a bit less than that of the galaxy studied by Naab et al. (2009) at similar
mass and force resolution.
This paper is organized as follows: the code and the simulations are described in section 2, the results obtained are presented in section 3 and discussed in section 4, and, finally, section 5 constitutes the conclusion.
Throughout the paper a CDM cosmology with and a Hubble constant H km s-1 Mpc-1 is assumed.
2. The code and simulations
The simulations were undertaken with the hydro/gravity TreeSPH code GADGET-2 (Springel, 2005).
Star formation and feedback from supernovae was included using the sub-grid multiphase model of Springel & Hernquist (2003). An over-density contrast of is required for the onset of star formation to avoid spurious star formation at high redshift. The threshold hydrogen number density for star formation is and the star formation time-scale at the threshold density is Gyr (in general, the star formation time-scale above the threshold density is ).
Radiative cooling and heating was invoked using a primordial cooling function and a uniform UV background (UVB) radiation field peaking at at (Haardt & Madau, 1996). No radiative transfer (RT) of the UVB was performed - for the very massive galaxies targeted in this work, RT effects on the dynamics of galaxy formation are expected to be negligible.
In calculating the supernova feedback, a Salpeter (1955) stellar initial mass function (IMF) is assumed. As this is the only way the simulations depend on the choice of IMF (we only present results in terms of stellar masses, and chemical evolution is not invoked), the results presented are essentially IMF independent (e.g., Springel & Hernquist 2003).
At =0, part of the Coma simulation volume ends up as a galaxy cluster of virial mass 1.2x10¹⁵ M⊙ and X-ray emission weighted temperature 6.0 keV. The proto-cluster region was selected from a cosmological, DM-only simulation of a flat CDM model, with =0.3, =0.045, =0.7 and =0.9 and a box-length of 150 Mpc. Mass and force resolution was increased in, and gas particles added to, the Lagrangian proto-cluster region. Using GADGET-2, the region was then re-simulated using 7.1 million baryonic+DM particles with == 3.9x10⁷ and =2.2x10⁸ M⊙ for the high resolution gas, star and dark matter particles.
As the galaxies we want to simulate are very compact at , with kpc, it is critical that the force resolution is high. To assess the numerical effects of force resolution, we carried out the (otherwise identical) proto-cluster region simulations at three different force resolutions, with gravity softening lengths of (,,)= (0.70,0.70,1.24), (0.35,0.35,0.62) and (0.17,0.17,0.31) kpc, respectively. Moreover, hydrodynamical smoothing lengths were restricted to be not smaller than 10% of the gas and star particle gravity softening lengths. As will be shown in the next section, only for the last set of gravity softening lengths is a realistic modeling of the compact galaxies achieved. In addition, it is shown that the compact galaxies are strongly baryon dominated, so what matters for the resolution of the galaxies is the force resolution of the gas and stars.
In order to assess also effects of mass resolution, we ran an additional set of simulations of the formation of an individual galaxy, known from previous work (Sommer-Larsen, Götz & Portinari, 2003) to become a elliptical galaxy at (we shall dub this galaxy “E4”). Three simulations of this individual galaxy were carried out: One, (“E4HR”), with 9.8 million particles, == 9.1x10⁴ and =5.2x10⁵ M⊙ and (,,)= (0.10,0.10,0.18) kpc, and two, (“E4” and “E4SS”), with 1.3 million particles, ==7.3x10⁵ and =4.2x10⁶ M⊙, and (,,)= (0.20,0.20,0.36) and (0.10,0.10,0.18) kpc, respectively.
For all simulations, gravitational softening lengths were fixed in co-moving coordinates till =6, subsequently in physical coordinates. Numerical parameters of the simulations are summarized in Table. 1
2.1. Simulations with no “late” star formation
Observationally, the compact galaxies in general appear to contain little stars of ages Gyr, corresponding to formation redshifts less than about three. The reason for this truncation of star formation, if real, is not known, but is likely related to the effect of accretion onto super-massive black holes at the centers of the galaxies, and the resulting violent feedback effects (e.g., Bower et al., 2006; Croton et al., 2006).
In the simulations described above, AGN feedback was not invoked, and some residual star formation takes place also at . To assess, in a simple way, how the results obtained depend on this “late”, possibly spurious, star formation, we carried out three additional simulations, one for the Coma proto-cluster region, and two for the E4 proto-elliptical region. In each, star-formation and radiative cooling and heating was switched off at , and the simulations were then continued to . These simulations represent the extreme case of purely “dry merging” and “passive” evolution since — see also Sommer-Larsen & Limousin (2009). Numerical parameters of these three additional simulations, dubbed “Coma3noSF”, “E4SSnoSF” and “E4HRnoSF” are also given in Table. 1.
3. Results
3.1. Identification of galaxies
Galaxies, as represented by their stellar content, were identified using the approach outlined in Sommer-Larsen et al. (2005) and Romeo et al. (2005, 2006). In particular, care was taken to remove unbound stars from the galaxies — this is mostly of relevance for the Coma simulations at , as the final cluster contains a large number of intra-cluster stars (Sommer-Larsen et al., 2005).
Second, galaxies in process of merging were removed from the sample. Specifically, at any , galaxies containing multiple structures separated by less than 10 kpc were removed. The fraction of such galaxies was at any small, .
For the Coma runs, at the final galaxy sample comprises galaxies down to the resolution limit of , corresponding to . At , due to the substantial amount of merging and tidal destruction taking place from redshift 2 to 0, the number of identified is reduced to about 2500. For the simulation with no star formation since , the effect is more pronounced: a reduction from about 3000 galaxies at to 1100 at .
3.2. Determination of galaxy effective radii
As a first step in determining the effective radii of the galaxies, for a given galaxy all (bound) stars within a radius of and centered on the galaxy are selected. At , a value of kpc is used. This is several times larger than the “optical radius” (see below), and the results presented in this paper are in any case not sensitive to the exact choice of . At , kpc is used, except for the cD, for which kpc is adopted.
Next, stellar surface density profiles are determined as follows: the spatial distribution of stars for a given galaxy is projected along the three cardinal directions, and the resulting three projected distributions co-added. The azimuthally averaged mass surface density profile (including averaging over the three cardinal directions) is subsequently obtained in annuli of pc, where is the difference between the outer and inner radius of the annulus.
At , the “optical radius”, , of the galaxy is then determined, by interpolation of the surface density profile. is defined to correspond to a mass surface density of
| (1) |
where is the surface brightness corresponding to the optical radius of a galaxy, assumed here to be 25 B-mag/arcsec2, corresponding to 155 /pc2, and is the projected B-band mass-to-light ratio at . Based on models incorporating full chemical evolution, non-instantaneous super-nova driven energy and heavy element feedback, UVB radiative transfer etc, and adopting a Salpeter (1955) initial mass function we estimate at =0 (Sommer-Larsen & Toft 2010), and adopt this value in the following.
At , it is less obvious how to determine the “optical radius”, , of a galaxy. Motivated by Hopkins et al. (2009b), we define the optical radius as the radius where the mass surface density is magnitudes, i.e. a factor of 10(q/2.5), below the central surface density, defined as the mean surface density inside of the effective radius, . The values of and are determined through an iterative procedure, as detailed below. A value of =4 is assumed — we find that the results presented in this paper are insensitive to moderate variations of .
Once the optical radius of the galaxy is determined, the total projected stellar mass inside of , , is calculated. Next, the effective radius, , is determined as the projected radius containing a projected stellar mass of — we are in this assuming a constant mass-to-light ratio; this assumption will be relaxed in Sommer-Larsen & Toft (2010). At , the determination of is straightforward; at , depends on , as described above, and an iterative procedure is used in determining and — this procedure, however, is fully robust, and also quite straightforward.
At , it makes sense to compare effective radii determined in the two different ways described above. For the more massive, well resolved galaxies (see section 4), it is found that the effective radii are consistent to within %.
3.3. Galaxy effective radii, velocity dispersions and stellar densities
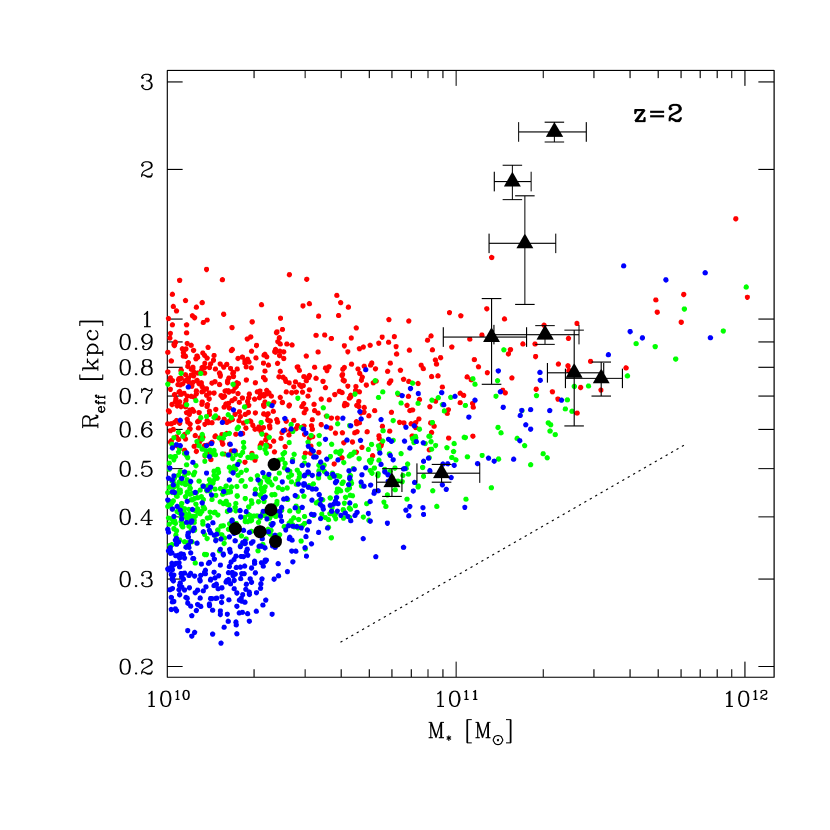
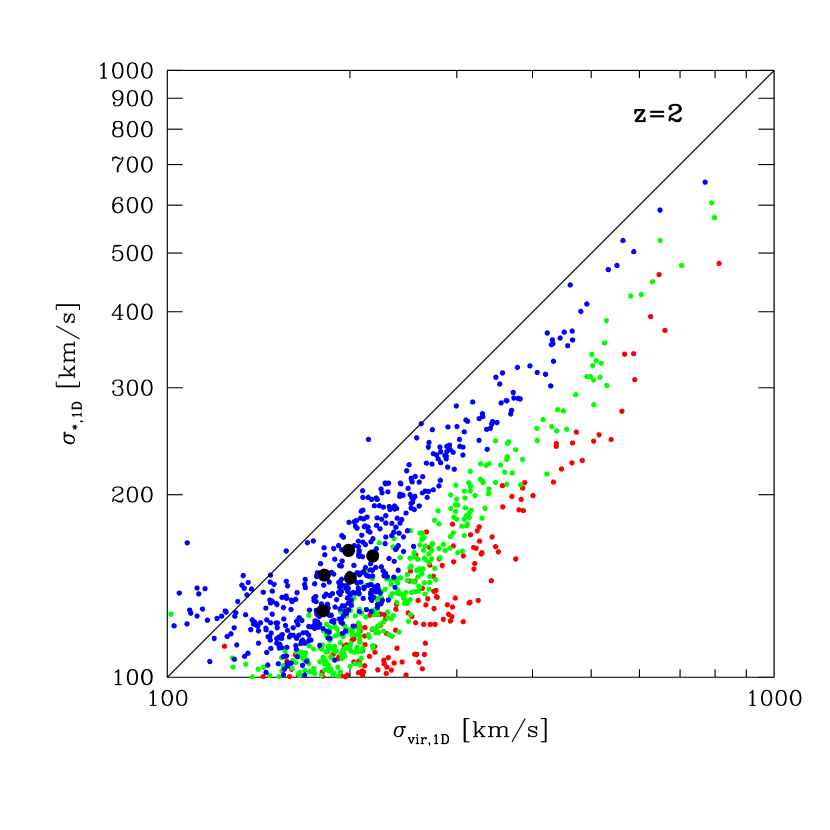
Figure 1 shows, at , vs. for the three Coma simulations of varying force resolution. At the high mass end, , for all three simulations, and the results of the three runs agree fairly well. At lower masses, , the agreement is clearly less good. This is not surprising, since, judging from the highest resolution simulation, for such galaxy masses, for the simulation of poorest force resolution, and for the intermediate resolution simulation. This strongly indicates that, in this mass range, only the highest resolution simulation, if any, can be used for modeling of the compact galaxies. In order to assess whether the resolution of the latter simulation is sufficient, we now determine the velocity dispersions of the galaxies. Specifically, we calculate, for each galaxy, the 1D velocity dispersion of the stars inside of physical radius =2, , and compare this to what is expected from dynamics (assuming that the galaxies are baryon dominated in the inner parts — see section 4), viz,
| (2) |
For simplicity we assume that all stellar mass resides inside of , which will somewhat overestimate the values of — see below. Shown in Fig. 2 is vs. for the three Coma simulations at , with only galaxies of shown. As can be seen from the figure, at the highest spatial resolution, , whereas at poorer spatial resolutions this is not the case. This indicates that the highest spatial resolution is sufficient for the modeling presented, although the mass resolution, and, in particular, the two-body relaxation time, are possible issues — this is further discussed in the next section. The fact that, for Coma3, still lies % below could be taken as an indication that the force resolution is still not adequate. However, shown also in the figure, are results, at , for five galaxies of from the E4HR run, which has higher force resolution and much higher mass resolution than Coma3. The data points are seen to fall perfectly on the relation inferred from Coma3, indicating that the % offset is more likely due to the assumption that all stellar mass resides inside of .
Given the above findings, we shall in the following, when analyzing the proto-cluster simulations, only discuss results of the highest force resolution simulation, Coma3.
Motivated by the finding below, that the characteristic stellar densities of the galaxies are approximately independent of , we fit a relation of the form to the data (to guide the eye, a line of logarithmic slope 1/3 is shown in Fig. 1). Fitting to the Coma3 data in the definitely resolved mass range of (see section 4), we find kpc, where is the total stellar mass in units of . The Coma2 simulation yields, for the same mass range, kpc, indicating that the galaxies in this mass range are resolved. For simulation Coma3noSF we find , so these galaxies are only very marginally less compact than the Coma3 ones.
On the observational side, for the 9 data points of van Dokkum et al. (2008), the inferred stellar galaxy masses depend on the stellar initial mass function (IMF) adopted. For a Salpeter IMF we find, giving each data point equal weight, kpc; for a Kroupa IMF, the case assumed in Figs. 1 and 3, the corresponding result is kpc. Although the Coma3 results are marginally consistent with the observations, when assuming a Salpeter IMF, our results indicate that the proto-cluster galaxies are more compact than the data of van Dokkum et al. (2008).
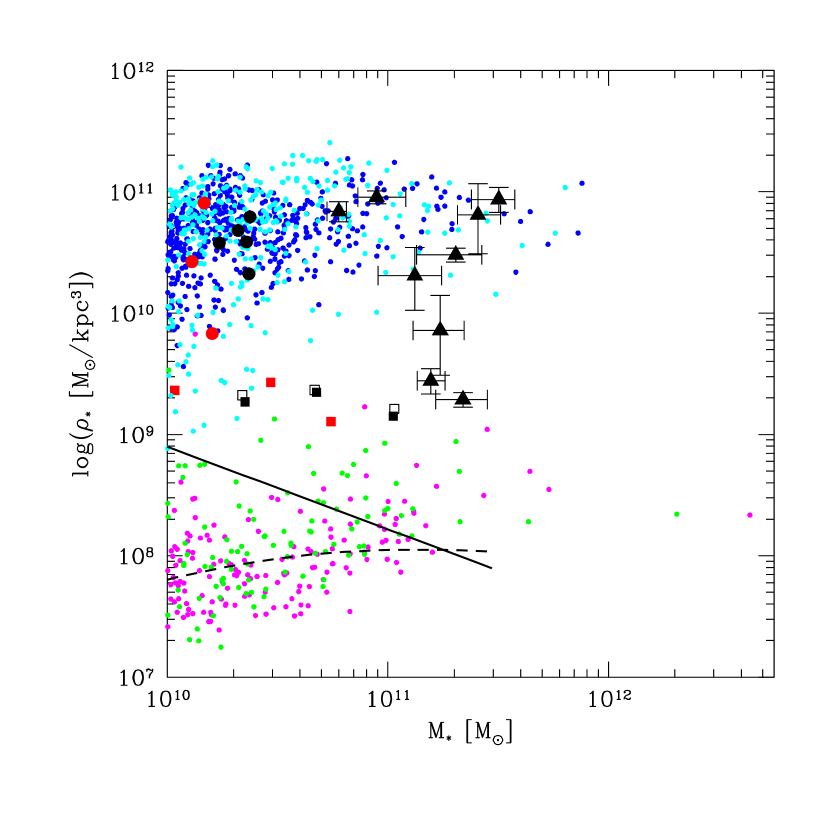
In Fig. 3 we show, for the Coma3 and Coma3noSF simulations, and at and , galaxy characteristic stellar densities, defined as
| (3) |
following van Dokkum et al. (2008). Also shown are the compact galaxy data points from van Dokkum et al. (2008). As can be seen from the figure, the results for the two simulations are located similarly in the diagram, cf. the discussion above. Moreover, the simulations reproduce the upper locus of the observational data quite well, but on average, the observational data fall somewhat below the simulation. The reason for this, and the similar situation in Fig. 1, is likely that the observations cover a substantial range of environments, whereas the simulations trace a specific proto-cluster region. The dispersion in for the simulated galaxies, at a given , is about 60%, much larger than the statistical uncertainty of about 15%, derived by comparing results along the three different projection directions. This strongly indicates that the scatter seen in the figure is real. The observational scatter is larger than that of the simulated galaxies, specifically the scatter is a factor — this again is most likely due to environmental effects. The fact that the simulations can reproduce the properties of the most compact, massive galaxies is the most important result of this paper.
For comparison to present day galaxies is shown the median loci of the SDSS galaxies, divided into early and late types — see (Shen et al., 2003) for details. A thorough discussion of the morphology of the simulated galaxies will be given in Sommer-Larsen & Toft (2010), but here we just note that the average gas fraction of the galaxies of is and for the Coma3 and Coma3noSF simulations, respectively. This strongly hints that the bulk of the simulated galaxies have early type characteristics. At masses, , of the simulated galaxies falls somewhat below the locus of SDSS early type galaxies. This may, at least partly, be a numerical effect, caused by two-body relaxation, as will be discussed in section 4.
3.4. Projected velocity dispersions
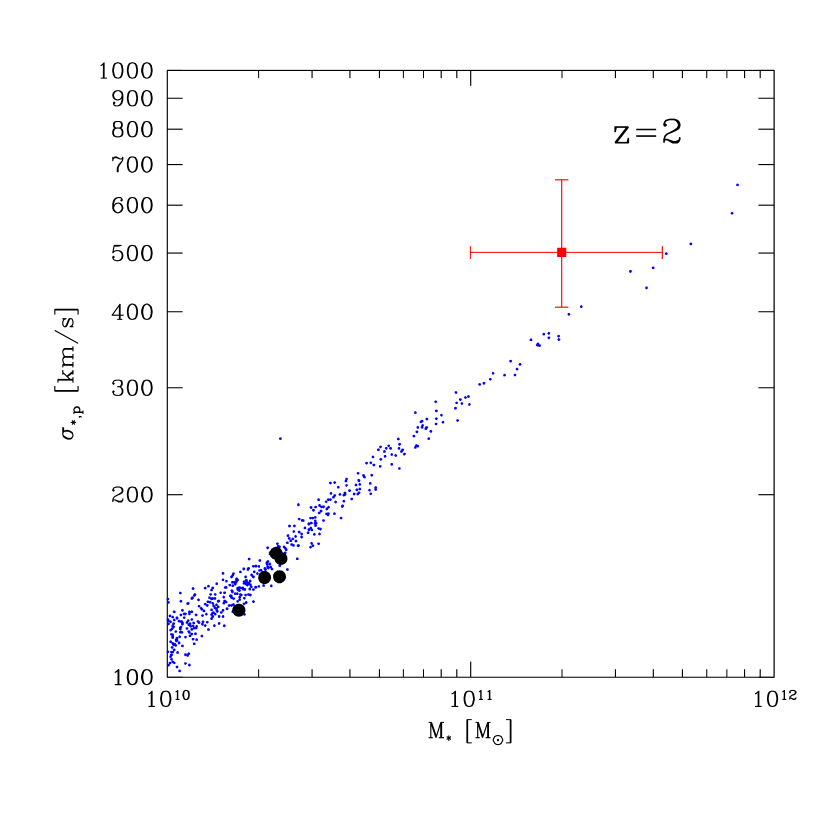
For comparison to observations we also calculate projected (line-of-sight) stellar velocity dispersions for the galaxies at . Specifically, for a given galaxy we project the spatial stellar distribution along the three cardinal axis, and calculate the line-of-sight velocity dispersion, , for all stars within projected distance of the galactic center, and averaging over the three projection directions. The results are shown in Fig. 4, both for Coma3 and for E4HR. Also shown is the observational result of van Dokkum et al. (2009) for the compact, galaxy 1255-0, km/s. Kriek et al. (2009) estimate the stellar mass of the galaxy to be , and van Dokkum et al. (2009) the dynamical mass to lie in the range . Assuming a stellar mass of the measurement of van Dokkum et al. (2009) is consistent with the simulations at the 1.1- level. But, taken at face value, the simulations indicate a somewhat larger galaxy mass, . We note that 1255-0, with an effective radius of kpc, is one of the most compact galaxies observed (for its stellar mass), and lies close to the mean locus of the Coma3 galaxies.
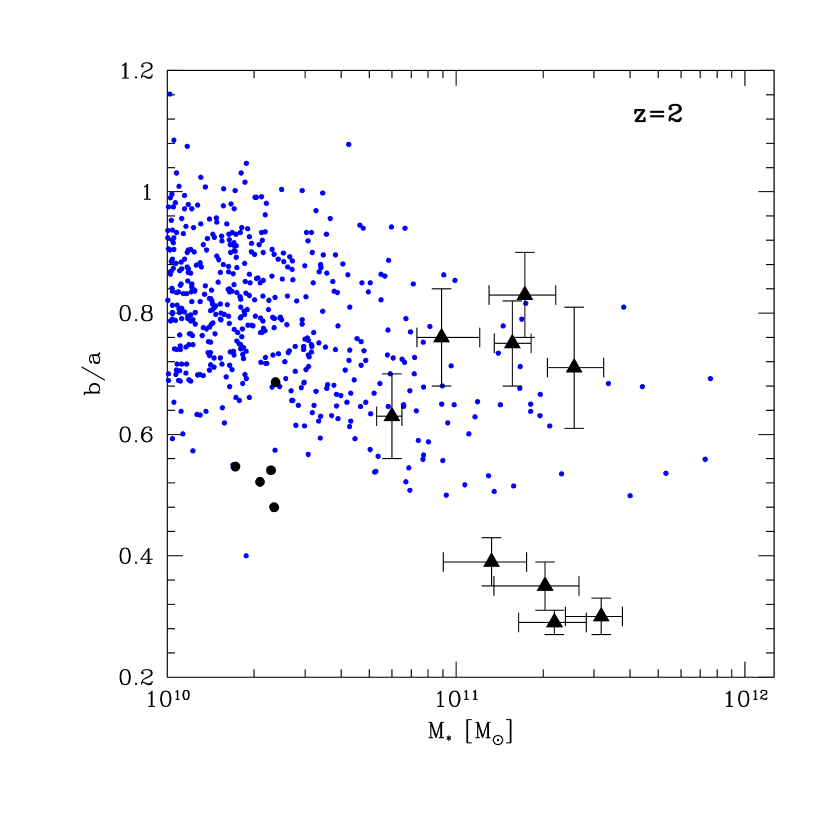
3.5. Axial ratios, rotation and velocity anisotropy
For each galaxy, the angular momentum of the stars inside of was determined, and the coordinates rotated such that the new z-axis was aligned with the angular momentum vector. The axial ratio is, for simplicity, determined as
| (4) |
which is exact for a prolate spheroid. The averaging is performed over all stars inside of . In Fig. 5 is shown vs. for the Coma3 run at . For the 27 galaxies of , we find with a dispersion of 0.1.
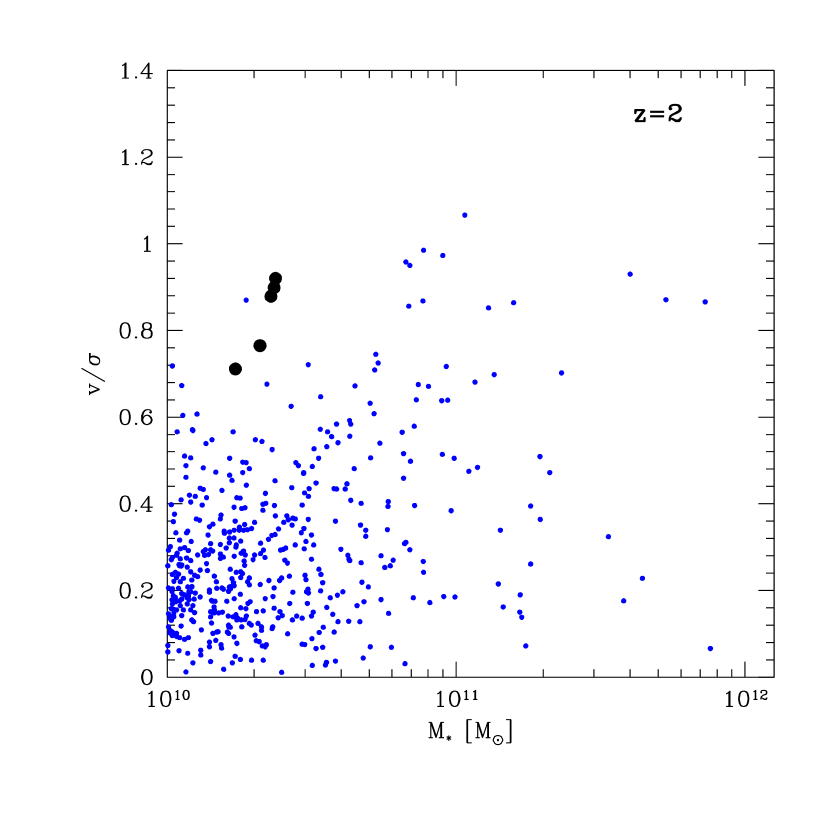
Next, the mean rotation velocity (about the z-axis) of each galaxy, , is determined. Moreover, the average 1D velocity dispersion along directions perpendicular to the z-axis, , is estimated as
| (5) |
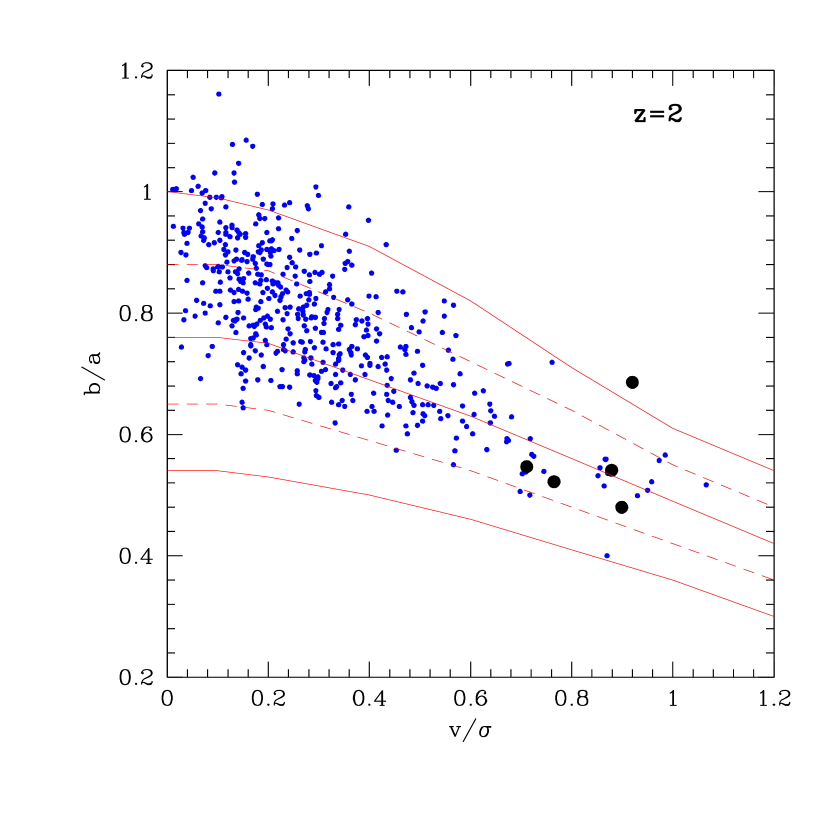
where is the radial coordinate and is the azimuthal angle in cylindrical coordinates. In Fig. 6 is shown the ratio vs. . For the 27 galaxies of , we find with a dispersion of 0.3, and a maximum value of . Such rotation velocities are dynamically important, and result in flattened galaxies even for isotropic velocity-dispersion tensors. To investigate whether the galaxies are flattened by rotation only, we show in Fig. 7 vs. . As can be seen, the two quantities are correlated, so rotation clearly plays a role in shaping the galaxies. Also shown in the figure are curves of different
| (6) |
calculated on the basis of the tensor virial theorem for spheroids of concentric isodensity surfaces (Binney & Tremaine, 1987). As can be seen, models with isotropic velocity-dispersion tensors do not match the bulk of the galaxies well; values of are indicated.We conclude that rotation and velocity anisotropy both contribute significantly in flattening the compact galaxies.
4. Discussion
The results presented in the previous section indicate that the massive, compact galaxies can be reproduced in the highest force resolution simulations, but that the galaxies at masses get a bit too “puffed up” relative to observations. Given that the galaxies are represented by relatively modest numbers of star particles ( at , and at ; for the Coma3 galaxies, the number of star particles is related to the total stellar mass by , where is the total stellar mass in units of ), and that the galaxies are characterized by comparatively large stellar densities, it is important estimate the two-body relaxation time in the galaxies. Following Binney & Tremaine (1987), this can be expressed as
| (7) |
where is the number of particles, is the Coulomb logarithm and the system crossing time. The Coulomb logarithm can for a system of gravitationally softened particles be expressed as
| (8) |
where is the radius of the system, and is the gravitational softening length of the star particles (assumed to dominate the mass density in the inner galaxy — see below). The crossing time is given by
| (9) |
where is the typical 1D velocity dispersion. We shall conservatively assume that all stellar mass is contained within . Moreover, based on Fig.1, we assume the approximate relation kpc. Finally, we approximate the Coulomb logarithm as , assuming a typical value of kpc, and inserting the gravitational softening length of star particles in the highest force resolution simulation. Setting
| (10) |
and inserting all the above in eq.[7], we obtain
| (11) |
where is the stellar mass of the galaxy in units of , and is the stellar particle mass. Taken at face value, this indicates that for the present simulations only galaxies of will be unaffected by two-body relaxation during the Gyrs evolution from to . Note, however, that cold accretion and merging will cause the galaxies to gradually “puff up” (e.g., Naab et al., 2009), which will lessen the above constraint. Despite this, it is very likely that the structure of the galaxies of has been affected by two-body relaxation. In fact, at , the two-body relaxation time is comparable to the mean age of the stellar population at , so even at , the structure of the simulated galaxies of may in principle be somewhat affected by two-body relaxation effects. We shall hence conservatively denote the mass range , at , the definitely well resolved mass range.
To assess, more quantitatively, the effects of mass resolution and two-body relaxation, we carried out simulations of an individual proto-elliptical galaxy region at much higher mass resolution than used in the proto-cluster simulations (cf. Table 1). The main elliptical galaxy formed has a final stellar mass of about , and resides in a “field” galaxy region (Sommer-Larsen, Götz & Portinari, 2003). At the region contains 5 galaxies of stellar mass . Using eq.[11] it is easy to show that and for simulations “E4” and “E4HR”, respectively, where is the present age of the Universe. In Figures 1-3 are shown , and for these five proto-galaxies at . Moreover, at , the simulation contains three galaxies of . The values of for these three galaxies are also shown in Fig. 3. As can be seen from the figures, the high-resolution proto-elliptical results are broadly consistent with the high force resolution proto-cluster results. This may indicate that the latter results are not severely affected by two-body relaxation effects — but see below. On the other hand, the discrepancy between the elliptical galaxy and cluster results could indicate that the latter, at , are affected by relaxation effects. However, there is no fundamental reason why elliptical galaxies in a “field” region and in a cluster regions should have identical properties. Hence, in order to determine the characteristics of , cluster galaxies, simulations of higher mass resolution have to be undertaken - such simulations are in progress.
As proto-cluster regions are some of the first regions in which the growth of small density fluctuations goes non-linear, later causing re-collapse and galaxy formation, it is possible that the galaxies formed in the present simulations on average are even more compact than the limited number of galaxies observed so far - in fact, this is indicated by Figs. 1 and 3. It is hence important to also simulate other, and perhaps more representative, regions of the Universe as well. This will also be the topic of forthcoming work.
As can be seen from Fig. 5, the Coma3 and E4HR
galaxies satisfy . Three of the nine galaxies observed
and analyzed by van Dokkum et al. (2008) are flatter than this, with
. This hints at a real discrepancy, which
is only aggravated when considering that the observed axial
ratios are apparent, such that the observed galaxies may be
intrinsically even flatter.
The reason for the discrepancy is not
clear — it may originate from comparing galaxies formed in different
environments, but the discrepancy appears to pertain to both
the proto-cluster and proto-elliptical (“field”) simulations.
It may also stem from not comparing observations and simulations in
a consistent way, or, finally, be caused by not including sufficient
input physics in
the simulations, in this way relating to the “angular momentum problem”
(e.g., Sommer-Larsen et al. 2003) - work is in progress to
address this issue as well.
Also, the E4HR galaxies appear flatter on average than the Coma3
galaxies of the same stellar mass. This may be an environmental
effect, but may also be due to the galaxies
spuriously growing rounder with time due to effects of two-body
relaxation, cf. the discussion above.
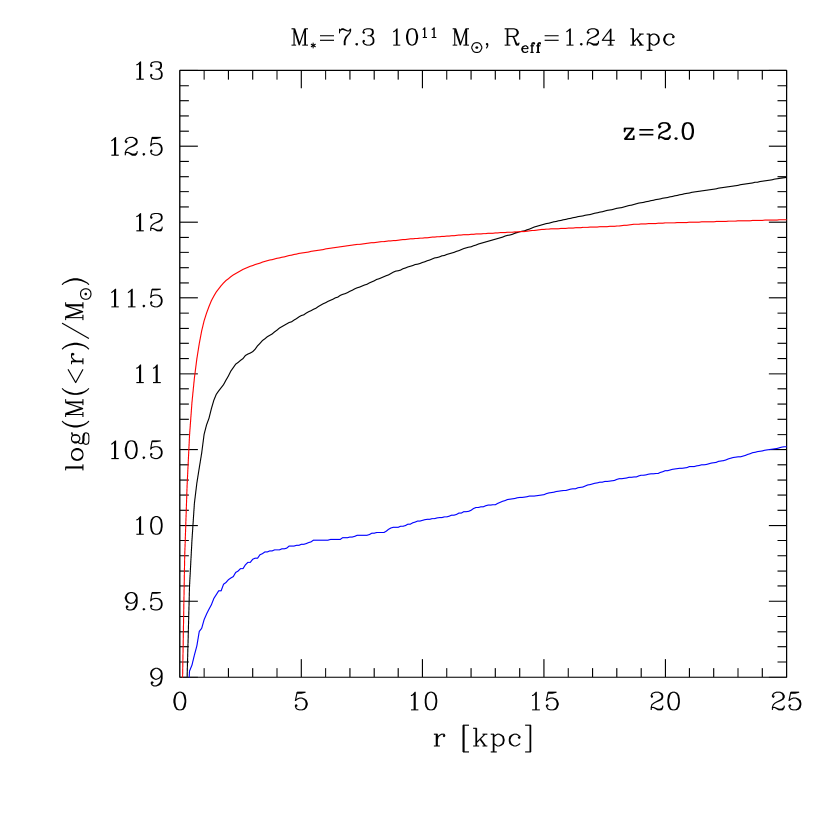
In our derivation of expected virial velocity dispersions (eq.[2]), we have assumed that the galactic mass inside of two effective radii is dominated by stellar mass. In Fig. 8, we show the cumulative distribution of gas, stellar and dark matter mass for a massive (), galaxy from the Coma3 run. As can be seen, the inner mass distribution is indeed dominated by the stellar mass, with the dark and stellar masses only becoming equal at . This is a general finding at : for the mass range for which the mass resolution is definitely sufficient, , the fraction of dark matter mass inside of is of the order 20%.
Finally, it is clearly of interest, in relation to comparison to observations, to calculate surface brightness profiles for the simulated galaxies. A detailed analysis of this, invoking radially dependent mass-to-light ratios, will be presented in Sommer-Larsen & Toft (2010).
5. Conclusion and outlook
Motivated by recent observational findings, we
investigate the structure and dynamics of high-mass
() galaxies.
Specifically, a number of
cosmological hydrodynamical/N-body simulations of
a Mpc3 co-moving (lagrangian), proto-cluster region
have been undertaken. At , the highest resolution simulation
contains resolved galaxies, of which 27 have ,
and 5 have .
In addition, we ran a number
of simulations, including one of ultra-high resolution, of a forming
proto-elliptical galaxy.
Total stellar masses, effective radii and characteristic stellar
densities have been determined for all galaxies. At , for the
definitely well resolved (proto-cluster) mass range of
, we find a
relation of the form kpc,
where is the total stellar mass in units of .
This is in line with recent observational findings for very
massive, compact galaxies, though somewhat more compact
than the observed average. The only line-of-sight velocity dispersion
measured for a compact galaxy is very large,
km/s (van Dokkum et al., 2009). This value can
be matched at about the 1- level, although a somewhat
larger mass than the estimated is indicated.
It is found that the massive compact galaxies are strongly baryon dominated
in their inner parts, with typical dark matter mass fractions of order
only 20% inside of .
To further study the kinematics and dynamics of the galaxies, we calculated axial ratios, rotation velocities and velocity dispersion tensors for these. For the above mass range, the galaxies have an average axial ratio with a dispersion of 0.1, and an average rotation to 1D velocity dispersion ratio with a dispersion of 0.3, and a maximum value of . Rotation and velocity anisotropy both contribute significantly in flattening the compact galaxies. Some of the observed compact galaxies appear flatter than any of the simulated galaxies — additional work is required to understand the origin of this possible discrepancy.
Simulations of different environments, of higher numerical resolution and/or based on more detailed input physics are in progress — the results will be presented in forthcoming papers.
Acknowledgments
We are indebted to Peter Johansson for patient help on running and re-coding the GADGET-2 code. In addition we have benefited from discussions with him and Thorsten Naab. We also thank Anders Sommer-Larsen for assistance in preparing the figures.
We gratefully acknowledge abundant access to the computing facilities provided by the Danish Centre for Scientific Computing (DCSC). This work was supported by the DFG Cluster of Excellence “Origin and Structure of the Universe”. The Dark Cosmology Centre is funded by the Danish National Research Foundation. We acknowledge support from the Lundbeck Foundation.
References
- Bell et al. (2006a) Bell, E. F., Naab, T., McIntosh, D. H., Somerville, R. S., Caldwell, J. A. R., Barden, M., Wolf, C., Rix, H.-W., Beckwith, S. V., Borch, A., Häussler, B., Heymans, C., Jahnke, K., Jogee, S., Koposov, S., Meisenheimer, K., Peng, C. Y., Sanchez, S. F., & Wisotzki, L. 2006a, ApJ, 640, 241
- Bell et al. (2006b) Bell, E. F., Phleps, S., Somerville, R. S., Wolf, C., Borch, A., & Meisenheimer, K. 2006b, ApJ, 652, 270
- Bezanson et al. (2009) Bezanson, R., van Dokkum, P. G., Tal, T., Marchesini, D., Kriek, M., Franx, M., & Coppi, P. 2009, ApJ, 697, 1290
- Binney & Tremaine (1987) Binney, J., Tremaine, S. 1987, Galactic Dynamics, Princeton Univ. Press, Princeton
- Bower et al. (2006) Bower R.G., Benson A.J., Malbon R., Frenk C.S., Baugh C.M., Cole S., Lacey C.G. 2006, MNRAS 370, 645
- Buitrago et al. (2008) Buitrago, F., Trujillo, I., Conselice, C. J., Bouwens, R. J., Dickinson, M., & Yan, H. 2008, ApJ, 687, L61
- Bundy et al. (2009) Bundy, K., Fukugita, M., Ellis, R. S., Targett, T. A., Belli, S., & Kodama, T. 2009, ApJ, 697, 1369
- Cimatti et al. (2008) Cimatti, A., Cassata, P., Pozzetti, L., Kurk, J., Mignoli, M., Renzini, A., Daddi, E., Bolzonella, M., Brusa, M., Rodighiero, G., Dickinson, M., Franceschini, A., Zamorani, G., Berta, S., Rosati, P., & Halliday, C. 2008, A&A, 482, 21
- Ciotti et al. (2007) Ciotti, L., Lanzoni, B., & Volonteri, M. 2007, ApJ, 658, 65
- Croton et al. (2006) Croton, D.J., et al. 2006, MNRAS, 367, 864
- Daddi et al. (2005) Daddi, E., Renzini, A., Pirzkal, N., Cimatti, A., Malhotra, S., Stiavelli, M., Xu, C., Pasquali, A., Rhoads, J. E., Brusa, M., di Serego Alighieri, S., Ferguson, H. C., Koekemoer, A. M., Moustakas, L. A., Panagia, N., & Windhorst, R. A. 2005, ApJ, 626, 680
- Damjanov et al. (2009) Damjanov, I., McCarthy, P. J., Abraham, R. G., Glazebrook, K., Yan, H., Mentuch, E., LeBorgne, D., Savaglio, S., Crampton, D., Murowinski, R., Juneau, S., Carlberg, R. G., Jørgensen, I., Roth, K., Chen, H.-W., & Marzke, R. O. 2009, ApJ, 695, 101
- D’Onghia et al. (2005) D’Onghia, E., Sommer-Larsen, J., Romeo, A. D., Burkert, A., Pedersen, K., Portinari, L., & Rasmussen, J. 2005, ApJL, 630, L109
- Fan et al. (2008) Fan, L., Lapi, A., De Zotti, G., & Danese, L. 2008, ApJL, 689, L101
- Franx et al. (2008) Franx, M., van Dokkum, P. G., Schreiber, N. M. F., Wuyts, S., Labbé, I., & Toft, S. 2008, ApJ, 688, 770
- Genel et al. (2008) Genel, S., Genzel, R., Bouché, N., Sternberg, A., Naab, T., Schreiber, N. M. F., Shapiro, K. L., Tacconi, L. J., Lutz, D., Cresci, G., Buschkamp, P., Davies, R. I., & Hicks, E. K. S. 2008b, ApJ, 688, 789
- Haardt & Madau (1996) Haardt, F., & Madau, P. 1996, ApJ, 461, 20
- Hopkins et al. (2009a) Hopkins, P. F., Hernquist, L., Cox, T. J., Keres, D., & Wuyts, S. 2009a, ApJ, 691, 1424
- Hopkins et al. (2009b) Hopkins, P. F., Bundy, K., Murray, N., Quataert, E., Lauer, T. R., & Ma, C.-P. 2009b, MNRAS, 1043
- Khochfar & Silk (2006) Khochfar, S. & Silk, J. 2006, ApJL, 648, L21
- Khochfar & Silk (2009) Khochfar, S., & Silk, J. 2009, MNRAS, 397, 506
- Kriek et al. (2009) Kriek, M., van Dokkum, P. G., Labbé, I., Franx, M., Illingworth, G. D., Marchesini, D., & Quadri, R. F. 2009, ApJ, 700, 221
- Lia, Portinari & Carraro (2002a) Lia, C., Portinari, L., & Carraro, G. 2002a, MNRAS, 330, 821
- Longhetti et al. (2007) Longhetti, M., Saracco, P., Severgnini, P., Della Ceca, R., Mannucci, F., Bender, R., Drory, N., Feulner, G., & Hopp, U. 2007, MNRAS, 374, 614
- McIntosh et al. (2008) McIntosh, D. H., Guo, Y., Hertzberg, J., Katz, N., Mo, H. J., van den Bosch, F. C., & Yang, X. 2008, MNRAS, 388, 1537
- Naab et al. (2006) Naab, T., Khochfar, S., & Burkert, A. 2006, ApJL, 636, L81
- Naab et al. (2009) Naab, T., Johansson, P. H., & Ostriker, J. P. 2009, ApJ, 699, L178
- Romeo et al. (2005) Romeo, A. D., Portinari L., & Sommer-Larsen, J. 2005, MNRAS, 361, 983
- Romeo et al. (2006) Romeo, A. D., Sommer-Larsen, J., Portinari, L., & Antonuccio-Delogu, V., 2006, MNRAS, 371, 548
- Ruszkowski & Springel (2009) Ruszkowski, M. & Springel, V. 2009, ArXiv:0902.0373
- Salpeter (1955) Salpeter E.E., 1955, ApJ 121, 161
- Saracco et al. (2008) Saracco, P., Longhetti, M., & Andreon, S. 2008, ArXiv: 0810.2795
- Shen et al. (2003) Shen, S. et al. 2003, MNRAS, 343, 978
- Sommer-Larsen, Götz & Portinari (2003) Sommer-Larsen J., Götz M., Portinari L., 2003, ApJ, 596, 46
- Sommer-Larsen et al. (2005) Sommer-Larsen J., Romeo, A. D., Portinari L., 2005, MNRAS, 357, 478
- Sommer-Larsen & Limousin (2009) Sommer-Larsen J., Limousin, M., 2009, MNRAS, submitted (astro-ph/0906.0573)
- Sommer-Larsen & Toft (2010) Sommer-Larsen J., Toft, S., 2010, ApJ(in prep),
- Springel (2005) Springel, V. 2005, MNRAS, 364, 1105
- Springel & Hernquist (2003) Springel, V. & Hernquist, L. 2003, MNRAS, 339, 289
- Toft et al. (2007) Toft, S., van Dokkum, P., Franx, M., Labbe, I., Förster Schreiber, N. M., Wuyts, S., Webb, T., Rudnick, G., Zirm, A., Kriek, M., van der Werf, P., Blakeslee, J. P., Illingworth, G., Rix, H.-W., Papovich, C., & Moorwood, A. 2007, ApJ, 671, 285
- Toft et al. (2009) Toft, S., van Dokkum, P., Franx, M., Labbe, I., Förster Schreiber, N. M. & Wuyts, S., 2009, ApJ (in press),
- Trujillo et al. (2007) Trujillo, I., Conselice, C. J., Bundy, K., Cooper, M. C., Eisenhardt, P., & Ellis, R. S. 2007, MNRAS, 382, 109
- van der Wel et al. (2009) van der Wel, A., Bell, E. F., van den Bosch, F. C., Gallazzi, A., & Rix, H.-W. 2009, ArXiv:0903.4857
- van Dokkum et al. (2008) van Dokkum, P. G., et al. 2008, ApJL, 677, L5
- van Dokkum et al. (2009) van Dokkum, P. G., Kriek, M., & Franx, M. 2009, Nature, 460, 717
- Williams et al. (2009) Williams, R. J., Quadri, R. F., Franx, M., van Dokkum, P., Toft, S., Kriek, M., & Labbe, I. 2009, ApJ (submitted), arXiv:0906.4786
- Zirm et al. (2007) Zirm, A. W., et al. 2007, ApJ, 656, 66