Young T-Dwarf Candidates in IC 348††thanks: Based on observations obtained with WIRCam, a joint project of CFHT, Taiwan, Korea, Canada, France, at the Canada-France-Hawaii Telescope (CFHT) which is operated by the National Research Council (NRC) of Canada, the Institute National des Sciences de l’Univers of the Centre National de la Recherche Scientifique of France, and the University of Hawaii. Research supported by the Marie Curie Research Training Network ”CONSTELLATION” under grant no. MRTN-CT-2006-035890
Abstract
Context. The determination of the lower-end of the initial mass function (IMF) provides strong constraints on star formation theories.
Aims. We report here on a search for isolated planetary-mass objects in the 3 Myr-old star-forming region IC 348.
Methods. Deep, narrowband off and on images were obtained with CFHT/WIRCam over 0.11 sq.deg. in the central part of IC 348 to identify young T-dwarfs from their 1.6 m methane absorption bands.
Results. We report three faint T-dwarf candidates with onoff colours >0.4 mag. Extinction was estimated for each candidate and lies in the range A mag. Comparisons with T-dwarf spectral models, and colour/colour and colour/magnitude diagrams, reject two of the three candidates because of their extreme blueness. The one remaining object is not thought to be a foreground field dwarf because of a number density argument and also its strong extinction A mag, or thought to be a background field T-dwarf which would be expected to be much fainter. Models and diagrams give this object a preliminary T6 spectral type.
Conclusions. With a few Jupiter masses, the young T-dwarf candidate reported here is potentially amongst the youngest, lowest mass objects detected in a star-forming region so far. Its frequency is consistent with the extrapolation of current lognormal IMF estimates down to the planetary mass domain.
Key Words.:
Stars: formation – Stars: low-mass, brown dwarfs – (Galaxy:) open clusters and associations: individual: IC~348 – Stars: luminosity function, mass function – Infrared: stars1 Introduction
To date more than 500 L-dwarfs and about 150 T-dwarfs111dwarfarchives.org - references within have been detected using a variety of optical and IR surveys. The vast majority of detected brown dwarfs are old (3-6 Gyr) field dwarfs (Faherty et al., 2009), having cooled over time. The first detection of a T-dwarf in a star-forming region was put forward by Zapatero Osorio et al. (2002), named S Orionis 70 and detected in $σ$ Orionis. Burgasser et al. (2004) raises questions about the authenticity of the object as a cluster member and suggested that it was a field dwarf in the line of sight, which was backed up with a statistical analysis. Martín (2004) and Zapatero Osorio et al. (2008) undertook further confirmation of the object by follow-up membership and proper motion work. The population of these young, low-mass objects is critical to furthering our understanding of the very low-mass end of the initial mass function (IMF). star-forming regions are well suited to search for the lowest mass brown dwarfs as young objects are hottest, and so brightest immediately after formation. Their temperature decreases over time, since by their very nature they are not massive enough to begin fusion via hydrogen or deuterium synthesis.
One ideal system in which to observe young brown dwarfs and constrain the IMF is IC~348, a star-forming region towards the direction of Perseus, centred at (J2000) 03h44m34s, +32∘09′8′′, and embedded in the foreground part of the Per OB2 association. The age of IC~348 has been determined to be Myr (Muench et al., 2003). This star-forming region is relatively nearby and whilst there is controversy surrounding its distance, IC 348 is located between 261 pc (Scholz et al., 1999) and 316 pc (Herbig, 1998) from the Sun whilst the OB Per association, of which IC~348 is a member, is taken to be between 315 pc (Luhman et al., 2003) and 340 pc (Cernis, 1993). An average value of 300 (15 pc) has been used for this work (Herbst, 2008). Extinction maps for IC~348, ranging from 2<AV<20 mag depending on the cluster region, were derived by Cernis (1993), Muench et al. (2003), and Cambrésy et al. (2006).
Muench et al. (2003) derived the IMF of IC~348 down to 35 MJup and found it to be similar to the IMF of the Trapezium cluster, having a mode between 0.1-0.2 M☉. Approximately 15-25% of the population of the cluster appear to be brown dwarfs and their spatial density is independent of the distance from the cluster centre. The lowest mass objects were not detected in their work because of the detection limits. Those objects with a mass of a few MJup are very faint and cool (1200 K) enough that methane can form in their atmospheres. The presence of methane absorption bands in substellar objects defines the L/T dwarf boundary (Burrows et al., 2006). This was first exploited by Mainzer & McLean (2003) to look for very faint objects in IC 348 to a depth of 19.5 mag. Narrow-band 1.65 m methane imaging of IC~348 was conducted in order to filter out the lower mass T-dwarfs from the L-dwarfs, by their colour differences. They found 12-15 candidates which could be late M, L or T-dwarfs, with masses 5 MJup, although none have been confirmed spectroscopically because of their faint nature. We report here on a new and deeper methane imaging survey using 2 narrow-band filters, on and off, in order to better distinguish between T-dwarfs and more massive young stellar objects in IC~348.
| Telescope | FOV | Filter | Integration time (h) | Pointing coordinates (J2000) |
|---|---|---|---|---|
| CFHT MegaCam | 0.96°0.94° | 2.5 | 03h44m36s.00 +32∘01′500 | |
| CFHT WIRCam | 20 ′20 ′ | off, on | 3.7, 1.4 | 03h44m14s.80 +32∘05′060 |
| CFHT WIRCam | 20 ′20 ′ | , , | 0.35, 0.16, 0.12 | |
| A | 03h44m14s.80 +32∘05′060 | |||
| B | 03h44m14s.80 +32∘15′060 | |||
| C | 03h45m02s.00 +32∘05′060 | |||
| D | 03h45m02s.00 +32∘15′060 |
In Section 2 there appears a short description of the observations and instrumentation used, and of the methane filters. We also describe the photometric extraction method and the resulting catalogues. The criteria for the selection of the candidates are presented in Section 3, and the promising candidates identified. Section 4 discusses the photometric properties of the candidates, their nature and membership status, and Section 5 follows with conclusions.
2 Observations and photometric extraction
This work has made use of the 3.6m Canada France Hawaii Telescope222www.cfht.hawaii.edu (CFHT) on Mauna Kea, specifically the infrared camera WIRCam (Puget et al., 2004) and the wide field imager MegaCam (Boulade et al., 2003). Basic information regarding these surveys is summarised in Table 1, whilst the central wavelengths for the filters used as well as the corresponding extinction coefficients can be found in Table 2. Central, effective, wavelengths and extinction coefficients are taken from the Spanish Virtual Observatory333http://svo.laeff.inta.es/theory/filters/index.php.
| Filter | Aλ/AV | ||
|---|---|---|---|
| m | m | ||
| 0.88 | 0.27 | 0.52 | |
| 1.25 | 0.16 | 0.30 | |
| off | 1.58 | 0.10 | 0.21 |
| 1.63 | 0.29 | 0.20 | |
| on | 1.69 | 0.10 | 0.18 |
| 2.15 | 0.32 | 0.13 |
2.1 WIRCam
WIRCam observations were obtained under programme 06BF23 in service mode between September 2006 and January 2007. A grid of four IR arrays of 20482048 pixels make up the WIRCam detector yielding a field of view of 20 ′20 ′. The pixel scale is 0.306 ″ or 0.15 ″ with microdithering (used for the , and images). WIRCam was used to take narrowband off and on along with , , and images of IC~348. The on and off pointings are both centred at the same location, which includes the cluster’s center, while four overlapping WIRCam fields were taken in , and to provide a larger areal coverage (see Table 1). Total integration times of 3.7h in off and 1.4h in on were obtained from multiple individual exposures of 30s, acquired using a 7-position dithering pattern to fill in the 45-wide gaps in between IR arrays. The same observing strategy was used for JHKs images, with individual integration times of 45, 10, and 15s, respectively, yielding total integration times of 1260s (), 560s () and 420s () for each pointing.
Individual images were detrended using the ‘i‘iwi pipeline (Albert et al., in prep.) at CFHT and sky subtraction, stacking, photometric and astrometric calibrations, and quality control were performed at Terapix444terapix.iap.fr (Marmo, 2007). The seeing (PSF FWHM) measured on the final images was between 0.55″ and 0.65″. The co-added JHKs images were photometrically calibrated using the 2MASS catalogue over the same area and renormalized to an arbitrary photometric zero-point of 30 mag. The methane images have no external photometric calibration and the magnitudes are given here on an arbitrary albeit internally consistent scale, so that on-off0 for unreddened field dwarfs (see below). The Terapix pipeline additionally produced a catalogue of objects with aperture photometry for each filter.
2.2 MegaCam
MegaCam observations were obtained under programme 06BF28 in queue service mode on September 21-23, 2006. MegaCam consists of a grid of 36 2k4k CCDs covering a 1°1° footprint. The pixel size is 13.5 m and the pixel scale is 0.185″. MegaCam was used to take 6 dithered -band images of 1500s each, yielding a total integration time of 9000 s. After detrending the images at CFHT, sky-subtraction, stacking, and photometric and astrometric calibrations were done at Terapix. The images were photometrically calibrated using standard stars routinely observed by the Queue Service Observing team at CFHT. The seeing during the observations ranged from 0.65″ to 0.80″.
2.3 Photometric catalogues
A combination of SExtractor (Bertin & Arnouts, 1996) and PSFex (Bertin et al., in prep.) was used on each image to extract sources and build a photometric catalogue for each image. On a first step, SExtractor extracts well defined stellar-like objects, which are used by PSFex to compute a PSF model that is allowed to vary with position on the detector. Then, SExtractor uses this PSF model to more accurately extract and measure the photometry of all the sources detected on the image. Objects were detected at 3.5 above the background noise (see Section 2.4 for further details), most notably to avoid the high incidence of nebulous emission and reflected nebulosity in the region. This threshold is reasonably low because our interest lies in detecting the faintest possible objects in the region, the methane T-dwarfs. Unfortunately, this low threshold also increases the incidence of non-stellar-like detections because of nebulosities, and many misdetections created via crosstalk in the detector (though this was only particularly problematic in the narrowband observations).
Further analysis was conducted using publicly-available 2MASS data for those detected objects that were bright enough to have a 2MASS counterpart. This was useful for two reasons: firstly that the photometric accuracy and pipeline reduction of the WIRCam images could be compared with those from 2MASS; and secondly that the difference in the photometric systems could be estimated from the photometric differences between the CFHT and 2MASS. The extracted , and catalogues were matched with the , and 2MASS catalogues resulting in 206 stars that had overlapping magnitudes. Based on these, the dispersion between the extracted , and catalogues and the 2MASS , and catalogues was calculated. Good agreement was shown by mean magnitude differences of 0.08 0.02, 0.03 0.05, and 0.04 0.02 for , and respectively. These values hold for the brightest stars in our images, since fainter ones are undetected in the 2MASS survey. In turn, this means that colour effects arising from CFHT filters are not taken into account in this calibration. Indeed, while the photometric zero-point used here is obtained from 2MASS, colour effects are not corrected for and our WIRCam , , , on and off photometry is given in the CFHT Vega system and MegaCam in the AB system.
Each waveband had a catalogue created which was then collated and cleaned of saturated objects, obvious artefacts, and a fraction of extended sources identified from their large PSF FWHM. An approximation of the completeness of the photometric catalogues was estimated from (Nobj) vs. magnitude histograms, where Nobj is the number of stellar-like objects detected on the images. We thus derived completeness limits from Figure 1 (top) of 23.5 (), 21.5 (), 20.0 (), 18.9 (), 20.3 (on), and 20.7 (off). SExtractor photometric errors for each of the six bands are plotted in Figure 1 (bottom), highlighting the increasing photometric error for the faintening of the objects’ brightness. Uniquely, the off error terminates at 0.06 magnitudes as the off image was used for the detection of objects over all bands (see Section 2.4 for further details).
 |
 |
2.4 Methane photometry
The presence of methane absorption bands in the near-IR spectrum of T-dwarfs can be used to identify T-dwarf candidates photometrically (e.g. Tinney et al. 2005). Narrowband off and on data was taken in order to classify these objects. off measures the pseudo-continuum at 1.58 m while on samples the methane absorption band at 1.69 m. The passband of the two filters is overlain onto the spectra of a T0.5 and a T8 dwarfs in Figure 2. Note the greater methane absorption in the T8 dwarf spectrum compared to the T0.5 spectrum in the region around 1.69 m.
Spectra555www.jach.hawaii.edu/skl/LTdata.html of field dwarfs from L1 to T8 were convolved (Delorme et al., 2008) with the WIRCam on and off filters and the resulting methane colours plotted against spectral type in Figure 2. The methane colours are seen to smoothly increase towards later spectral types. Whilst L-dwarfs have onoff colours equal to zero, T-dwarfs have colours above 0.1 mag which rapidly increase towards later T-types. To date, no other types of objects in current knowledge has this sequence of methane colours. Thus, the onoff colour provides a useful means to separate L and T-dwarfs. Additionally, as late-type T-dwarfs may remain undetected in the on image, and due to strong absorption, we first performed object detection at on the off image, then performed PSF photometry at the location of these objects on both the off and on images. This ensures that all objects that could possibly be T-dwarfs are searched for in both filters.
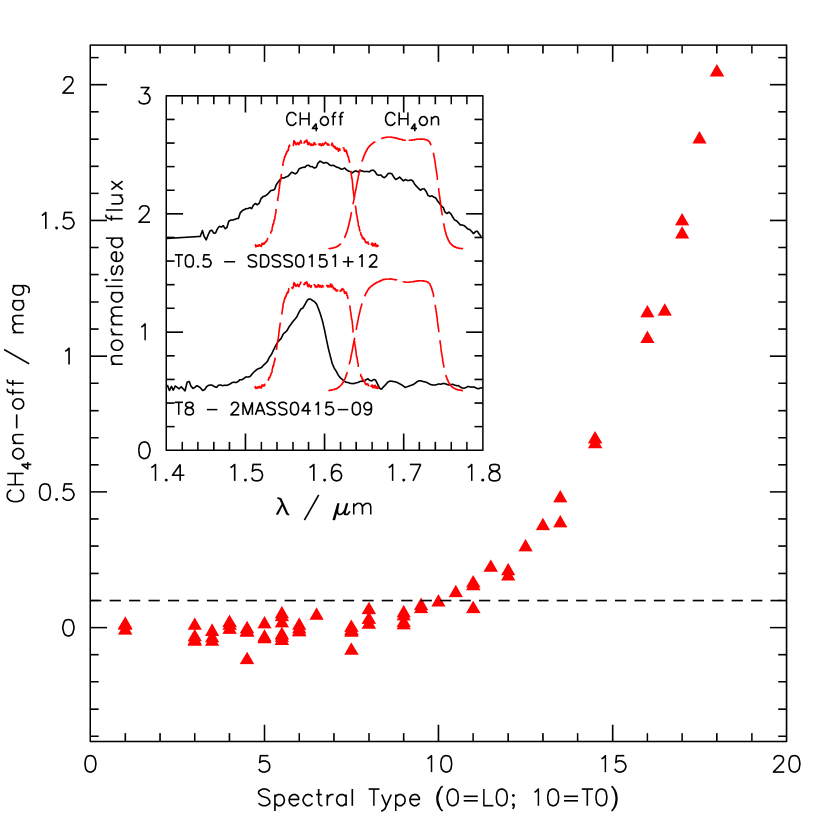
Figure 2 provides an empirical calibration of the methane colours against spectral type for field dwarfs. For comparison, Figure 3 shows the onoff colour as a function of effective temperature () as predicted by COND and DUSTY 3 Myr and 5 Gyr models (Chabrier et al., 2000; Allard et al., 2001; Baraffe et al., 2003). While the DUSTY models are roughly similar at both ages, with onoff 0 at K, the COND models predict bluer colours for younger objects at K. According to the models, IC~348 T-dwarfs would then have a smaller and thus a later spectral type than field T-dwarfs for the same onoff colour.

3 Results
Catalogues were obtained as described above for each of the MegaCam/WIRCam images. The COND and DUSTY 3 Myr and 5 Gyr models666http://phoenix.ens-lyon.fr/simulator/index.faces are also in the CFHT Vega system where the band has been converted into AB magnitudes for our purposes. Similarly, the empirical field L-T dwarf sequence photometry has been adjusted to be consistant with the models and our data. In the colour/magnitude diagram presented the field dwarf sequence has been shifted to the distance of IC~348, taken to be at 300 pc.
3.1 T-dwarf candidate selection
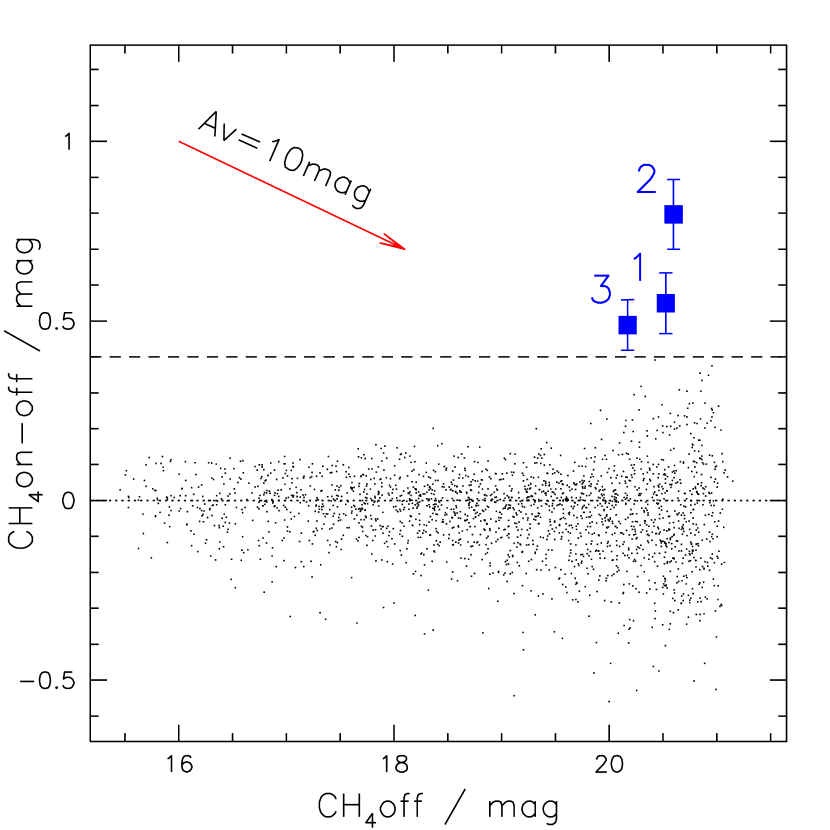
Figure 4 shows onoff against off for stellar-like objects detected on WIRCam methane images. An object was considered as a T-dwarf candidate if onoff 0.4 mag, which corresponds to 3.5 above the L/T transition (onoff ) for the faintest detected objects. Assuming that young T-dwarfs follow the field dwarf methane relation, the spectral type of those objects with onoff 0.4 mag is close to T3 from Figure 2.
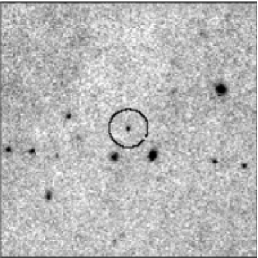
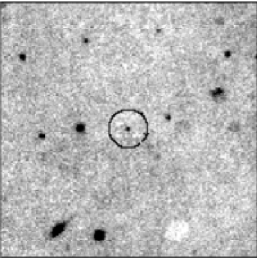
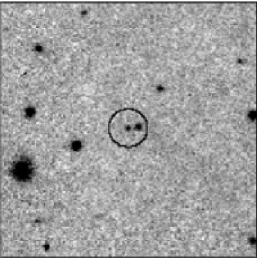
Objects with onoff 0.4 mag were initially all classified as T-dwarf candidates. The objects just below this limit could still be T-dwarfs from their onoff colours as shown in Figure 2, but would be more difficult to extract because of photometric errors. With this criterion 136 sources were selected. This sample was then visually scrutinised on both the off and on images before being reduced to a shortlist of 12 possible candidates. Upon visual inspection, we found that the rejected 124 ‘objects’ were saturated stars, nebulous detections or ghosts. Of these 12 possible candidates, the shape of the PSF and the contours were further examined using IRAF, where 9 were identified as ghosts or detector cross-talk, so reducing this figure to 3 likely candidates. Thumbsized off images of the three candidates are shown in Figure 5.
 |
 |
 |
The PSF photometry of the 3 candidates in z′, , , and on/off filters is listed in Table 3. Candidate IC348_CH4_2 was not detected in the -band. The -band detection limit was estimated by simulating a set of 1948 stars with magnitudes between 20 and 26 using Skymaker (Bertin, 2008). These synthetic stars were then stacked onto the off footprint of the original image using Swarp (Marmo, 2007). At the 3 level, 1688 objects were detected where the faintest had an input magnitude of 25.7, which we take as being the detection limit in the filter.
| Object | off | on | ||||||||||
|---|---|---|---|---|---|---|---|---|---|---|---|---|
| IC348_CH4_1 | 23.32 | 0.07 | 21.62 | 0.04 | 20.95 | 0.07 | 20.22 | 0.06 | 20.52 | 0.04 | 21.06 | 0.08 |
| IC348_CH4_2 | 25.7 | - | 22.51 | 0.07 | 21.65 | 0.08 | 20.10 | 0.04 | 20.59 | 0.04 | 21.37 | 0.10 |
| IC348_CH4_3 | 23.85 | 0.10 | 22.02 | 0.07 | 21.02 | 0.07 | 19.94 | 0.05 | 20.17 | 0.03 | 20.66 | 0.06 |
Most of the objects detected on the WIRCam images lie along the line onoff in Figure 4 as expected for field dwarfs (Tinney et al., 2005), the photometric error increasing with magnitude. The 3 candidates are located in the faintest region of the plot, whilst also having increasing methane colours. The onoff rms photometric error at the magnitude of the candidates is 0.12 mag. The 3 candidates have onoff colours of 0.54, 0.78, and 0.49 mag, respectively, corresponding to a detection level of (see Table 4).
Note that a number of objects in Figure 4 have strongly negative onoff colours, well beyond the rms photometric error. Upon inspection of the images, all these objects turn out to be young IC 348 members deeply embedded in bright compact nebulosities. The large extinction they suffer results in strong reddening, thus yielding blue (i.e. negative) onoff colours in spite of the small wavelength difference between the 2 narrow-band methane filters. Reddening also accounts for the asymmetric colour distribution of the faint background objects in this plot.
Finally, a cross-comparison was made with the study of Mainzer & McLean (2003). They classified 5 candidates as being possibly M, L or T-dwarfs, all of which are detected in our images but with onoff colours between -0.14 and 0.04 mag, placing them out of our T-dwarf candidate criteria.
3.2 Reddening and spectral type estimates
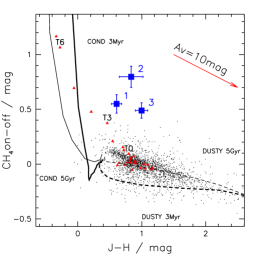
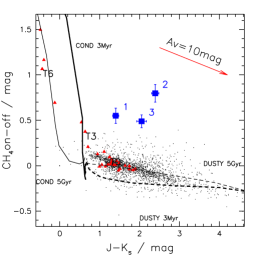
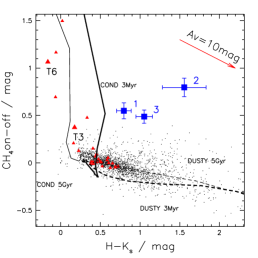
Estimation of the candidates’ extinction is required in order to be able to calculate their absolute magnitude and estimate their spectral type. Extinction has been estimated using colour/colour diagrams of onoff versus , and , as plotted in Figure 6. The extinction was computed for each candidate using the extinction vector and regressing the objects back towards the 3 Myr COND model. The final extinction value is the average of the 3 results obtained from each colour/colour diagram and is summarised in Table 4, along with onoff colour, detection level and spectral type for the three candidates. The estimated extinction is an upper limit if the candidates belong to the cluster as their true dereddened colours are probably intermediate between the 3 Myr COND and DUSTY models. If they are field dwarfs however, the given value is a lower limit as the objects should be dereddened towards the 5 Gyr field dwarf sequence that is bluer than the 3 Myr COND model.
 |
 |
 |
| IAU name | (on-off) | Det. | AV/mag | Est. sp. | Distance from | Object coordinates |
|---|---|---|---|---|---|---|
| (mag) | level | type | cluster centre | |||
| CFHT_J0344+3202_(IC348_CH4_1) | 0.54 | 4.3 | 5.0 1.2 | T5 | 7′35″ | 03h44m49s.24 +32∘02′484 |
| CFHT_J0344+3206_(IC348_CH4_2) | 0.78 | 6.2 | 12.4 3.9 | T6 | 4′20″ | 03h44m49s.52 +32∘06′354 |
| CFHT_J0344+3156_(IC348_CH4_3) | 0.49 | 4.3 | 9.0 1.3 | T5 -0.5 | 13′56″ | 03h44m57s.95 +31∘56′433 |
We then used these results to compute the dereddened onoff colour for each candidate. We found these values to be 0.69 0.16, 1.15 0.24 and 0.76 0.15 mag for IC348_CH4_1, IC348_CH4_2 and IC348_CH4_3, respectively. From Figure 2, these dereddened colours correspond to a spectral type of T5, T6, and T5 for IC348_CH4_1, IC348_CH4_2 and IC348_CH4_3, respectively. As noted above, this may be a lower estimate as the models suggest that young T-dwarfs have a lower effective temperature than field T-dwarfs for the same onoff colour (see Fig.3). Moreover, if the candidates were 5 Gyr field objects, they would have a larger extinction and therefore an even larger intrinsic onoff colour, which would also yield a later spectral type.
4 Discussion
We discuss here the likelihood that the methane candidates reported above are bona fide young, very low-mass members of the IC~348 star-forming region instead of being more evolved field T-dwarfs located on the line of sight to the young cluster. We also compare the number of T-dwarf candidates we identify in our survey to the number of expected planetary mass objects in IC~348, by extrapolating recent estimates of the substellar IMF to the planetary mass domain.
4.1 Membership
Further colour/colour and colour/magnitude diagrams (CMD) were plotted to constrain the candidates’ status. Figure 7 shows the CMD. Also plotted are the synthetic magnitudes and colours of the field T-dwarfs when shifted to the cluster distance. The 5 Gyr DUSTY and COND models are drawn to highlight the agreement between the models and the field dwarf sequence. The field T-dwarf sequence begins in between the 5 Gyr DUSTY and COND models, before sweeping towards the 5 Gyr COND model at 1500 K that sharply increases in faintness with the late-T set.
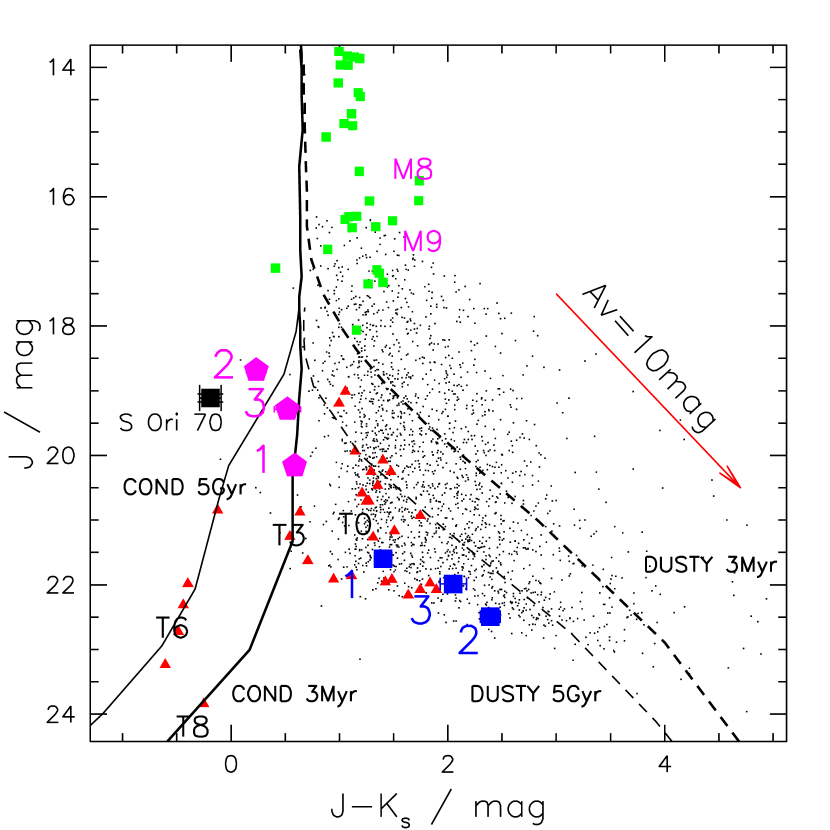
In this diagram the three candidates appear to be confused with the late-L, early-T field dwarfs. However, once they are dereddened using the extinction values given in Table 4, they become bluer and brighter. All three candidates appear to follow the 3 Myr COND model quite closely. The fact that the dereddened candidates appear brighter than field T-dwarfs shifted to the cluster distance suggest that they are younger indeed. A young T-dwarf has a larger radius than a field T-dwarf for a given spectral type as it is still contracting. According to the COND models, the difference amounts to about a factor of 2 in radius between 3 Myr and 5 Gyr (for Teff=1000-1500 K), which results in a 1.5 magnitude increase, consistent with the observed location of the candidates in Figure 7.
There is a possibility that the candidates are in fact field T-dwarfs located at a closer distance (between 100 and 200 pc) along the line of sight to IC~348. The probability of one of the candidates being a field T-dwarf instead of an IC~348 cluster member can be estimated independently from extinction. According to Figure 2, the spectral type range T3-T5.5 corresponds to the measured onoff colours of our candidates at an age of 5 Gyr. Thusly, using the number density of T3-T5.5 field dwarfs in the solar neighbourhood, i.e. 1 per 714 pc3 according to Metchev et al. (2008) and the footprint of the image of 0.11 sq.deg. gives an estimate of 0.11 0.06 T3-T5.5 foreground field dwarfs in the direction of IC~348. As we are concerned here with the probability of one of our candidates being a foreground field dwarf, this is a fairly robust method for determining the population density for field dwarfs in the direction of IC~348. However, this estimate is put into context when taking into account the large extinction values of the three candidates estimated from Figure 6. Even the least extincted candidate, IC348_CH4_1, has four magnitudes more extinction than expected for a foreground field dwarf (<1 mag), so all three objects must be near to or behind IC~348. However, the candidates cannot be background field T-dwarfs, seen through the IC~348 cloud, as their luminosity would then be much too high for their estimated spectral type. Finally, as indicated in Table 4, all three candidates are located within the cluster’s boundary (4′ core radius, 10-15′ halo; Herbig 1998, Herbst 2008) and are thus spatially consistent with being IC~348 members.
4.2 Contaminants
A further, useful diagram in defining these candidate objects is the / colour/colour diagram shown in Figure 8, (note that the is in the AB system). Here it can be seen that the two detected dereddened candidates are much bluer in than both the field dwarf sequence and the COND 3Myr and 5Gyr models. There is mounting empirical evidence for young T-dwarfs to have bluer colours than field T-dwarfs because of the effects reduced gravity has on the opacities (P. Delorme, priv. comm.). This effect stems from the strong potassium KI (7687&7701 m) doublets, whose wings fall within the band. The lower the gravity the lesser the line broadening of these elements so less flux is lost by absorption in the band, resulting in the observed bluer colours (F. Allard, priv. comm). However, these effects are unlikely to explain the extreme blueness of two of the three objects and suggests that candidates IC348_CH4_1 and IC348_CH4_3 are unlikely to be T-dwarfs. The final remaining candidate, IC348_CH4_2, remains a good T-dwarf candidate because of its non-detection in .
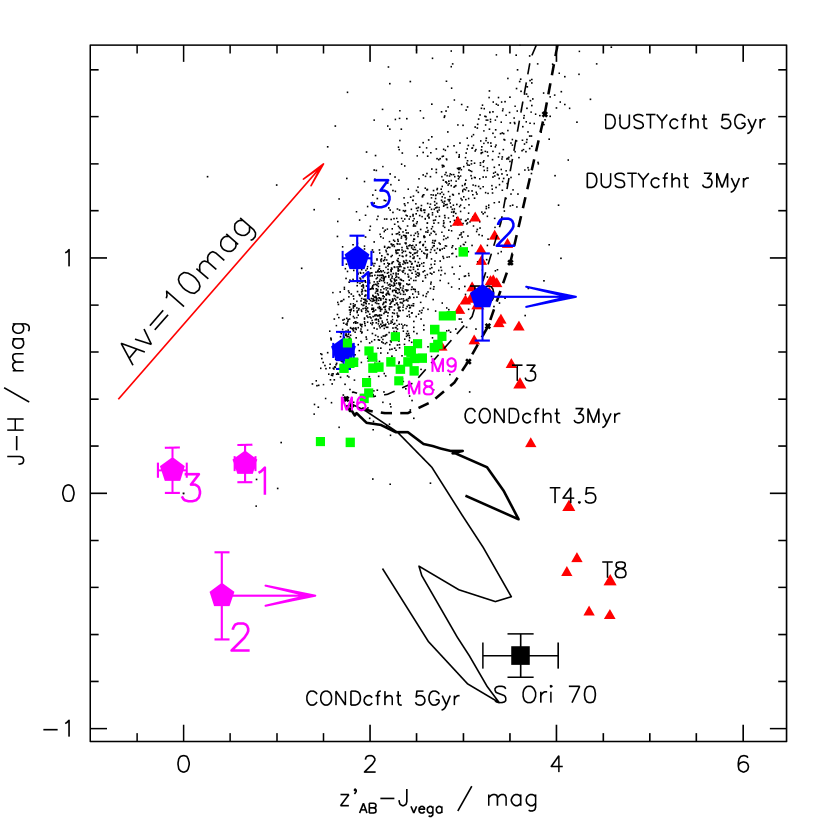
If candidates IC348_CH4_1 and IC348_CH4_3 are not young T-dwarfs then what are they? We checked whether extragalactic objects could contaminate this region of the diagrams. To this end, galaxies777iras.ipac.caltech.edu from SWIRE, 2MASS and SDSS were found to have very different colours ( 6-8mag) to our candidates. Similarly, quasars (Labita et al., 2008) also have J-band magnitudes of 24-25 mag, making them much fainter than our objects. Late-type (emission line) galaxies appear tightly in the region 0.95 mag and 0.88 mag and so again cannot be confused with our candidates (Chang et al., 2006). The status of the two rejected candidates continues to be unclear.
4.3 Comparison of IC348_CH4_2 with S Ori 70
Zapatero Osorio et al. (2002) found S Ori 70 to be a faint mid-T type object towards the direction of the young Orionis cluster, with an estimated mass in the interval 2-7 MJup. However, there has been some contention with regard to the membership of S Ori 70 to the Orionis cluster. Further work by Scholz & Jayawardhana (2008) indicated that this was a true cluster member by looking at the IRAC data, and suggested that there is a possibility of a disk structure which gives rise to the MIR excess.
The CMD in Figure 7 has the IC 348 dereddened candidates plotted alongside S Ori 70 for comparison. The and data for S Ori 70 was taken from Zapatero Osorio et al. (2008) and adjusted to the CFHT photometric system using the 3 Myr COND CFHT and 2MASS models. The differences for due to colour effects are 0.6 mag, -0.1 mag, and -0.05 mag, for , and respectively. In this diagram, candidate IC348_CH4_2, for which we estimated a spectral type of T6, falls at approximately the same location as S Ori 70, shifted to IC~348’s distance.
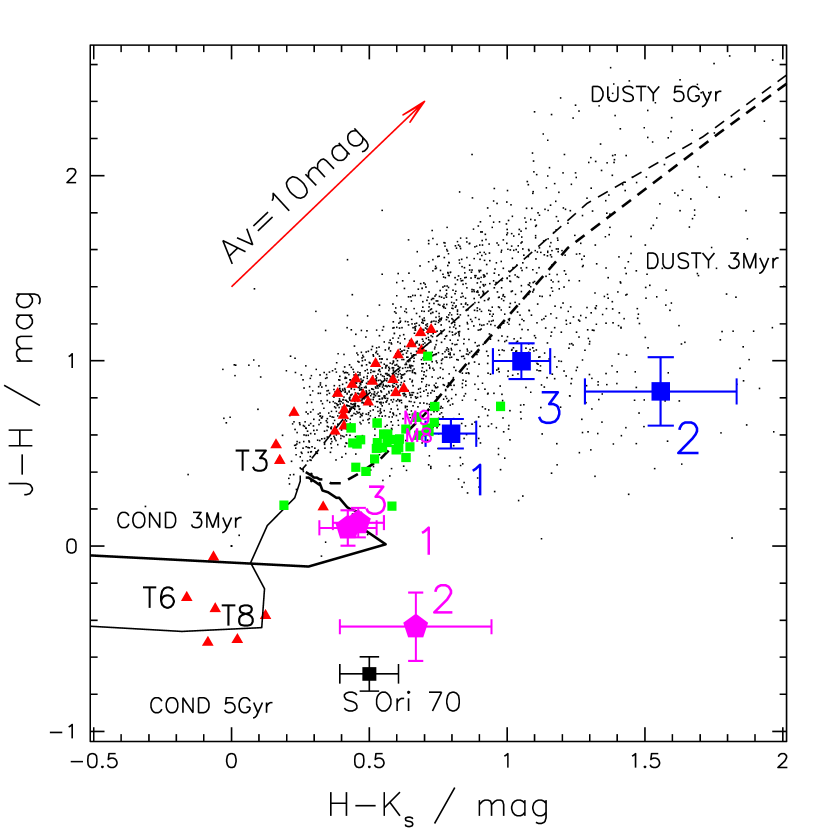
Figure 9 shows the colour/colour diagram. The dereddened colours of remaining IC348_CH4_2 T-dwarf candidate is -0.44 which corresponds to a spectral type of around T6-T8 (Luhman et al., 2007) and so is consistent with our previous estimate. Again in this plot, the location of IC348_CH4_2 is similar to that of S Ori 70. A remarkable property of these two objects is that they have colours too red for their estimated spectral types, yet also have blue colours consistent with them being T6 dwarfs. According to Zapatero Osorio et al. (2008), this may be a signature of youth.
4.3.1 Spitzer data
We searched the Spitzer public archive for IRAC data. IC 348 was the prime target of programmes 6 (c2d, P.I. Fazio) and 36 (P.I. Fazio). The c2d data are made up by shorter exposures, resulting in our use of the deeper (16100s) images of programme 36. We retrieved the data and processed them using standard procedures with the recommended MOPEX software. All three candidates are detected in the and bands, except IC348_CH4_1 which falls out of the band field of view. PSF photometry was performed using Starfinder (Diolaiti et al., 2000) and the fluxes were translated into magnitudes using the zeropoint fluxes provided by the Spitzer Science Center888http://ssc.spitzer.caltech.edu/. Measurement uncertainties were tentatively estimated from the Poisson noise weighted by the coverage maps of the mosaics. The final photometry is given in Table 5, and the final errors include both measurement and zeropoint flux uncertainties.
| Object | F/mJy | F_error | F/mJy | F_error | [3.6]/mag | [3.6]_error | [4.5]/mag | [4.5]_error |
|---|---|---|---|---|---|---|---|---|
| IC348_CH4_1 | 0.0035 | 0.0001 | - | - | 19.75 | 0.03 | - | - |
| IC348_CH4_2 | 0.0093 | 0.0003 | 0.0136 | 0.0004 | 18.70 | 0.03 | 17.80 | 0.03 |
| IC348_CH4_3 | 0.0245 | 0.0003 | 0.0365 | 0.0007 | 17.65 | 0.02 | 16.73 | 0.02 |
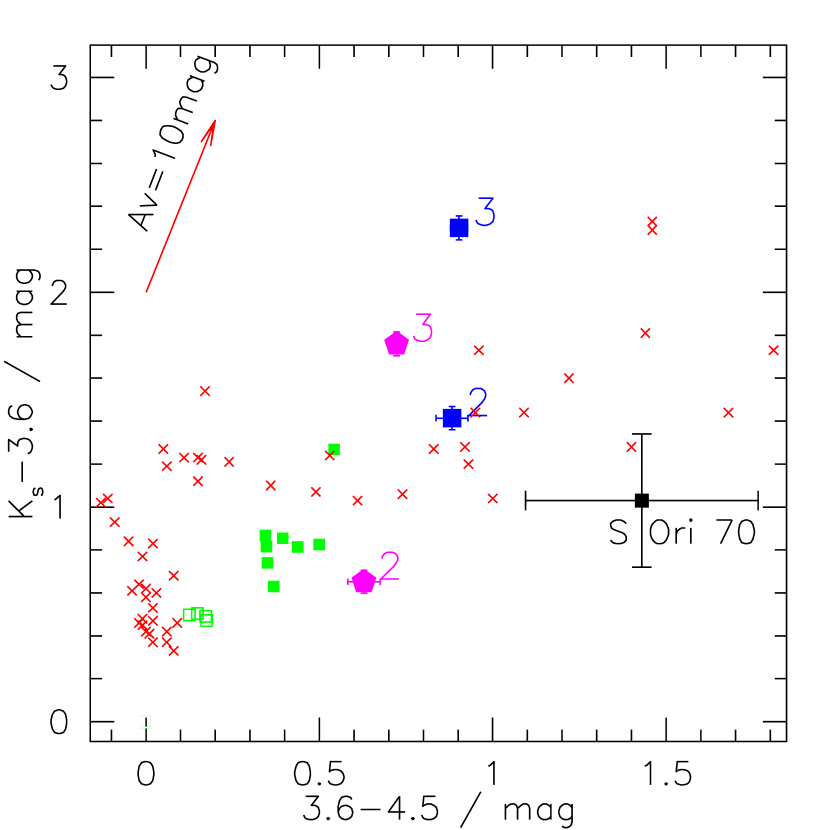
In Figure 3, the vs colour/colour diagram is plotted with the two candidates, S Ori 70 and the IC~348 M6-M9 dwarf sequence from Luhman et al. (2005). The M, L and T IRAC field dwarf sequence from Patten et al. (2006) have also been plotted for comparison. The colour could be a good indicator of effective temperature, or spectral type, giving IC348_CH4_2 a spectral type of T5, in line with our other estimates of T6. The colour, however, relates to a spectral type of L1, which is far too early for such a low-mass and cool object.
The colour of IC348_CH4_2 appears significantly bluer compared to the field sequence, which may be because of reduced gravity (Leggett et al., 2007). For mid-type and later T-dwarfs the reduced pressure broadening of H2, as a gravity effect, makes the band brighter, whilst the band faintens because of additional CH4 absorption at 3 m, resulting in a bluer colour. Another consequence of lower gravity is the faintening effect the CO abundances have on the band for early T-types, thus balancing the colour. These colour effects of low gravity are in agreement with this object being a young IC 348 T-dwarf.
Other effects such as strong sedimentation and little or no vertical mixing in the atmosphere could also contribute to the observed bluer colours (Leggett et al., 2007).
The possible existence of a hot inner dusty disc around S Ori 70, in keeping with other young members of S Orionis, can give rise to its redder colour.
4.4 The lower end of the IMF
Luhman et al. (2003) derived a nearly complete IMF for IC~348 down to 0.03 M☉ for A 4 mag. They find a ratio of brown dwarfs (BDs, 0.02-0.08 M⊙) to stars of about 12%. Muench et al. (2003) similarily derived an IMF for IC~348 down to 0.04 M⊙, with a mode between 0.08 and 0.2 M⊙, finding a ratio of BDs to stars of about 14%. From a deep J-band survey of the cluster, Preibisch et al. (2003) derived a BD to star ratio of 10%.
According to the COND and DUSTY models, the mass range of 3 Myr old T-dwarfs is between 0.001 M☉ and 0.005 M☉, corresponding to masses from 1 MJup to 5 MJup. However, the models are somewhat uncertain at very low masses and young ages. Currently the models can have up to a 50% discrepancy in the masses for objects younger than 5 Myr (Chabrier, priv. comm). Still, the T-dwarf candidate IC348_CH4_2 is likely to be less massive than 10 MJup if belonging to IC~348.
In order to obtain an estimate of the number of objects within this mass range that are expected to be in IC~348, we extrapolated current estimates of the IMF to the planetary mass regime. A lognormal estimate of the field IMF for unresolved systems was provided by Chabrier (2003), where the mode of the distribution, , is 0.22 M☉ and its width, , is 0.57. This lognormal IMF would predict 1% objects in the mass range below 10 MJup. Similarily, Moraux et al. (2007) suggested a universal lognormal IMF for systems in young open clusters, with =0.30 0.05 M☉ and =0.55 0.03, which would predict 0.4% of objects in the 1-10 MJup mass range. Muench et al. (2007) conducted a Spitzer census of IC~348 and stated that the population of IC~348 is in excess of 400 members when taking into account unseen diskless members. Based on the above IMF and population estimates, we would thus expect about 1.6-4 objects in the mass range 1-10 MJup in the cluster. The discovery of one T-dwarf candidate close to the completeness limit is thus consistent with the extrapolation of current lognormal IMF estimates down to the planetary mass domain.
Another estimate can be found using the power law derived by Caballero et al. (2007) and Lodieu et al. (2009) for $σ$ Orionis and Lodieu et al. (2007) for Upper Sco, , where = 0.6 for the mass range M☉. Using the IMF from the A 4 mag selected census of IC~348 by Luhman et al. (2003) and extrapolating the power law for the last two data points above their completeness limit towards the lowest mass domain gives a different estimate. This corresponds to a much larger number of predicted objects than for the lognormal estimate, 25 16 objects in the 1-10 MJup mass range and 15 9 objects in the 1-5 MJup mass range. Even though our survey is complete down to A 12 mag for T3 - T5.5 dwarfs, we did not detect any such object with an A 4 mag. This suggests that the current power law approximation over-estimates the number of low-mass objects in IC~348.
5 Conclusions
From a deep methane imaging survey of the star-forming region IC~348 we identified 3 T-dwarf candidates over the area of the cluster. After colour/colour and colour/magnitude diagram analysis two candidates have been rejected for being too bright at optical wavelengths. The remaining candidate, has an estimated spectral type of T6 and theoretical models suggest a mass of a few MJup for this object at 3 Myr. From its luminosity, colour, extinction and spatial location, IC348_CH4_2 is a probable IC~348 T-dwarf member, and so is among the lowest mass objects observed so far in a star-forming region. The frequency of isolated planetary mass objects reported here for IC~348 is consistent with the extrapolation of current lognormal IMF estimates to the planetary mass domain.
Acknowledgements.
We thank F. Allard for many discussions during the writing of this paper, and also to the referee for providing insightful comments with regard to this work. Many thanks goes to P. Delorme for his useful comments regarding cool dwarfs. We thank also Manuel Perger and David Barrado y Navascués for discussions and Subaru data. We thank the QSO team at CFHT for their efficient work at the telescope and the data pre-reduction as well as the Terapix group at IAP for the image reduction. This work is based in part on data products produced and image reduction processes conducted at TERAPIX. This research has made use of the NASA/ IPAC Infrared Science Archive, which is operated by the Jet Propulsion Laboratory, California Institute of Technology, under contract with the National Aeronautics and Space Administration. This research has also made use of the SIMBAD database, operated at CDS, Strasbourg, France.References
- Allard et al. (2001) Allard, F., Hauschildt, P. H., Alexander, D. R., Tamanai, A., & Schweitzer, A. 2001, ApJ, 556, 357
- Baraffe et al. (2003) Baraffe, I., Chabrier, G., Barman, T. S., Allard, F., & Hauschildt, P. H. 2003, A&A, 402, 701
- Bertin (2008) Bertin, E. 2008, SAIt, 75, 282
- Bertin & Arnouts (1996) Bertin, E. & Arnouts, S. 1996, A&AS, 117, 393
- Boulade et al. (2003) Boulade, O., Charlot, X., Abbon, P., et al. 2003, in Presented at the Society of Photo-Optical Instrumentation Engineers (SPIE) Conference, Vol. 4841, Society of Photo-Optical Instrumentation Engineers (SPIE) Conference Series, ed. M. Iye & A. F. M. Moorwood, 72–81
- Burgasser et al. (2004) Burgasser, A. J., Kirkpatrick, J. D., McGovern, M. R., et al. 2004, ApJ, 604, 827
- Burrows et al. (2006) Burrows, A., Sudarsky, D., & Hubeny, I. 2006, ApJ, 640, 1063
- Caballero et al. (2007) Caballero, J. A., Béjar, V. J. S., Rebolo, R., et al. 2007, A&A, 470, 903
- Cambrésy et al. (2006) Cambrésy, L., Petropoulou, V., Kontizas, M., & Kontizas, E. 2006, A&A, 445, 999
- Cernis (1993) Cernis, K. 1993, Baltic Astronomy, 2, 214
- Chabrier (2003) Chabrier, G. 2003, PASP, 115, 763
- Chabrier et al. (2000) Chabrier, G., Baraffe, I., Allard, F., & Hauschildt, P. 2000, ApJ, 542, 464
- Chang et al. (2006) Chang, R., Shen, S., Hou, J., Shu, C., & Shao, Z. 2006, MNRAS, 372, 199
- Delorme et al. (2008) Delorme, P., Willott, C. J., Forveille, T., Delfosse, X., Reylé, C., Bertin, E., Albert, L., Artigau, E., Robin, A. C., Allard, F., Doyon, R., Hill, G. J. 2008, A&A, 484, 469
- Diolaiti et al. (2000) Diolaiti, E., Bendinelli, O., Bonaccini, D., et al. 2000, A&AS, 147, 335
- Faherty et al. (2009) Faherty, J. K., Burgasser, A. J., Cruz, K. L., et al. 2009, AJ, 137, 1
- Herbig (1998) Herbig, G. H. 1998, ApJ, 497, 736
- Herbst (2008) Herbst, W. 2008, Handbook of Star Forming Regions, 6280, 17
- Labita et al. (2008) Labita, M., Treves, A., & Falomo, R. 2008, MNRAS, 383, 1513
- Leggett et al. (2007) Leggett, S. K., Saumon, D., Marley, M. S., et al. 2007, ApJ, 655, 1079
- Lodieu et al. (2007) Lodieu, N., Hambly, N. C., Jameson, R. F., et al. 2007, MNRAS, 374, 372
- Lodieu et al. (2009) Lodieu, N., Zapatero Osorio, M. R., Rebolo, R., Martin, E. L., & Hambly, N. C. 2009, ArXiv e-prints
- Luhman et al. (2005) Luhman, K. L., Lada, C. J., Hartmann, L., et al. 2005, ApJ, 631, L69
- Luhman et al. (2007) Luhman, K. L., Patten, B. M., Marengo, M., et al. 2007, ApJ, 654, 570
- Luhman et al. (2003) Luhman, K. L., Stauffer, J. R., Muench, A. A., et al. 2003, ApJ, 593, 1093
- Mainzer & McLean (2003) Mainzer, A. K. & McLean, I. S. 2003, ApJ, 597, 555
- Marmo (2007) Marmo, C. 2007, in Astronomical Society of the Pacific Conference Series, Vol. 376, 285–+
- Martín (2004) Martín, E. L. 2004, ArXiv Astrophysics e-prints
- Metchev et al. (2008) Metchev, S. A., Kirkpatrick, J. D., Berriman, G. B., & Looper, D. 2008, ApJ, 676, 1281
- Moraux et al. (2007) Moraux, E., Bouvier, J., Stauffer, J. R., Barrado y Navascués, D., & Cuillandre, J.-C. 2007, A&A, 471, 499
- Muench et al. (2007) Muench, A. A., Lada, C. J., Luhman, K. L., Muzerolle, J., & Young, E. 2007, AJ, 134, 411
- Muench et al. (2003) Muench, A. A., Lada, E. A., Lada, C. J., et al. 2003, AJ, 125, 2029
- Patten et al. (2006) Patten, B. M., Stauffer, J. R., Burrows, A., et al. 2006, ApJ, 651, 502
- Preibisch et al. (2003) Preibisch, T., Stanke, T., & Zinnecker, H. 2003, A&A, 409, 147
- Puget et al. (2004) Puget, P., Stadler, E., Doyon, R., et al. 2004, in Presented at the Society of Photo-Optical Instrumentation Engineers (SPIE) Conference, Vol. 5492, Society of Photo-Optical Instrumentation Engineers (SPIE) Conference Series, ed. A. F. M. Moorwood & M. Iye, 978–987
- Scholz & Jayawardhana (2008) Scholz, A. & Jayawardhana, R. 2008, ApJ, 672, L49
- Scholz et al. (1999) Scholz, R.-D., Brunzendorf, J., Ivanov, G., et al. 1999, A&AS, 137, 305
- Tinney et al. (2005) Tinney, C. G., Burgasser, A. J., Kirkpatrick, J. D., & McElwain, M. W. 2005, AJ, 130, 2326
- Zapatero Osorio et al. (2008) Zapatero Osorio, M. R., Béjar, V. J. S., Bihain, G., et al. 2008, A&A, 477, 895
- Zapatero Osorio et al. (2002) Zapatero Osorio, M. R., Béjar, V. J. S., Martín, E. L., et al. 2002, ApJ, 578, 536