Spectral analysis of the Crab Pulsar and Nebula with the Fermi Large Area Telescope
Abstract
The Crab Pulsar is a relatively young neutron star. The pulsar is the central star in the Crab Nebula, a remnant of the supernova SN 1054, which was observed on Earth in the year 1054. The Crab Pulsar has been extensively observed in the gamma-ray energy band by the Large Area Telescope (LAT), the main instrument onboard the Fermi Gamma-ray Space Telescope, during its first months of data taking. The LAT data have been used to reconstruct the fluxes and the energy spectra of the pulsed gamma-ray component and of the gamma-rays from the nebula. The results on the pulsed component are in good agreement with the previous measurement from EGRET, while the results on the nebula are consistent with the observations from Earth based telescopes.
keywords:
Crab Pulsar , Crab NebulaPACS:
11.xx.221 Introduction
The Fermi Gamma-Ray Space Telescope was launched by NASA on June 11, 2008 from Cape Canaveral, and started taking data in sky survey mode and in nominal science configuration on August 4, 2008. The main instrument onboard Fermi is the Large Area Telescope (LAT) [1], a pair conversion telescope that covers a photon energy range extending from beyond . Fermi is moving on a quasi-circular orbit at altitude with an inclination of , and observes the whole sky every 2 orbits (corresponding to ).
The Crab Pulsar and nebula are the remnants of the explosion of a supernova reported by Chinese astronomers in 1054. The Crab Pulsar, with a spin-down power , is one of the most energetic known pulsars. It is located at a distance of about [2] from Earth and is spinning with a period of [3].
Both the Pulsar and Nebula have been extensively observed in all the energy bands, from radio to high energy -rays. In this paper we report the results of a spectral analysis performed on both the Crab Pulsar and Nebula using the data collected by the Fermi LAT during its first 8 months of operation.
2 Radio timing analysis
The timing solution for the Crab Pulsar is built using the data collected from the Nançay and Jodrell radiotelescopes, that are involved in the LAT pulsar timing campaign [4]. The Crab ephemeris has been built with the TEMPO2 [5] package, using a set of observations at and observations at , collected between August 2008 and April 2009 [6, 7].
3 Analysis of the Fermi LAT data
3.1 Event selection
For this analysis [6, 7] we have considered a data sample covering the period from August 2, 2008 to April 7, 2009. In particular, we have used only “diffuse” class [1] photon events, that ensure the most effective background rejection. Events with zenith angles larger than have been excluded from the analysis, in order to avoid contaminations from the Earth albedo gamma-rays.
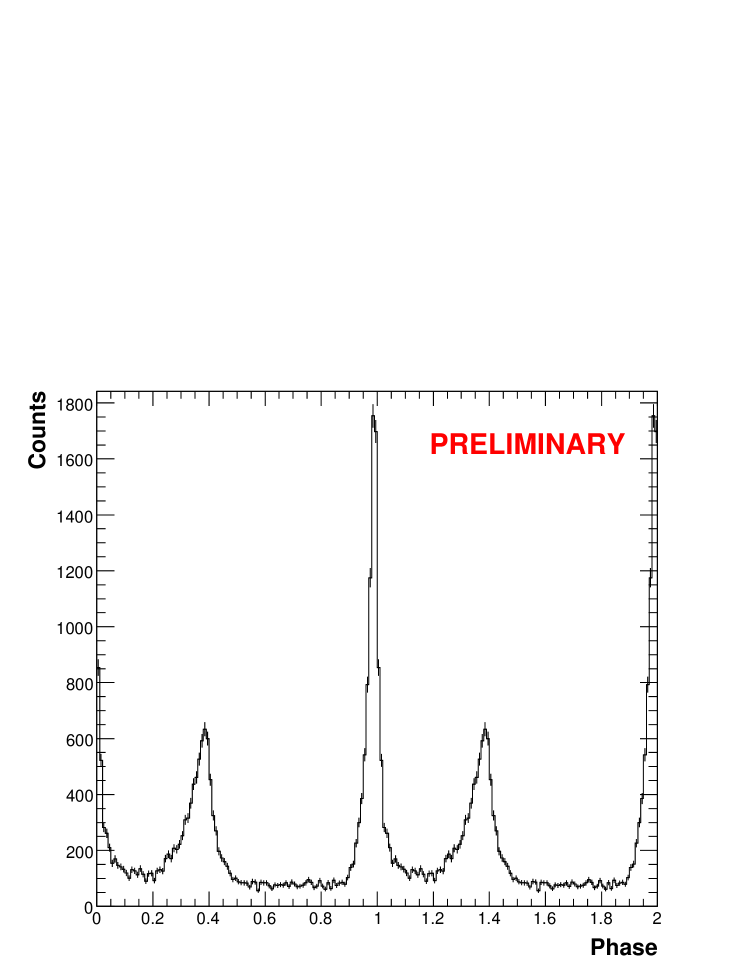
Figure 1 shows the Crab Pulsar phase histogram obtained selecting photons with energies above and with an angular separation from the nominal source position less than
where is the photon energy. The phase corresponds to the position of the main radio peak. The Crab phase histogram exhibits two peaks at phases and respectively. The off-pulse window is defined in the phase range from to .
3.2 Spectral analysis of the Nebula
The spectral analysis has been performed following two different and complementary strategies. In the first case, the spectra are reconstructed using a maximum likelihood approach, that is implemented in the Fermi science tool “gtlike” [8]. In the second case, the spectra have been evaluated using an iterative unfolding procedure based on the Bayes theorem [9, 10].
The maximum likelihood spectral analysis of the nebula has been performed selecting photons in the off-pulse window, in a region centered on the nominal pulsar position, and with energies in the range from to . The galactic background component has been modeled using GALPROP [11], while the extragalactic component and the instrumental background have been described with a single isotropical power law spectrum. The Crab Nebula spectrum is well described by a sum of two power law spectra:
| (1) |
where . The two terms at the right hand side of eq. 1 are labeled with the indices and because they are identified respectively with the falling edge of the synchrotron component and with the rising edge of the Inverse Compton component of the spectrum.
The best fit values of the parameters are , , and , where both statistical and systematic errors are quoted. The latter, that are originated from the uncertainties in the LAT response, have been evaluated using modified instrument response functions with respect to the nominal ones.
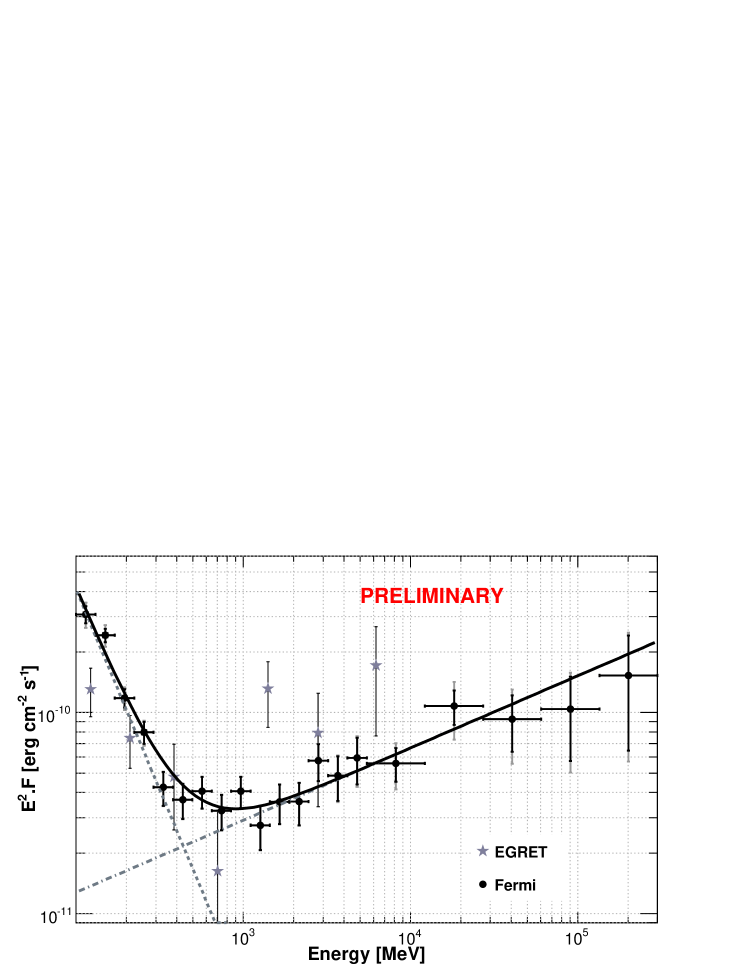
Figure 2 shows the spectral energy distribution of the Crab Nebula. The spectral points superimposed to best fit function have been obtained performing a maximum likelihood fit in individual energy bins. In this case a simple power law shape has been assumed for the source spectrum in each energy bin. In figure 2 the Fermi results are also compared with the spectral point obtained by EGRET [12]. At energies below the flux measured by Fermi is higher than the one measured by EGRET. On the other hand, at higher energies, EGRET measured a higher flux than Fermi .
In the unfolding analysis, the Crab Nebula spectrum has been reconstructed without assuming any spectral model and without performing any fit. This analysis technique also allows to take into account the energy dispersion introduced by the detector response, that is not considered in the maximum likelihood approach. The observed count spectrum of the Nebula, used as input for the unfolding analysis, is built selecting the photons in the off-pulse window, and subtracting the background counts, evaluated using the background model obtained from the “gtlike” fit. The unfolded spectrum of the Nebula is in good agreement with the one obtained from the likelihood analysis.
3.3 Spectral analysis of the Pulsar
The spectral analysis of the Crab Pulsar has been performed with the same two techniques used for the Nebula.
The maximum likelihood analysis of the pulsed emission has been done over the whole phase interval, including the Nebula in the background. The values of the spectral parameters of the Nebula reported in section 3.2 have been renormalized to match the whole phase interval and have been fixed. The pulsar spectrum has been fitted with an exponential cutoff power law spectrum given by:
| (2) |
where .
The best fit values of the parameters are , , and , where both statistical and systematic errors are quoted. We have also tried to perform a fit using a power law with a super-exponential cutoff, but the likelihood value was not significantly better than the one obtained using the function in eq. 2.
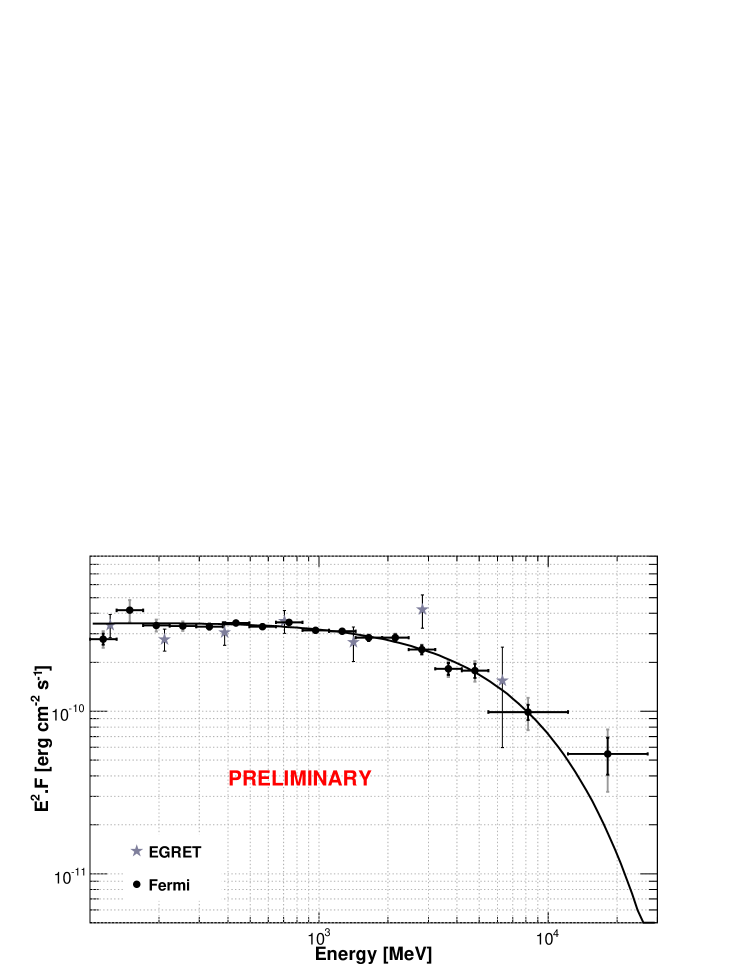
Figure 3 shows the spectral energy distribution of the Crab Pulsar. The spectral points superimposed to best fit function have been obtained performing a maximum likelihood fit in individual energy bins, with the same procedure described in section 3.2. In figure 3 the Fermi results are also compared with the spectral point obtained by EGRET [12]. The Fermi results are consistent with the EGRET ones in the energy range up to .
The spectrum of the Crab Pulsar has been also reconstructed using the unfolding analysis. In this case the observed count spectrum of the Pulsar is built selecting photons in the on-pulse phase window, and subtracting the background counts in the off-pulse window, properly rescaled for the on/off phase ratio (i.e. according to the definition in section 3.1). As for the Nebula, the unfolded spectrum of the Pulsar is consistent with the one evaluated from the maximum likelihood analysis.
4 Conclusions
We have measured the energy spectra of the Crab Pulsar and Nebula in the energy interval from to using a sample of data taken by the Fermi LAT during its first 8 months of operation in survey mode.
The spectrum of the Nebula is well modeled with a sum of two power laws, with spectral indices and , which describe respectively the falling edge of the synchrotron component and the rising edge of the Inverse Compton component. The pulsed emission is described by a power law spectrum with an exponential cutoff with spectral index and cutoff energy .
The spectral analysis has been performed using two different and complementary strategies, based respectively on a maximum likelihood fit and on an unfolding analysis. The spectra reconstructed with these two analysis techniques are in good agreement, thus confirming the reliability of our measurement.
The Fermi LAT has allowed a precise measurement of the spectra of both the Crab Pulsar and Nebula that has been made possible by the wider energy range and by the better energy sensitivity with respect to its predecessors.
Acknowledgements
The Fermi LAT Collaboration acknowledges support from a number of agencies and institutes for both development and the operation of the LAT as well as scientific data analysis. These include NASA and DOE in the United States, CEA/Irfu and IN2P3/CNRS in France, ASI and INFN in Italy, MEXT, KEK, and JAXA in Japan, and the K. A. Wallenberg Foundation, the Swedish Research Council and the National Space Board in Sweden. Additional support from INAF in Italy for science analysis during the operations phase is also gratefully acknowledged.
The Nançay Radio Observatory is operated by the Paris Observatory, associated with the French Centre National de la Recherche Scientifique (CNRS).
The Lovell Telescope is owned and operated by the University of Manchester as part of the Jodrell Bank Centre for Astrophysics with support from the Science and Technology Facilities Council of the United Kingdom.
References
- [1] W. Atwood et al., “The Large Area Telescope on the Fermi Gamma-Ray Space Telescope Mission”, The Astrophysical Journal 697 (2009), 1071
- [2] V. Trimble, “The distance to the Crab Nebula and NP0532”, Pub. Astron. Soc. Pacific, 85 (1973), 579
- [3] A. G. Lyne, R. S. Pritchard and F. Graham Smith, “23 years of Crab pulsar rotational history”, Mon. Not. Royal Astron. Soc. 265 (1993), 1003
- [4] D. A. Smith et al., “Pulsar timing for the Fermi gamma-ray space telescope”, Astronomy & Astrophysics, 492 (2008), 923
- [5] G. B. Hobbs et al., “TEMPO2, a new pulsar-timing package”, Mon. Not. Royal Astron. Soc. 369 (2006), 655
- [6] M.-H. Grondin, “Fermi LAT observations of the Crab nebula and pulsar”, Proc. of the ICRC, LODZ 2009.
- [7] The Fermi Collaboration, “Fermi Large Area Telescope Observations of the Crab Pulsar and Nebula”, submitted to Astroph. Jour.
- [8] J. R. Mattox et al., “The likelihood analysis of EGRET Data”, Astroph. Jour. 461 (1996), 396
- [9] G.D’Agostini, “A multidimensional unfolding method based on Bayes’theorem”, Nucl. Inst. and Meth. A362 (1995), 487
- [10] M. N. Mazziotta, “A method to unfold the energy spectra of point like sources from the Fermi LAT data”, Proc. of the ICRC, LODZ 2009.
- [11] A. Strong et al., “Diffuse Galactic continuum gamma rays. A model compatible with EGRET data and cosmic-ray measurements”, Astrop. Jour. 613 (2004), 962
- [12] L. Kuiper et al., “The Crab pulsar in the 0.75-30 MeV range as seen by CGRO COMPTEL”, Astron. and Astroph. 378 (2001), 918